Obesity and depression have become globally prevalent disorders and are significant risk factors for disability worldwide(1). The former could be defined as a BMI of 30 or more according to WHO criteria. The latter is a common psychological disorder(Reference Smith2) and is characterised by persistent low mood, exhibiting a spectrum of symptoms such as reduced physical activity, decreased cognitive function and weakened motivation(Reference Zhao, Sun and Liu3). Both disorders are co-morbid in individuals and may result in additive impairment in physical and mental health status(Reference Milaneschi, Simmons and Van Rossum4). The well-replicated association between depressive symptoms and disorders with obesity has been reported in both epidemiological studies and clinical studies using cross-sectional and longitudinal designs(Reference Patsalos, Keeler and Schmidt5). Furthermore, there is a convergence of sociodemographic, clinical, biological and treatment factors that may contribute to the association between depressive symptoms and obesity(Reference Minkwitz, Scheipl and Cartwright6).
Of note, recent research has indicated that dietary composition influences and may precipitate chronic inflammation(Reference Sureda, Bibiloni and Julibert7). Specifically, anti-inflammatory diets, such as the Mediterranean dietary pattern, could be a potential means of improving one’s mental well-being(Reference Tolkien, Bradburn and Murgatroyd8). Conversely, a pro-inflammatory diet (such as the Western dietary pattern) is often regarded as a potential risk factor for weight gain and psychological disorders(Reference Davis, Aslam, Jacka, Caballero, Finglas and Toldrá9).
The Dietary Inflammatory Index (DII) was designed to evaluate the inflammatory potential of food composition or diets(Reference Shivappa, Steck and Hurley10). Replicated studies have reported that individuals with obesity tend to consume low-quality, empty-calorie and energy-dense foods(Reference Hall, Guyenet and Leibel11), which are associated with inflammation(Reference Li, Zhan and Huang12). To categorise dietary patterns, researchers have developed the Energy-adjusted Dietary Inflammatory Index (E-DII) based on the DII(Reference Shivappa, Wirth and Murphy13). Participants with depression have higher inflammatory markers(Reference Yin, Gong and Zhang14) and higher DII/E-DII scores(Reference Gialluisi, Santonastaso and Bonaccio15). Thus, the pro-inflammatory balance seen in depression and obesity may be partially explained by dietary composition, especially a diet over-represented with pro-inflammatory constituents. However, some researchers have produced inconsistent evidence due to demographics, regional differences and other factors(Reference Shin, Shivappa and Hébert16), which suggests that the intermediate mechanism between obesity, DII/E-DII and depression has not yet been fully clarified. Crucially, previous National Health and Nutrition Examination Survey (NHANES)-based studies have independently established that both obesity and pro-inflammatory diets are associated with depressive symptoms, while the potential of dietary inflammation to play a role in the co-morbidity of obesity and depressive symptoms/depression remains poorly understood.
Herein, this study addresses this research gap, and the overarching aims are (1) to examine whether the potential of dietary inflammation mediates the association between obesity and depressive symptoms and (2) to evaluate the association among obesity, the potential of dietary inflammation and depressive symptoms among various population subgroups. We also acknowledge that our study employs a cross-sectional design, meaning the statistical results do not permit causal inference. Consequently, mediation analysis was conducted to explore and identify potential underlying pathways. Analysing the aforementioned relationships is expected to further inform translational research that endeavours to unravel mechanisms provoking immune-inflammatory systems in persons with obesity and depressive symptoms.
Methods
Study population
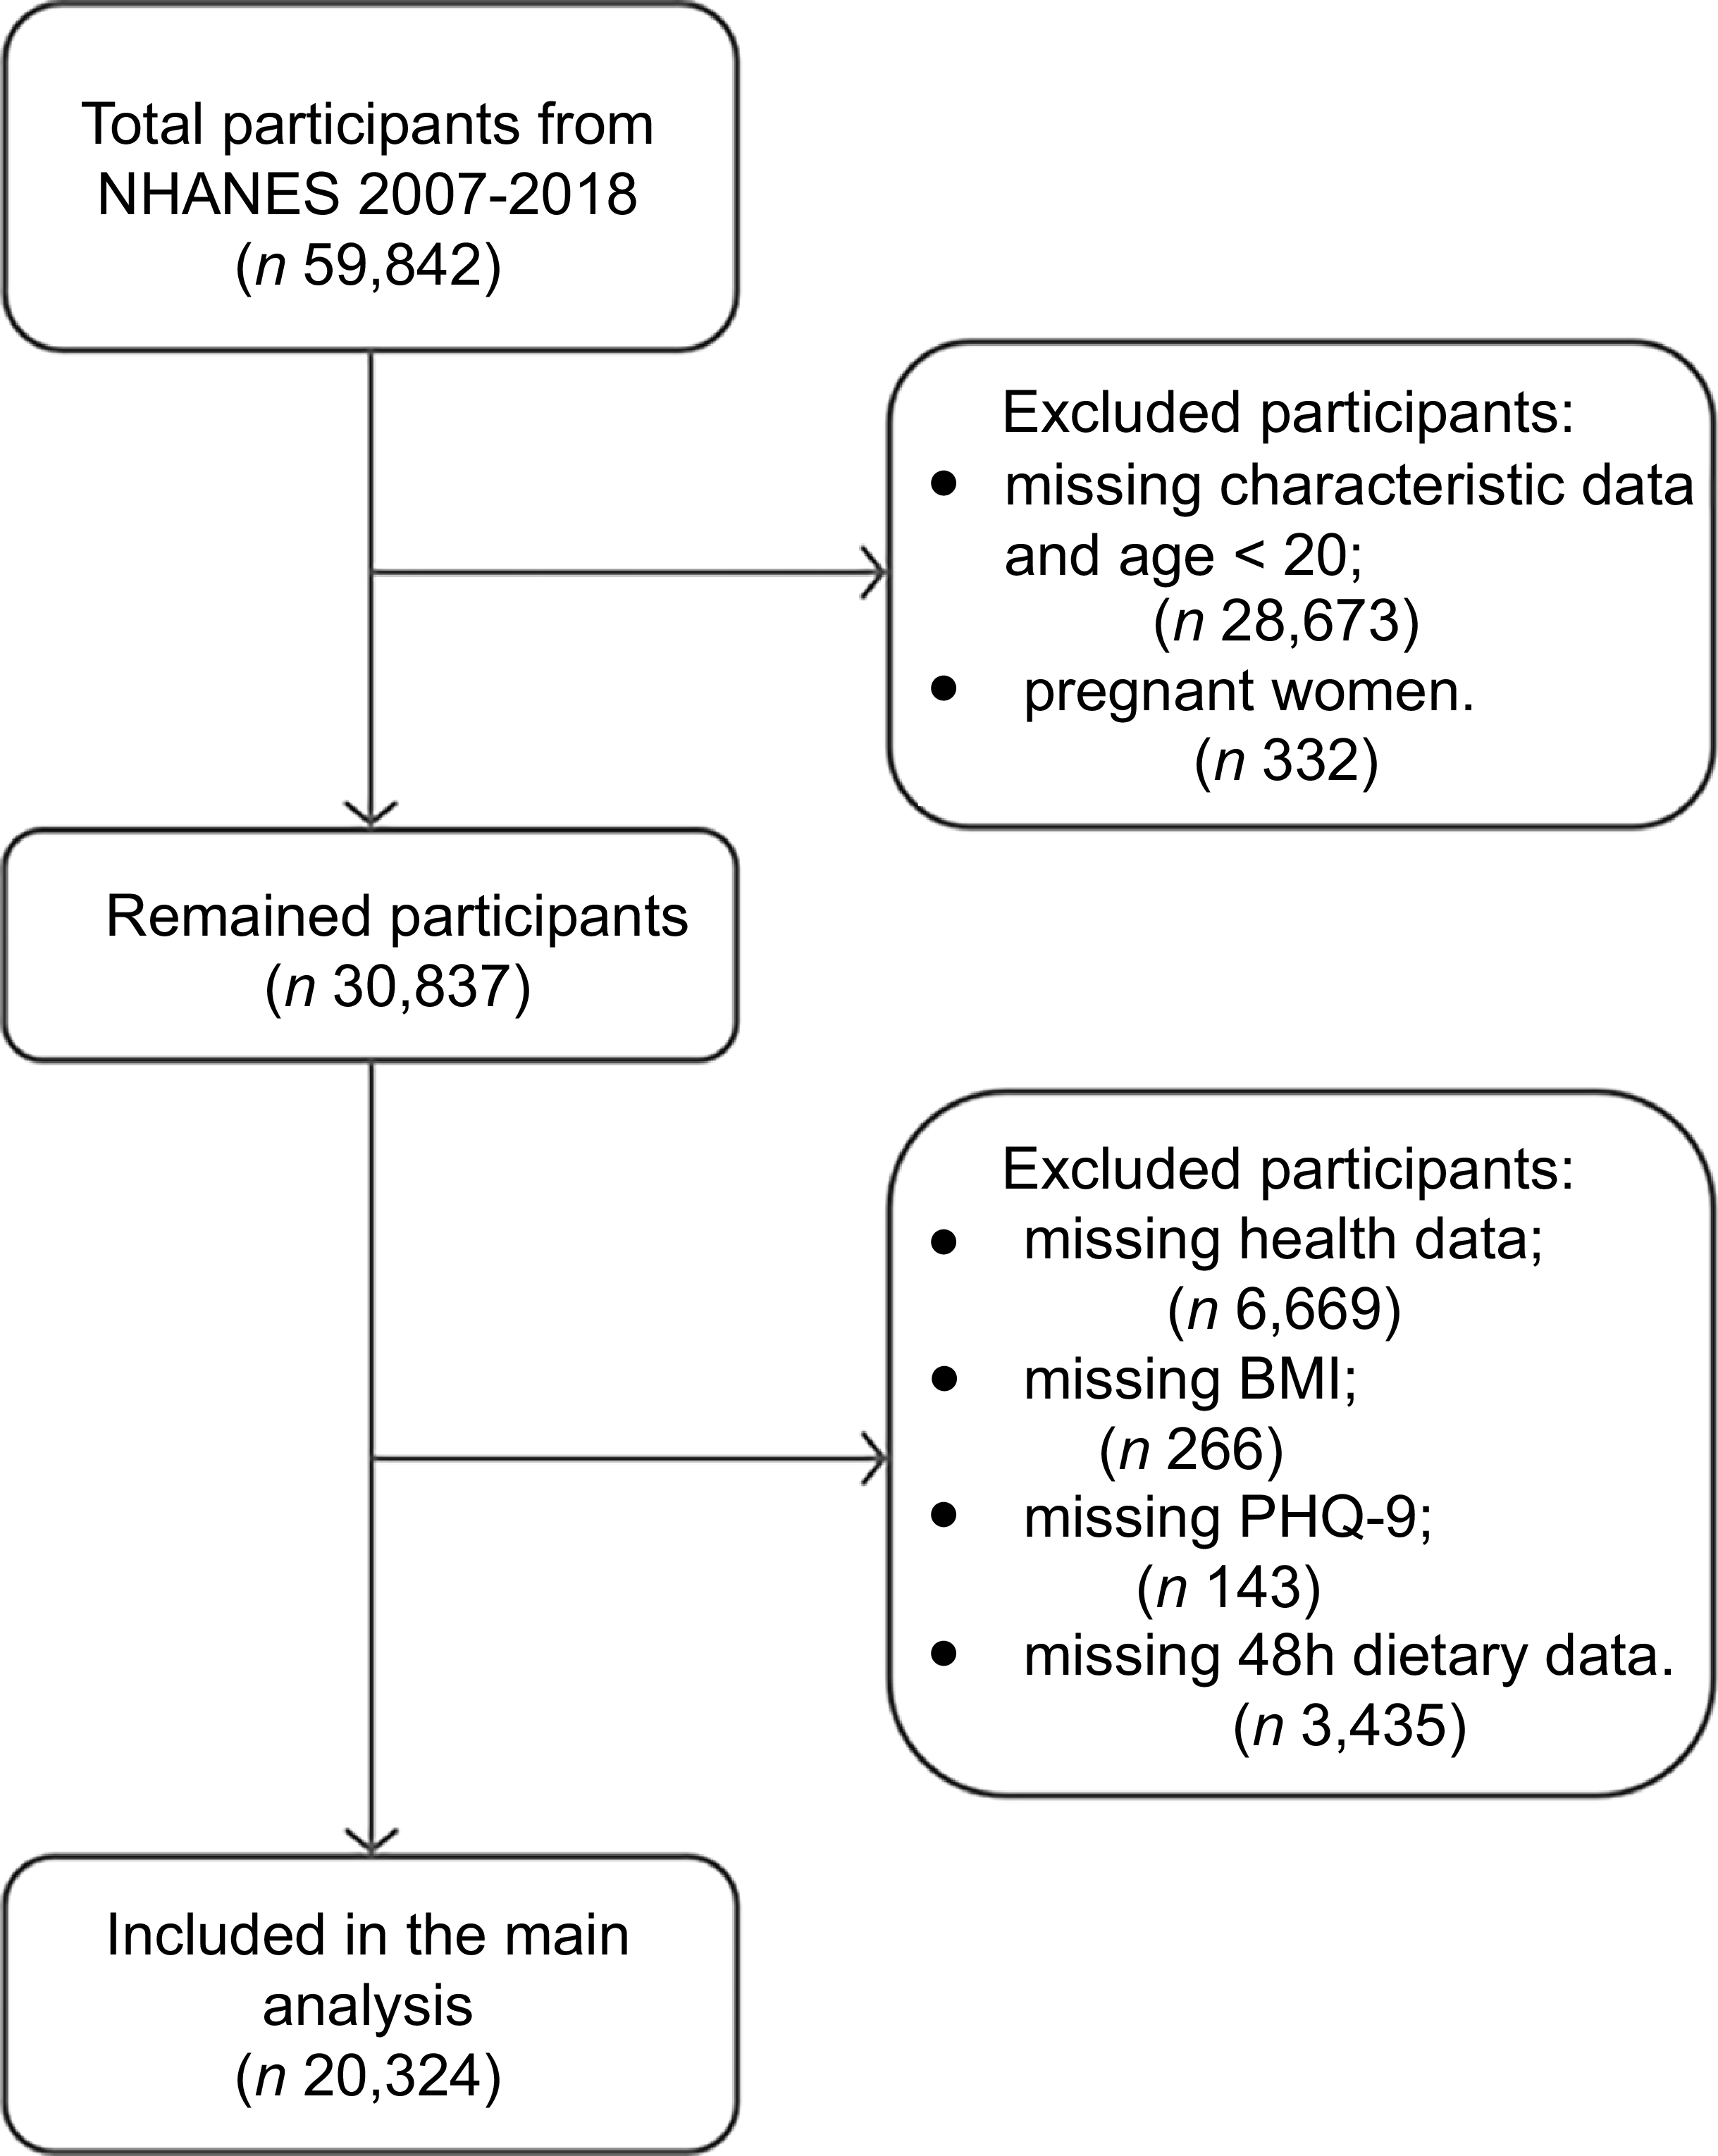
This was a cross-sectional study using data from the NHANES (2007–2018) conducted by the Centers for Disease Control and Prevention. The National Center for Health Statistics Research Ethics Review Board granted ethical approval for our study (ID: NCHS IRB/ERB Protocol #2005-06, Protocol #2018-01, https://www.cdc.gov/nchs/nhanes/irba98.html), and all participants signed informed consent forms before the survey. The present study included 59 842 participants, and after screening, a total of 20 324 participants remained (Figure 1). The exclusion criteria were as follows: (1) age < 20 years old(Reference Wang, Sun and Wang17); (2) pregnant women; and (3) cases with missing or unclear responses or those who declined participation.
Flow chart of sample selection from the NHANES 2007–2018. NHANES, National Health and Nutrition Examination Survey; PHQ-9, nine-item Patient Health Questionnaire-9.

Obesity
We used BMI to define obesity in adults, and the calculation of BMI was done by dividing an individual’s weight (in kilograms) by the square of their height (in metres). As defined by the WHO, BMI was classified as underweight (< 18·5 kg/m2), normal weight (≥ 18·5 kg/m2 and < 25 kg/m2), overweight (≥ 25 kg/m2 and < 30 kg/m2) and obese (≥ 30 kg/m2) based on physical examination data.
Energy-adjusted Dietary Inflammatory Index
Dietary data were derived from the average of two 24-h dietary recall interviews(Reference Wang, Sun and Wang17). To assess the dietary inflammatory potential, we calculated the DII using Shivappa’s method(Reference Shivappa, Steck and Hurley10). Based on the cross-national literature, this method employs a refined scoring algorithm to link individual dietary intake and the inflammatory potential of the diet with global norms, offering broad population generalisability. In the present study, DII scores were calculated using twenty-five nutrients (vitamins A/B6/B12/C/D/E, β-carotene, Fe, Mg, Zn, Se, caffeine, alcohol, protein, carbohydrates, cholesterol, fibre, folic acid, niacin, total fat, riboflavin, saturated fat, monounsaturated fat, polyunsaturated fat and thiamine) available from the interview data. Then, after controlling for the effect of total energy intake and transforming DII according to previous methods, the individual’s E-DII was eventually calculated. The more detailed calculation method could be found in online Supplementary A. Participants with an E-DII < 0 were classified as following anti-inflammatory diets and those with an E-DII ≥ 0 as following pro-inflammatory diets(Reference Wang, Sun and Wang17). Although examining dietary patterns may yield stronger associations with disease outcomes than individual nutrients(Reference Hu18), we recognise that dichotomising E-DII data can lead to information loss. Therefore, to ensure a more comprehensive analysis, E-DII was also utilised as a continuous variable (see online Supplementary B), with low to high scores indicating minimal to substantial dietary inflammatory potential.
Depressive symptoms
Depressive symptoms were measured using the nine-item Patient Health Questionnaire-9 (PHQ-9). This questionnaire aims to assess how often respondents experienced depressive symptoms in the past 2 weeks. Each question is rated on a scale of 0 (‘not at all’) to 3 (‘almost every day’), resulting in a total score ranging from 0 to 27 for each individual. Higher scores mean more severe depressive symptoms. To assess the internal consistency, we conducted a reliability analysis on all PHQ-9 items, yielding a Cronbach’s α coefficient of 0·843 and confirming excellent scale reliability. Additionally, our study set the PHQ-9 cut-off at 10, as this threshold ensures both high sensitivity and specificity while maintaining clinical utility(Reference Kroenke, Spitzer and Williams19).
Covariates
Based on previous studies and the available variables in NHANES that may be associated with both obesity and depression, the following information was included as covariates in this study(Reference Yin, Gong and Zhang14,Reference Wang, Sun and Wang17,Reference Eke, Dye and Wei20) . (1) Basic personal information: age (≤ 39, 40–59, ≥ 60), sex, race (Mexican American, other Hispanic, Non-Hispanic white, Non-Hispanic black, other race), education level (less than high school, high school and above high school), marriage status (married, never married, other state) and income:poverty ratio (≤ 130 %, > 130 to ≤ 350 %, > 350 %). (2) Self-reported health conditions were based on the physician’s diagnoses, including hypertension, high cholesterol, sleep disorder and diabetes. (3) Smoking status was categorised as ‘never’ (< 100 cigarettes in a lifetime), ‘former’ (≥ 100 cigarettes in a lifetime but no longer smoking) and ‘current’ (≥ 100 cigarettes in a lifetime and now still smoking)(Reference Eke, Dye and Wei20). (4) Drinking status was also categorised as ‘never’ (2007–2016: fewer than twelve drinks in lifetime; 2017–2018: not had a drink of any kind of alcohol), ‘former’ (2007–2016: had twelve drinks in lifetime but had not drunk in the past year; 2017–2018: had a drink of any kind of alcohol in lifetime but had not drunk in the past year) and ‘current’ (2007–2016: had twelve drinks in lifetime and had at least one drink in the past year; 2017–2018: had a drink of any kind of alcohol in lifetime and had drunk at least 1–2 times in the past year)(Reference Cepeda, Kern and Blacketer21).
Statistical analysis
After excluding all cases with missing values (see Figure 1), we performed multicollinearity tests using the variance inflation factor to ensure robust parameter estimation for the included variables. To further account for the multistage complex sampling design of NHANES, all subsequent statistical procedures utilised complex weighted analyses.
In the main analysis, the baseline characteristics of the participants were described as weighted means (standard deviation) for continuous variables and weighted percentages of categorical variables. Then, based on depressive symptom severity (PHQ-9 < 10 or ≥ 10), participants were divided into two groups for baseline characteristics, and weighted χ 2 tests were used to compare baseline characteristics. To explore the potential underlying pathways, we performed a statistical decomposition of the association between obesity and depressive symptoms using unweighted and weighted multivariable regression. We also calculated all participants’ mediation analyses via unweighted and weighted hierarchical multiple regression. These analyses were conducted to estimate the proportion of the total association explained by dietary inflammation, with obesity entered as the predictor, E-DII as the statistical mediator and depressive symptoms as the outcome. It is important to note that, given the cross-sectional design of our study, the mediation model should be interpreted as a statistical decomposition of the observed associations. This approach aims to identify the interrelatedness of the variables within a structural framework, rather than to confirm causality.
Furthermore, to test the robustness of our results, we conducted two sensitivity analyses: (1) incorporating obesity and inflammatory dietary habits as continuous variables (BMI and E-DII) into the analysis and (2) excluding underweight individuals (BMI < 18·5) and then repeating the main analysis steps. All statistical analyses were performed using the ‘survey’ and ‘car’ packages of R (version 4.3.1), and forest plots were generated using the CNSknowall platform (https://cnsknowall.com). A two-sided P < 0·05 was considered statistically significant.
Results
Baseline characteristics
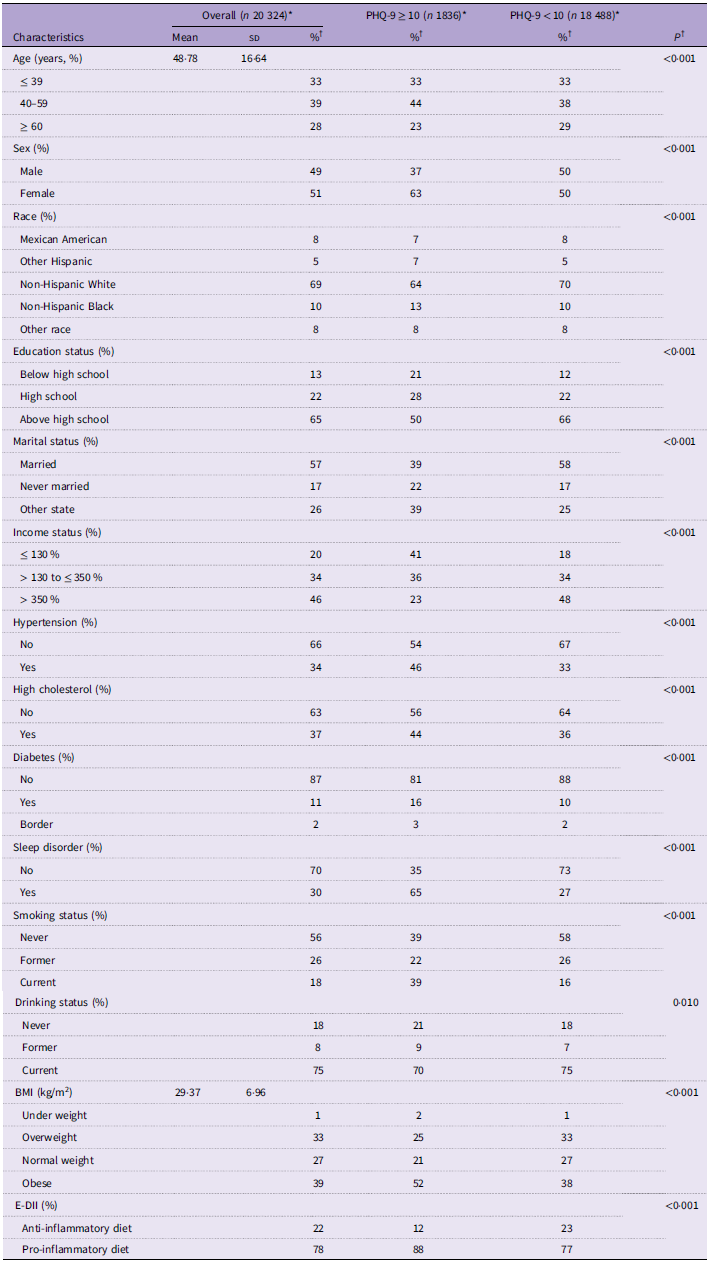
Table 1 summarises the descriptive statistics of the general characteristics of the study population and the results of the weighted χ 2 test stratified by depressive symptom status. Among the continuous variables, the mean age of participants was 48·78 (sd 16·64) years, and the mean BMI of participants was 29·37 (sd 6·96). Compared with the non-depressed (PHQ-9 < 10) participants, depressed (PHQ-9 ≥ 10) participants tended to have a higher proportion of obesity (52 % v. 38 %) and were more likely to follow a pro-inflammatory diet (88 % v. 77 %). Demographically, the depressed group was characterised by a higher proportion of females (63 % v. 50 %) and current smokers (39 % v. 16 %). Clinical co-morbidities were also markedly more prevalent among depressed individuals, particularly sleep disorders (65 % v. 27 %) and hypertension (46 % v. 33 %). Significant socio-economic inequalities were evident; 41 % of the depressed group fell into the lowest income bracket (≤ 130 % poverty ratio), whereas only 18 % of the non-depressed group were in the same category. Besides, race, education status, marital status, high cholesterol, diabetes and drinking status showed distinct distributions between groups with different levels of depressive symptoms (all P < 0·01).
Characteristics of participants with varying degrees of depressive symptoms (PHQ-9) (n (%))

Table 1 Long description
A table comparing characteristics of participants with varying degrees of depressive symptoms. The table has 19 rows and 10 columns. The columns are labeled as Characteristics, Overall (n 324), Mean, sd, PHQ-9 10 (n 1896), and PHQ-9 < 10 (n 1848). The rows are labeled with various characteristics such as Age (years, %), Sex (%), Race (%), Education status (%), Marital status (%), Income status (%), Hypertension (%), High cholesterol (%), Diabetes (%), Sleep disorder (%), Smoking status (%), Drinking status (%), and BMI (kg/m^2). Each row provides percentages for the overall group and the two subgroups based on their PHQ-9 scores. Notable trends include higher proportions of females, current smokers, and individuals with sleep disorders and hypertension among the depressed group. Significant socio-economic inequalities are also evident, with a higher proportion of the depressed group falling into the lowest income bracket.
Column percentages may not equal 100 % due to rounding and all categorical variable P-values based on χ 2 tests.
PHQ-9, nine-item Patient Health Questionnaire-9; E-DII, Energy-adjusted Dietary Inflammatory Index.
*Unweighted data: included the overall participants and the number of participants with PHQ-9 ≥ 10 and PHQ-9 < 10.
†Weighted data: included percentages and P-values based on χ 2 tests.
Multicollinearity assessment
We calculated variance inflation factors to evaluate potential multicollinearity between independent variables and covariates within the regression models. The results demonstrated that VIF values for all variables ranged from 1·00 to 4·00, which are below the established threshold of 5 for moderate multicollinearity(Reference O’brien22), thereby indicating that our models were free from significant multicollinearity issues.
Association between obesity, Energy-adjusted Dietary Inflammatory Index and depressive symptoms
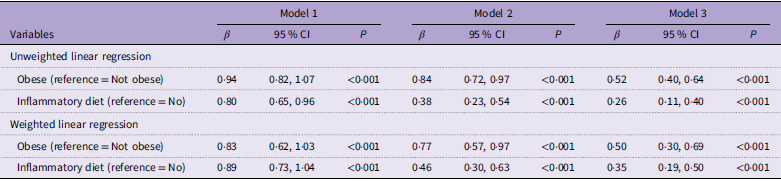
Table 2 displays the positive association between obesity, a pro-inflammatory diet and depressive symptoms across both unweighted and weighted analyses. In the crude weighted model (model 1), both obesity and a pro-inflammatory diet were significantly associated with increased PHQ-9 scores compared with reference group (non-obese individuals and those following an anti-inflammatory diet) (β obese = 0·83, 95 % CI 0·62, 1·03; β pro-inflammatory diet = 0·89, 95 % CI 0·73, 1·04 and all P < 0·001). In the fully adjusted weighted model (model 3), these associations remained statistically significant, though the magnitude of the effect was attenuated. Individuals with obesity and on a pro-inflammatory diet exhibited higher depressive symptom scores. Specifically, obesity was associated with a 0·50-unit increase in the PHQ-9 score (95 % CI 0·30, 0·69, P < 0·001), while a pro-inflammatory diet was associated with a 0·35-unit increase (95 % CI 0·19, 0·50, P < 0·001). Although these effect sizes may appear modest on the 27-point PHQ-9 scale, they reflect a consistent and independent contribution of metabolic and dietary factors to the overall symptom burden.
Linear regression model for obesity and inflammatory diet on depressive symptoms (PHQ-9)

Table 2 Long description
The table presents the results of linear regression models analyzing the association between obesity, a pro-inflammatory diet, and depressive symptoms (PHQ-9). It includes three models: unweighted linear regression, weighted linear regression, and fully adjusted weighted model. The table has 6 rows and 9 columns. Column headers are Variables, Model 1 Beta, Model 1 95% CI, Model 1 P, Model 2 Beta, Model 2 95% CI, Model 2 P, Model 3 Beta, Model 3 95% CI, Model 3 P. Row labels are Obese (reference = Not obese) and Inflammatory diet (reference = No). Row 1: Obese (reference = Not obese), 0.94, 0.82-1.07, <0.001, 0.84, 0.72-0.97, <0.001, 0.52, 0.40-0.64, <0.001. Row 2: Inflammatory diet (reference = No), 0.80, 0.65-0.96, <0.001, 0.38, 0.23-0.54, <0.001, 0.26, 0.11-0.40, <0.001. Row 3: Obese (reference = Not obese), 0.83, 0.62-1.03, <0.001, 0.77, 0.57-0.97, <0.001, 0.50, 0.30-0.69, <0.001. Row 4: Inflammatory diet (reference = No), 0.89, 0.73-1.04, <0.001, 0.46, 0.30-0.63, <0.001, 0.35, 0.19-0.50, <0.001. The table shows that both obesity and a pro-inflammatory diet are significantly associated with increased PHQ-9 scores in all models, with the magnitude of the effect being attenuated in the fully adjusted weighted model.
Model 1 = Obese + inflammatory diet.
Model 2 = Model 1 + age + sex + race + education status + marital status + income status.
Model 3 = Model 2 + hypertension + high cholesterol + diabetes + sleep disorder + smoking status + drinking status.
Subgroup analysis
The subgroup analysis in Figure 2 revealed a significant association between obesity, pro-inflammatory diets and increased depressive symptoms across various demographic groups. Given the extensive nature of these subgroup evaluations, these analyses were exploratory. To minimise the risk of type I errors associated with multiple testing, we prioritised the results of formal interaction tests to identify genuine effect modification rather than relying solely on individual subgroup P-values.
The forest plot of the association between obesity and inflammatory diet on depressive symptoms (PHQ-9) stratified by participant characteristics. #The merged variables: Race: included non-Hispanic White and Other race. The categories of Mexican American, other Hispanic, non-Hispanic Black and the original other race have been consolidated into ‘Other race’; Diabetes: included No and Yes, we merged ‘No’ with ‘Border’. Note: The above results were weighted results and adjusted other covariates. Due to the special requirements of the weighting algorithm, which led to the merging of Race and Diabetes. *P < 0·05, **P < 0·01, ***P < 0·001.

In the analysis of the association between obesity and depressive symptoms, the sex and the diabetes subgroup exhibited different patterns and/or degrees of association (P for interaction < 0·05). In the sex subgroup, there was a significant positive association between obesity and depressive symptoms among females, while this association was not significant among males (β Female = 0·95 v. β Male = −0·01; P Female < 0·001 v. P Male = 0·937). In the diabetes subgroup, the degree of this association was significantly higher among patients with diabetes compared with those without diabetes (β Yes = 1·18 v. β No/Border = −0·01; both P < 0·001).
Similarly, in the analysis of the association between inflammatory diet and depressive symptoms, the subpopulations within the age, high cholesterol, sleep disorder and smoking status subgroups exhibited different patterns and/or degrees of association (P for interaction < 0·05). In the age subgroup, only the 40–59 years group showed a significant association between pro-inflammatory dietary habits and higher depression scores (β 40–59 = 0·54 v. β ≤ 39 = 0·19 and β ≥ 60 = 0·16; P 40–59 < 0·001 v. P ≤ 39 = 0·21 and P ≥ 60 = 0·327). In the high cholesterol and sleep disorder subgroups, patients’ pro-inflammatory dietary habits were associated with more severe depressive symptoms, whereas this association was not observed in the non-patient groups (high cholesterol: β Yes = 0·54 v. β No = 0·21; P Yes < 0·001 v. P No = 0·05; sleep disorder: β Yes = 0·91 v. β No = 0·13; P Yes < 0·001 v. P No = 0·103). In the smoking status subgroup, this association was significantly stronger among current smokers compared with former smokers and non-smokers (β Current = 0·92 v. β Never = 0·23 and β Former = 0·37; P Current < 0·001 v. P Never = 0·018 and P Former = 0·074).
Testing for mediation effect between obesity, Energy-adjusted Dietary Inflammatory Index and depressive symptoms
As shown in Figure 3, the mediation analysis (both the unweighted and weighted analyses) revealed that a direct association between obesity and depressive symptoms was significant (total effect, c: P < 0·001). The relationship between obesity and E-DII (path a: P < 0·001) and the association between E-DII and depressive symptoms (path b: P < 0·01) were also significant. Additionally, the relationship between obesity and depressive symptoms was significant after including E-DII in the model (direct effect, c’: P < 0·001). Consequently, in the weighted analysis adjusting for all covariates, E-DII was found to account for approximately 4 % of the total association between obesity and depressive symptoms.
Mediation model with obesity as the predictor, E-DII as the mediating variable and depressive symptoms (PHQ-9) as the outcome. PHQ-9, nine-item Patient Health Questionnaire-9; E-DII, Energy-adjusted Dietary Inflammatory Index. †Results of unweighted mediation analysis. ‡The results of weighted mediation analysis. Note: *P < 0·05, **P < 0·01, ***P < 0·001.

Supplemental results
Considering that categorical data may not capture all relevant information, we treated BMI, E-DII and depressive symptoms as continuous variables in the appendix. Weighted linear regression models yielded similar conclusions to the main analysis (online Supplementary Table B1 and Fig. B1). We also conducted a sensitivity analysis excluding underweight individuals (n 20 059), which produced results consistent with those from the total sample (online Supplementary Tables B2–B3 and Fig. B2).
Discussion
General findings
In this study, we observed a robust association between obesity, E-DII and depressive symptoms. We found that both obesity and a pro-inflammatory diet were identified as significant factors associated with more severe depressive symptoms. However, the strength of these associations varied across different populations. We also statistically confirmed that the association between obesity and depressive symptoms was partially mediated by E-DII. Additionally, the supplemental analyses further confirmed that obesity and pro-inflammatory eating patterns correlate with depression, with E-DII acting as a statistical mediator between the two, which enhances the robustness of the present findings.
The association between obesity and depressive symptoms
We identified a positive association between obesity and depressive symptoms. A systematic review and meta-analysis have shown that obesity is prospectively associated with depression in 80 % of reviewed studies(Reference Faith, Butryn and Wadden23). Consistent with our findings, several recent population-based studies have demonstrated that different obesity phenotypes, severity and the experience of increasing BMI over the life span(Reference Gallagher, Pirkis and Lambert24) are predictors of depression.
It is well established that obesity is associated with systemic inflammation and metabolic disturbances that lead to important physical alterations in vulnerable populations. For example, obesity is linked to the dysregulation and long-term hyperactivation of the hypothalamic–pituitary–adrenal axis, which may relate to inflammation and psychological conditions(Reference Hryhorczuk, Sharma and Fulton25). Furthermore, adipose tissue is a potential source of pro-inflammatory mediator production(Reference Osborn and Olefsky26) and may trigger peripheral immune activation. Such processes are theorised to relate to central inflammation, potentially impacting established depression pathophysiological processes(Reference Capuron and Miller27).
The association between Energy-adjusted Dietary Inflammatory Index and depressive symptoms
The present study’s identification of a positive association between E-DII and depressive symptoms is consistent with reports that adults adhering to healthy dietary patterns have a lower risk of experiencing depressive symptoms(Reference Nicolaou, Colpo and Vermeulen28). Proposed biological mechanisms suggest that pro-inflammatory diets increase the circulating levels of inflammatory cytokines(Reference Li, Zhan and Huang12), which may potentially impact the brain’s central nervous system as they cross the blood-brain barrier(Reference Postal and Appenzeller29). This chronic immune activation often leads to the overproduction of reactive oxygen species and oxidative stress, impairing neuronal function and disrupting neurochemistry(Reference Barbosa, De Meneses and De Aguiar30).
Furthermore, the gut–brain axis serves as a hypothesised critical mediator in this relationship. Unhealthy dietary patterns correlate with gut microecological dysbiosis, which is associated with increased intestinal mucosal permeability and impairs barrier function. This ‘leaky gut’ may allow for the translocation of pro-inflammatory cytokines that are thought to affect emotional regulation and have been associated with anxiety- and depression-like behaviours in experimental animals(Reference Kelly, Borre and O’Brien31). Vice versa, anti-inflammatory diets are associated with improved intestinal barrier function and promote the secretion of anti-inflammatory metabolites, reducing the release of pro-inflammatory factors and subsequent metabolic diseases(Reference Ruiz-Saavedra, Salazar and Suárez32).
Association differences by demographic subgroups
Subgroup analyses revealed significant variations in the observed associations across demographic and clinical strata. The obesity–depression link was significant only in female participants, potentially due to sex-specific weight stigmatisation(Reference Heo, Pietrobelli and Fontaine33), hormonal fluctuations and established sex-based disparities in psychological vulnerability(Reference Ahuja, Sathiyaseelan and Wani34). Regarding age, pro-inflammatory diets were strongly associated with depressive symptoms in adults aged 40–59, aligning with research linking middle-age dietary patterns to mood disorders(Reference Akbaraly, Brunner and Ferrie35,Reference Shivappa, Schoenaker and Hebert36) , despite global inconsistencies in age-group definitions(Reference Li, Zhan and Huang37). So further research is needed for individuals from different age groups. Additionally, chronic co-morbidities and lifestyle factors modulated these relationships. For instance, diabetes-related metabolic disturbances are frequently associated with increased depressive symptom severity(Reference De La Cruz-Cano, Tovilla-Zarate and Reyes-Ramos38). Similarly, high cholesterol (typically associated with high-fat, pro-inflammatory diets) correlates with depression-like behaviours in experimental models(Reference Zou, Tian and Wang39). Finally, given the potential inflammatory underpinnings of sleep disorders, pro-inflammatory diets may compound psychological distress, and research has indicated that greater adherence to anti-inflammatory diets is associated with improved sleep quality(Reference Farrell, Hébert and Heflin40).
Partial mediation effect between obesity, Energy-adjusted Dietary Inflammatory Index and depressive symptoms
We statistically demonstrated that obesity was positively associated with depressive symptoms, and E-DII mediated this relationship (i.e. obesity → E-DII → depressive symptoms). However, it is noteworthy that E-DII only partially mediated this association, accounting for approximately 4 % of the total effect. This partial mediation suggests that while dietary-induced inflammation is a statistically significant pathway, it represents only one component of the multifaceted link between obesity and depression. That is, beyond inflammation, the link may be influenced by psychosocial factors including weight stigma and low self-esteem, alongside unhealthy lifestyles(Reference Minkwitz, Scheipl and Cartwright6,Reference van Gool, Kempen and Bosma41) . Additionally, physiological mechanisms including neurotransmitter dysregulation and genetic factors operate independently of dietary inflammatory potential(Reference Patsalos, Keeler and Schmidt5).
Moreover, the analysis of the model’s total effect (i.e. obesity → depressive symptoms) and the second half path of mediation (i.e. E-DII → depressive symptoms) has already been elaborated above. Herein, we will focus on explaining the statistical path between obesity and E-DII. The results reflected that individuals with obesity tend to have higher E-DII scores, which has been widely accepted in previous meta-analyses(Reference Oliveira, Bressan and Pimenta42,Reference Hariharan, Odjidja and Scott43) . Mechanistically, obesity-related hypothalamic–pituitary–adrenal axis hyperactivation is thought to expose individuals to chronic stress, potentially increasing appetite for energy-dense food(Reference Milaneschi, Simmons and Van Rossum4). On the other hand, food high in fat and sugar will activate nutrient sensors in the gut (signalling the reward and learning systems) and further enhance the cravings and preferences of such foods(Reference Berthoud, Morrison and Ackroff44). The food types mentioned above undoubtedly have significant inflammatory potential. Besides, it may also be related to the unhealthy lifestyle maintained by individuals with obesity(Reference Singh45). Ultimately, our study validates that while dietary inflammation is a modifiable and critical link in the obesity–depression co-morbidity, it must be addressed as part of a broader, comprehensive care plan.
Research implications and strengths
By utilising a large, representative NHANES sample and robust weighted analyses, this study provides high-quality evidence for the mediating role of dietary inflammation in the obesity–depression link. By identifying vulnerable subgroups through interaction testing, the findings offer a nuanced understanding of population heterogeneity and highlight E-DII as a significant modifiable pathway. Consequently, for individuals experiencing these co-morbid disorders, while adopting an anti-inflammatory diet represents a beneficial strategy, clinical interventions must also integrate metabolic weight management, physical activity programmes and psychological support to address the stigma–depression cycle. Implementing such tailored, multimodal strategies may provide critical insights into mitigating depressive symptoms, thereby reducing the incidence of future depressive episodes.
Limitations
First, given that the data are derived from the US-specific NHANES database, the generalisability of results to populations with diverse food cultures is limited(Reference Shin, Shivappa and Hébert16), and future research should verify the consistency of the observed results using multicultural databases. Second, the cross-sectional design precludes definitive causal inferences; although a specific mediation pathway was postulated, reverse causality cannot be ruled out, necessitating longitudinal or experimental studies to clarify temporal relationships. Third, adjusting for all covariates might have caused over-adjustment if certain variables lie on the causal pathway, potentially underestimating the effects despite their continued statistical significance. Fourth, residual confounding remains despite extensive adjustments, since factors such as antidepressant use and psychosocial stressors were not fully included. Additionally, dietary data collected through two 24-h recalls are prone to measurement error and recall bias(Reference Zhao, Sun and Liu3), and more robust methods like food diaries or real-time objective assessments should be adopted in future studies. Finally, the extensive subgroup analyses were exploratory in nature, and multiple testing increases the risk of type I errors, meaning these findings require cautious interpretation pending validation by independent studies.
Conclusions
The present study indicates that both obesity and the potential for dietary inflammation are significantly associated with depressive symptoms, with these associations varying among various population subgroups. We also statistically identified that E-DII acts as a mediator of the association between obesity and depressive symptoms. While these findings suggest the hypothesis that targeting food categories with a lower DII might serve as a potential strategy for supporting mental health, the inherent limitations of cross-sectional studies in establishing causal inference necessitate further longitudinal or interventional studies before these insights can be translated into evidence-based clinical recommendations. Our results provide referential information for future research to evaluate the efficacy of such dietary modifications in individuals living with, or at risk of, depression and obesity.
Supplementary material
For supplementary material/s referred to in this article, please visit https://doi.org/10.1017/S0007114526106771.
Acknowledgements
We thank all participants who volunteered as part of the NHANES.
This work was sponsored by the Chongqing Social Science Fund (2023NDQN40) and the National Natural Science Foundation of China (32300926). The funding agents had no role in the design and conduct of the study: collection, management, analysis and interpretation of the data and preparation, review or approval of the manuscript.
R. W. and B. C. conceived and designed the study; R. W. and Y. X. performed the statistical analysis; K. M. T. and R. S. M. contributed to the discussion; all authors have read and approved the final version of this article.
Dr Roger S. McIntyre has received research grant support from CIHR/GACD/National Natural Science Foundation of China and the Milken Institute; speaker/consultation fees from Lundbeck, Janssen, Alkermes, Neumora Therapeutics, Boehringer Ingelheim, Sage, Biogen, Mitsubishi Tanabe, Purdue, Pfizer, Otsuka, Takeda, Neurocrine, Neurawell, Sunovion, Bausch Health, Axsome, Novo Nordisk, Kris, Sanofi, Eisai, Intra-Cellular, NewBridge Pharmaceuticals, Viatris, AbbVie and Atai Life Sciences. Dr S. Roger McIntyre is a CEO of Braxia Scientific Corp.
The datasets, code book and analytic code supporting the conclusions of this article are available in the publicly and freely available without restriction at the NHANES website (unique persistent identifier and hyperlink to datasets in https://www.cdc.gov/nchs/nhanes).