
Introduction
Al–Cu–Mg alloys have been widely used in aerospace applications due to their combination of low density, excellent mechanical properties, corrosion resistance, and formability [Reference Tolga and Costas1, Reference Wu, Liu, Hu, Li, Bai, Xia, Wang and Ye2, Reference Wang, Wu, Sun, Qin and Tian3, Reference Song, Ding, Xiao, Zhao, Cai, Guo, Li and Zheng4, Reference Wada, Mabuchi, Higashi and Langdon5]. However, Al alloys exhibit relatively low dimensional stability due to their high coefficient of thermal expansion (CTE) and low micro-yield strength (MYS) [Reference Wang, Wu, Sun, Qin and Tian3]. Therefore, the application of Al alloys in instruments used in extreme environments would lead to unpredictable measurement errors, severe stress concentrations in structural components, and even premature failure [Reference Song, Ding, Xiao, Zhao, Cai, Guo, Li and Zheng4]. Thus, their poor dimensional stability has limited the use of Al–Cu–Mg alloys in inertial instruments such as space mirrors, lens mounts, gyroscopes and accelerometers.
In recent years, the study of the dimensional stability of Al–Cu–Mg alloys has attracted much attention [Reference Dong, Shao, Jiang, Chao and Zhen6, Reference Song, Ding, Zhao, Xiao and Guo7, Reference Qu, Lou, Li, Kuang and Lou8, Reference Cui, Wang and Ren9]. For the operational conditions of inertial instruments, MYS, thermal strain (residual thermal strain [Reference Dong, Shao, Jiang, Chao and Zhen6], elastic strain [Reference Song, Ding, Zhao, Xiao and Guo7], hysteresis strain [Reference Qu, Lou, Li, Kuang and Lou8]), and CTE [Reference Cui, Wang and Ren9] were used to evaluate the dimensional stability of the materials after applied stress or thermal cycles. As an important indicator for characterizing the resistance to micro-yield deformation, the MYS is defined as the stress corresponding to a residual strain of 1 × 10⁻⁶ [Reference Song, Ding, Xiao, Zhao, Cai, Guo, Li and Zheng4]. Since the motion of fewer dislocations can lead to a residual strain of 1 × 10⁻⁶, MYS is sensitive to the microstructure [Reference Zhang, Sun, Li and Zhang10]. Hence, MYS may exhibit a different relationship with microstructure parameters from that of macro-yield strength [Reference Liu, Li, Peng and Jun11]. Song et al. [Reference Song, Ding, Xiao, Zhao, Cai, Guo, Li and Zheng4] found that the two-stage aging treatment increases the MYS and decreases the thermal strain by forming evenly distributed precipitates. The stress-aging treatment not only formed uniformly distributed precipitates but also reduced the residual stress, resulting in an increase in the MYS and a reduction in the thermal strain that effectively improved the dimensional stability of the Al–Cu–Mg alloy [Reference Dong, Shao, Jiang, Chao and Zhen6]. Wang et al. [Reference Wang, Wu, Wang, Jiang, Wu and Jiang12] demonstrated that the thermal-cooling cycle treatment improved the dimensional stability of the 2A12 Al alloy by decreasing the residual stress and promoting formation of the precipitates. Zhang et al. found that both the micro-yield and the macro-yield strengths of the SiCp/2024 Al composites and 2024 Al alloy depended strongly on the precipitates formed during the aging treatment [Reference Zhang, Sun, Li and Zhang10]. The addition of SiCp induced residual stresses in the materials during cooling, resulting in a decrease in MYS. The SiCp restricted the thermal expansion of α-Al matrix and decreased the CTE of the material [Reference Huber, Degischer, Lefranc and Schmitt13], improving the dimensional stability [Reference Lotfy, Pozdniakov, Zolotorevskiy, El-khair, Daoud and Mochugovskiy14]. However, severe thermal mismatches and microcracks can arise due to their high CTE difference, leading to poor performance [Reference El-Gallab and Sklad15]. Stadler et al. reported that the formation of primary intermetallic phases, such as Al3CuNi and Al7Cu4Ni, reduced the CTE of an Al alloy [Reference Stadler, Antrekowitsch, Fragner, Kaufmann, Pinatel and Uggowitzer16]. Therefore, control of the primary intermetallic phases, residual stress and precipitates is vital for reducing the CTE and increasing the MYS, thereby improving the dimensional stability of Al–Cu–Mg alloys.
Compared to the metastable precipitates such as θ′ or s′ in the Al–Cu–Mg alloy, the Al2CuLi precipitates (T1) in Al–Cu–Li alloys exhibit a remarkable precipitation strengthening effect [Reference Chen, Zhao and Fan17] and better thermal stability [Reference Deschamps, Garcia, Chevy, Davo and De Geuser18], which would lead to good thermal dimensional stability and high strength of the alloy [Reference Yang, Zhi, Wang, Zhang, Liu, Wang and Cao19]. However, although much effort has been devoted to the study of the microstructure and mechanical properties of Al–Cu–Li alloys [Reference Chen, Zhao and Fan17, Reference Deschamps, Garcia, Chevy, Davo and De Geuser18, Reference Yang, Zhi, Wang, Zhang, Liu, Wang and Cao19, Reference Langan and Pickens20, Reference Montoya, Heubaum, Kumar and Pickens21, Reference Gao, Xu, Teng and Lu22], investigations of the effects of Li content on the dimensional stability of the alloy have been scarce. Limited studies have demonstrated that Li content has a complex effect on the dimensional stability of Al–Cu–Li alloys. With increasing Li content, the predominant T1 precipitate in the Al–Cu–Li alloy was partly replaced by the δ′ phase, resulting in a decrease in the yield strength of the alloy [Reference Langan and Pickens20]. In addition, the δ′ precipitates formed in the alloys with high Li content (greater than 1.5 wt%) were easily dissolved in the α-Al matrix at moderate temperatures (above 220 °C) [Reference Deschamps, Garcia, Chevy, Davo and De Geuser18], which led to a decrease in thermal stability. However, according to the modified Al–Cu–Li phase diagram, the amount of primary T1 phases was found to increase with increasing Li content in the alloy [Reference Montoya, Heubaum, Kumar and Pickens21]. This may affect the dimensional stability of Al–Cu–Mg–Li–Sc–Ag alloys but has been rarely reported. Focusing on the issues discussed above, this work seeks to identify the mechanisms of the effect of Li content on the dimensional stability of Al–Cu–Mg–Li–Sc–Ag alloys based on the relationships among the MYS, CTE and microstructure.
Results and discussion
Characterization of intermetallic phases
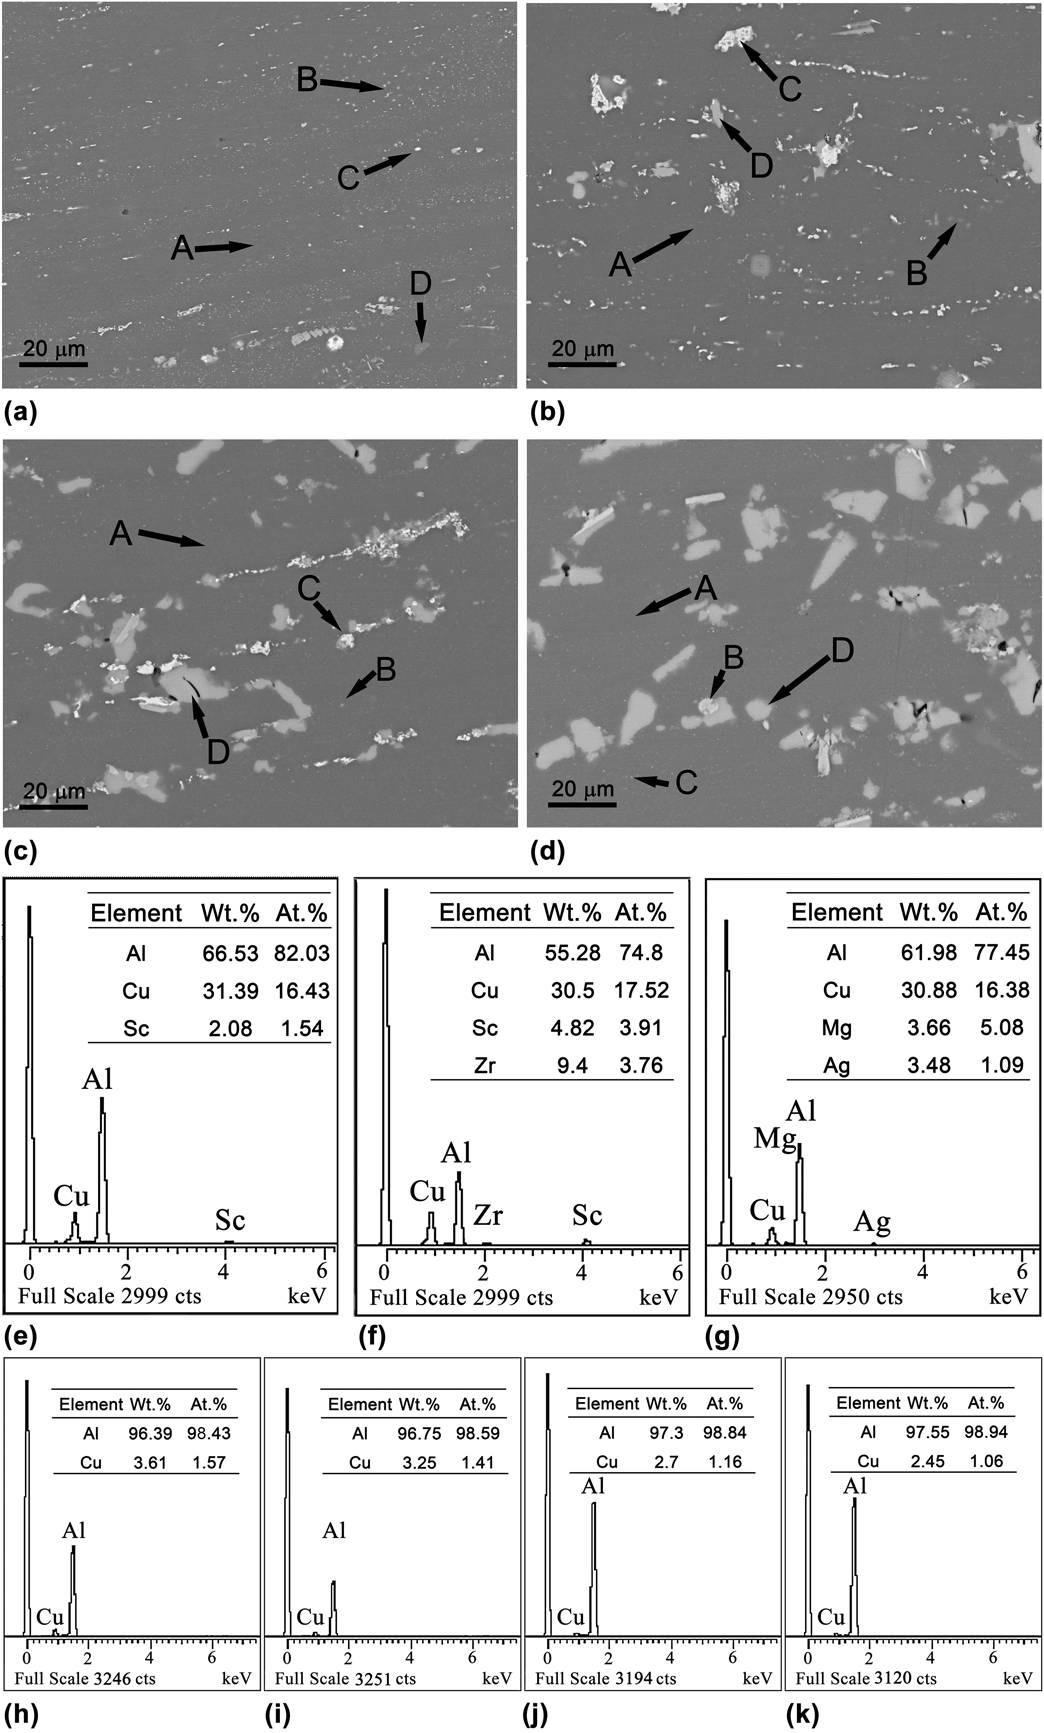
Figure 1 presents the scanning electron microscopy (SEM) image of the microstructure of the as-solution Al–Cu–Mg–Li–Sc–Ag alloys with various Li contents and the corresponding Energy dispersive X-ray spectroscopy (EDS) analysis results. Figure 1 show that three types of intermetallic phases were distributed in the α-Al matrix [labeled A in Figs. 1(a)–1(d)]: small θ-Al2Cu particles [labeled B in Fig. 1(a)], coarse bright AlCuScZr phases [labeled C in Fig. 1(b)], and coarse gray phases [labeled D in Figs. 1(c) and 1(d)]. The investigation of the Al–Cu–Sc phase diagram revealed there exist a ternary (Al8−xCu4+xSc) phase at the Al-corner, named the W-phase (Al8−xCu4+xSc) [Reference Bogno, Valloton, Henein, Ivey, Locock and Gallerneault23]. It is found that the Al–Cu particles containing 3.834 wt% Sc and 1.426 wt% Zr was identified as W phase in the Al–Cu–Li–Sc alloy [Reference Jia, Zheng and Gong24]. In addition, Zr added to the Al–Cu–Mg–Ag–Sc alloy tends to segregate slowly within the W-phase [Reference Gazizov, Teleshov, Zakharov and Kaibyshev25]. In present alloy with higher Zr content, more Zr atoms tends to slowly segregate in the W phase and replace the position of Sc atoms, similar to the formation of Al3(Sc, Zr) particles [Reference Tolley, Radmilovic and Dahmen26]. Therefore, the AlCuScZr intermetallic phase could be identified as an Al8−xCu4+x(Sc, Zr) phase in present alloy. In addition, the coarse gray phase contained ∼30.88 wt% Cu and had an Al/Cu atomic ratio of ∼5.0, and its amount increased with increasing Li content in the alloys. According to the modified Al–Cu–Li phase diagram [Reference Nayan, Nair, Mittal and Sudhakaran27], the coarse gray phases could be inferred as primary T1 phases although Li could not be detected in the coarse gray phases due to the limitation of EDS.
SEM micrographs of the as-solution treated Al–Cu–Mg–Li–Sc–Ag alloys with various Li contents: (a) 1.0 wt%; (b) 1.5 wt%; (c) 2.0 wt%; (d) 2.5 wt%. (e)–(g) EDS analysis of phases indicated as B, C, and D; (h)–(k) EDS analysis of α-Al matrix indicated as A in A1, A2, A3, and A4 alloys.

Figure 1 shows that there are some differences in the amounts of the primary T1, Al8−xCu4+x(Sc, Zr) phase and θ phases in Al–Cu–Mg–Li–Sc–Ag alloys with various Li contents. As shown in Fig. 1(a), a high amount of fine θ phases are present in the A1 alloy with 1.0 wt% Li, indicating that the θ phase was the main intermetallic phase in the A1 alloy. With Li content increased to 1.5 wt% (i.e., the A2 alloy), the amount of the θ phase decreased while some Al8−xCu4+x(Sc, Zr) and T1 phases appeared, as observed from Fig. 1(b). With the further increase in the Li content to 2.0 wt% (i.e., the A3 alloy) and 2.5 wt% (i.e., the A4 alloy), the amount of primary T1 phases increased strongly, indicating that primary T1 phases become the main intermetallic phases of the A3 and A4 alloy, as observed from Figs. 1(c) and 1(d).
The differences in the main intermetallic phases in Al–Cu–Mg–Li–Sc–Ag alloys with various Li contents were closely related to the solid solubility of the alloying elements in the α-Al matrix. With increasing Li content to 2.5 wt% from 1.0 wt% in alloys, the Cu content in α-Al matrix decreased to 2.45 wt% from 3.61 wt%, as shown in Figs. 1(h)–1(k). The decrease in Cu content in α-Al matrix was due to the mutual influence of the solid solubility of Cu and Li in the α-Al matrix in the Al–Cu–Li alloy [Reference Li, Liu, Chen, Zhang and Zheng28]. The increase in Li content decreased the solubility of Cu in the α-Al matrix. Since the Cu content in present alloys (i.e., 4.4 wt%) was exceeded the Cu solubility in A1 (i.e., 3.61 wt%) and A2 alloys (i.e., 3.25 wt%), more Cu-containing intermetallic phases (i.e., the θ phase and Al8−x Cu4+x (Sc, Zr) phase) formed during solidification. As sufficient amounts of Li are added to the A3 (i.e., 2.0 wt%) and A4 (i.e., 2.5 wt%) alloys, the Cu solubility in A3 and A4 alloys decreased more serious. Greater amount of excess Cu atoms in A3 and A4 alloys formed the primary T1 phase rather than the Al8−x Cu4+x (Sc, Zr) and θ phases. Hence, increasing the Li content in the alloys from 1.0 to 2.5 wt% resulted in an increase in the amount of Cu-containing intermetallic phases and a decrease in Cu content in α-Al matrix in Al–Cu–Mg–Li–Sc–Ag alloys, as observed in Fig. 1.
Characterization of the precipitates
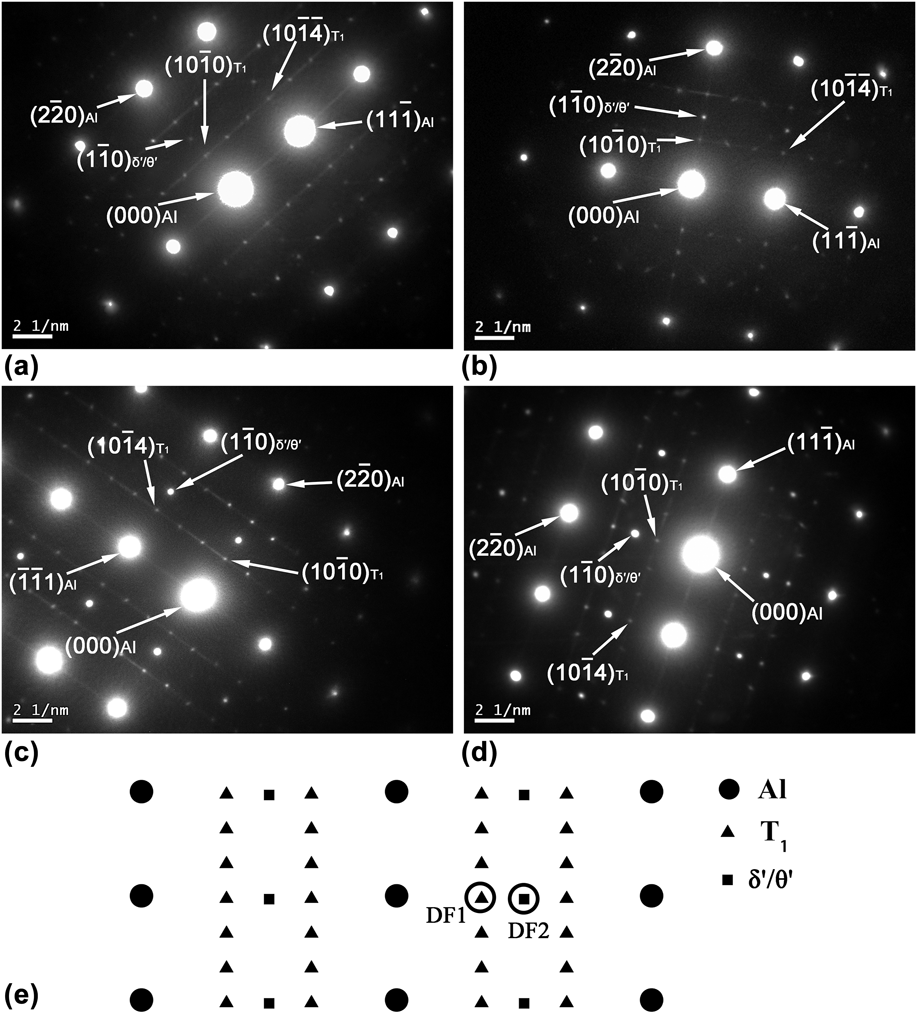
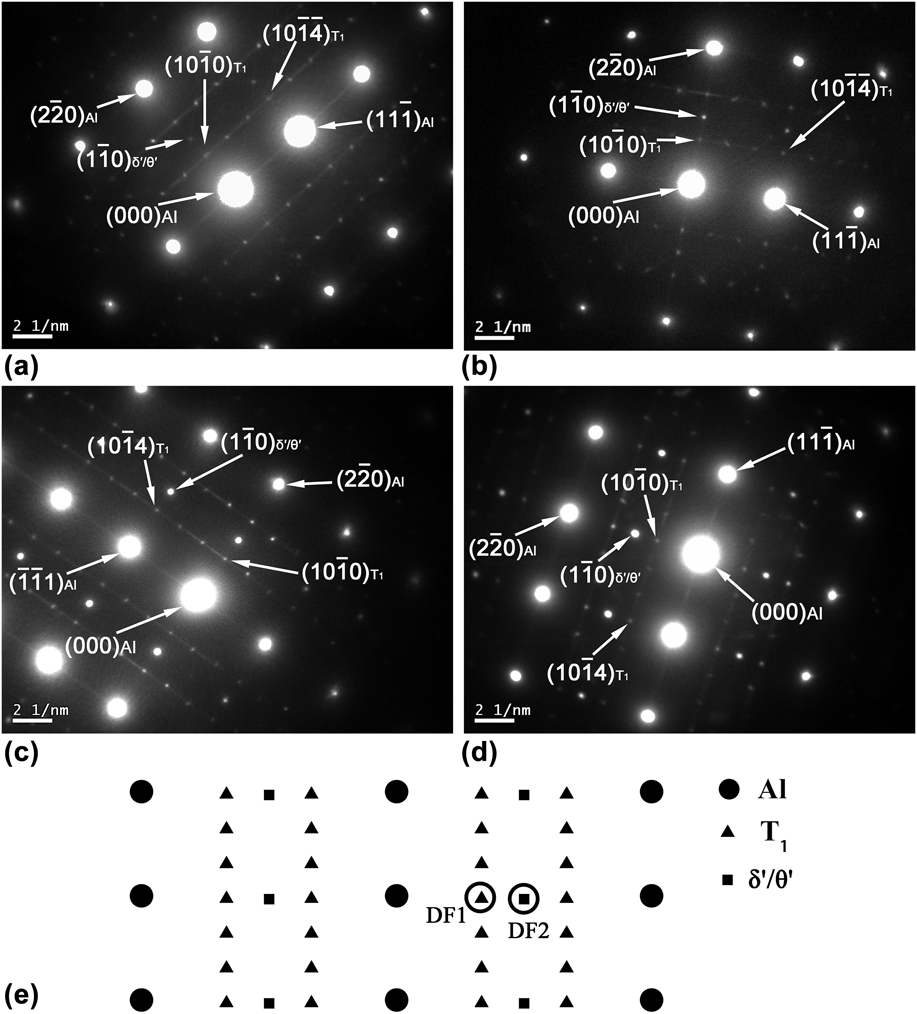
To identify the main precipitates in the four Al–Cu–Mg–Li–Sc–Ag alloys with different Li contents, the precipitates were analyzed with transmission electron microscopy (TEM) and the selected area electron diffraction (SAED) patterns, and the results are shown in Fig. 2. Based on the SAED patterns shown in Fig. 2(e), the main precipitates in the Al–Cu–Mg–Li–Sc–Ag alloys were T1 phases observed at the 1/3 and 2/3 g {220}Al positions and the θ′/δ′ phases observed at the 1/2 g {220}Al positions.
SAED patterns in the [112] zone axis of the α-Al matrix for Al–Cu–Mg–Li–Sc–Ag alloys with various Li contents: (a) 1.0 wt%; (b) 1.5 wt%; (c) 2.0 wt%; (d) 2.5 wt%; (e) Scheme of SAED patterns for the α-Al, δ′, T1, and θ′ phases.
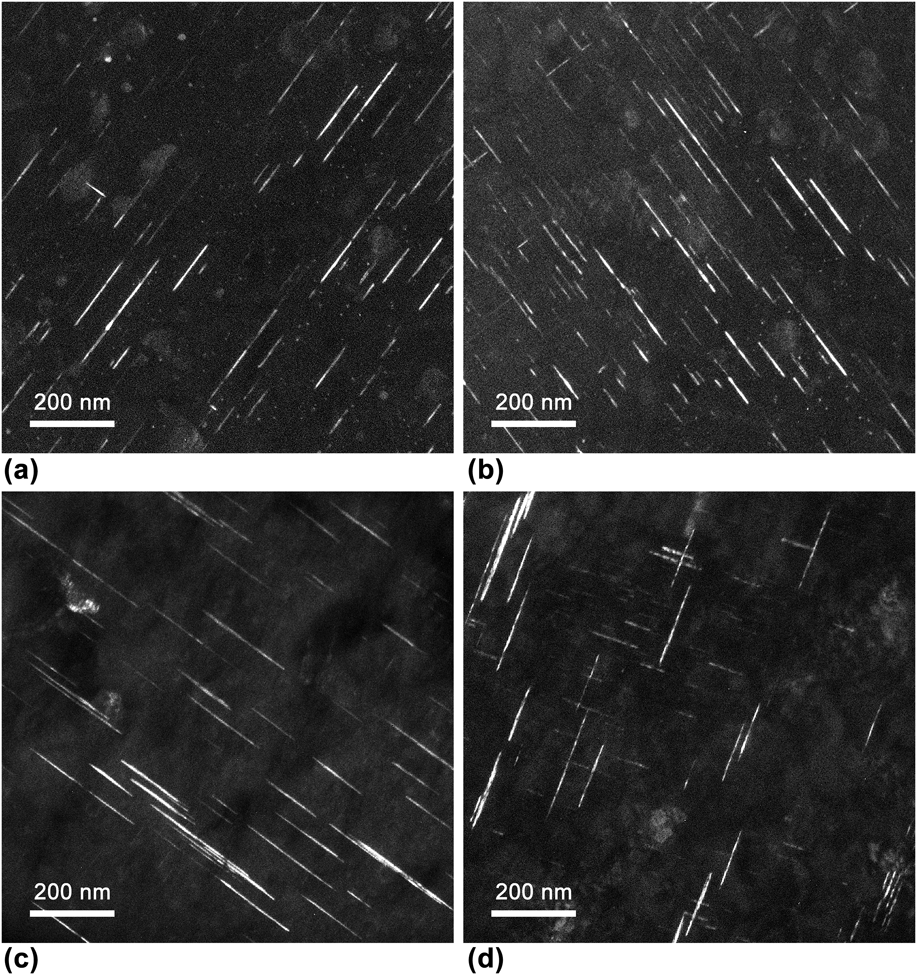
To demonstrate the differences among the T1 precipitates, the T1 precipitates in the four alloys were analyzed using the dark field images taken along the [112] zone axis with the aperture in the DF1 position described in Fig. 2(e), with the results shown in Fig. 3. It can be seen that the increase in the Li content had a significant effect on the amount of the T1 precipitates that form as hexagonal platelets on the {111}Al planes. When the Li content increased from 1.0 wt% (A1 alloy) to 1.5 wt% (A2 alloy), the amount of T1 precipitates increased and the distribution was more uniform due to the sufficient supply of Li atoms. This finding indicated that a sufficient amount of Li atoms favored the formation of T1 phases. However, when the Li content increased to above 1.5 wt% (2.0 wt% for the A3 alloy and 2.5 wt% for the A4 alloy), the amounts of T1 precipitates in the A3 and A4 alloys decreased. It seems that a high Li content suppressed the formation of T1 precipitates. Huang et al. observed a similar phenomenon and found that a decrease in the volume fraction of the T1 precipitates was due to the enhanced precipitation of the δ′ precipitates that compete with the T1 precipitates for Li atoms [Reference Huang and Zheng29].
Dark field transmission electron micrographs in the [112] zone axis with the aperture in the DF1 position described in Fig. 2(e) for the Al–Cu–Mg–Li–Sc–Ag alloys with various Li contents: (a) 1.0 wt%; (b) 1.5 wt%; (c) 2.0 wt%; (d) 2.5 wt%.

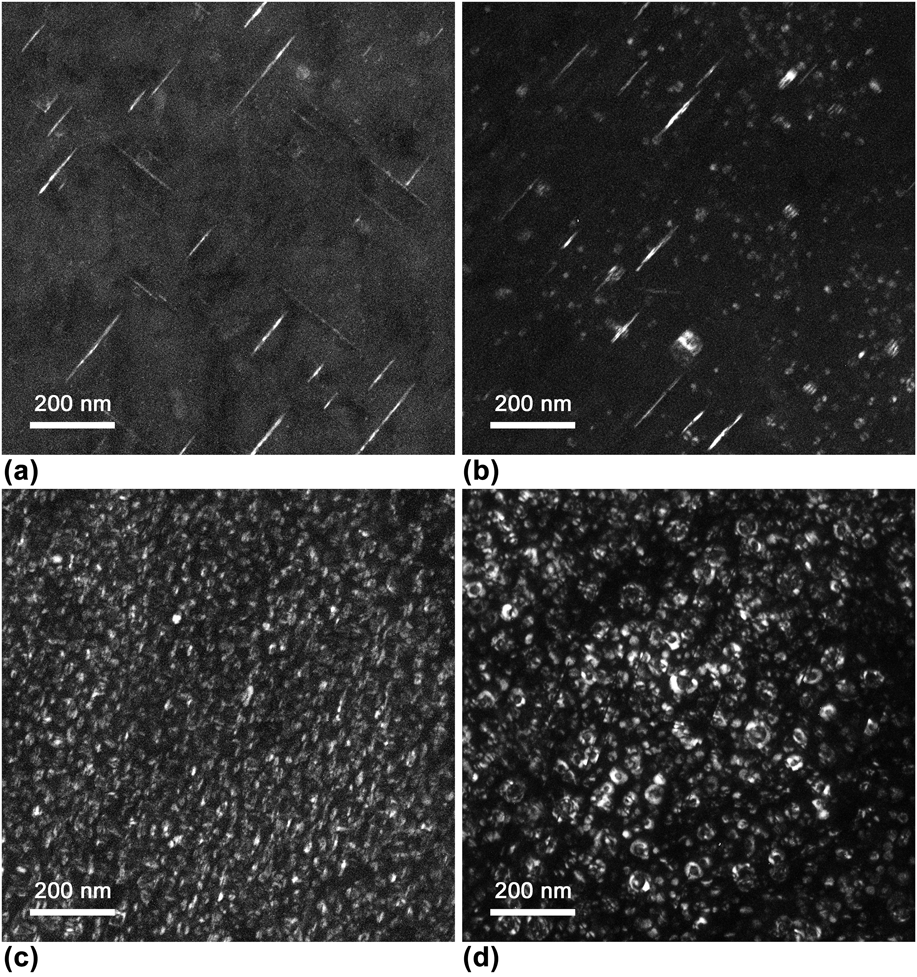
To determine whether the decrease in the amount of T1 precipitates is due to the precipitation of δ′ precipitates, the δ′ and θ′ precipitates of the alloys with various Li contents were analyzed using the dark field images taken along the [112] zone axis with the aperture in the DF2 position as described in Fig. 2(e), with the results shown in Fig. 4. It is observed that the amount of δ′ precipitates increased as the Li content increased from 1.0 to 2.5 wt%. It is inferred that the increasing Li content does indeed promote the formation of the δ′ precipitates. Meanwhile, the amount of T1 precipitates first increased and then decreased as shown in Fig. 3. Thus, the relationship between the amounts of δ′ and T1 precipitates depended on the Li level.
Dark field transmission electron micrographs in the [112] zone axis with the aperture in the DF2 position described in Fig. 2(e) for the Al–Cu–Mg–Li–Sc–Ag alloys with various Li contents: (a) 1.0 wt%; (b) 1.5 wt%; (c) 2.0 wt%; (d) 2.5 wt%.

As shown in Figs. 3(a) and 3(b) and Figs. 4(a) and 4(b), the amount of T1 precipitates and θ′ phase increased and decreased respectively as the Li content in the alloy increased from 1.0 wt% (A1 alloy) to 1.5 wt% (A2 alloy). But the total amount of Cu-containing precipitates (T1 + θ′) increased. This finding can be attributed to the effect of Li content on the solubility of Cu in the α-Al matrix at the aging temperature. According to Ref. Reference Li, Liu, Chen, Zhang and Zheng28, the solubility of Cu in the α-Al matrix at the aging temperature decreased with Li content. As a result, when the Li content of the alloy increased from 1.0 wt% (A1 alloy) to 1.5 wt% (A2 alloy), the supersaturation of Cu atoms in the α-Al matrix at the aging temperature increased, resulting in more precipitates appearing in the A2 alloy as shown in Fig. 3. Upon a further increase in the Li content to above 2.0 wt% (A3 alloy, A4 alloy), the θ′ phase disappeared and the amount of the T1 precipitates decreased while the volume fraction of the δ′ precipitates increased. This confirmed that the decrease in the volume fraction of T1 phases is due to the precipitation of the δ′ phase suppressing the precipitation of the T1 and θ′ precipitates. It inferred that the increase in Li content at low level (i.e., 1.0 to 1.5 wt%) promoted the precipitation of T1 precipitates, which was independent of the promotion of the precipitation of the δ′ precipitates due to the small amount of the δ′ precipitates. Both the precipitation of δ′ and T1 precipitates were promoted. However, when the Li content increased to above 1.5%, a large amount of δ′ precipitate formed faster before T1 precipitates [Reference Wu, Li, Han, Ma and Wang30] and trapped most of the vacancies [Reference Kumar and Heubaum31] and Li atoms [Reference Li, Liu, Chen, Zhang and Zheng28]. Then, the precipitation of θ′ and T1 was limited due to the deficiency of Li solute atoms and vacancies. Meanwhile, the Cu content in the α-Al matrix of alloys decreased with the increasing Li content, as shown in Fig. 1. The decrease in Cu content also inhibited the T1 and θ′ precipitation due to the insufficient Cu solute atoms in the α-Al matrix. Thus, it can be concluded that the decrease in precipitation of T1 and θ′ precipitates with Li content can be attributed to the formation of δ′ precipitates and the decrease in Cu content in the α-Al matrix.
Micro-yield and macro-yield strength
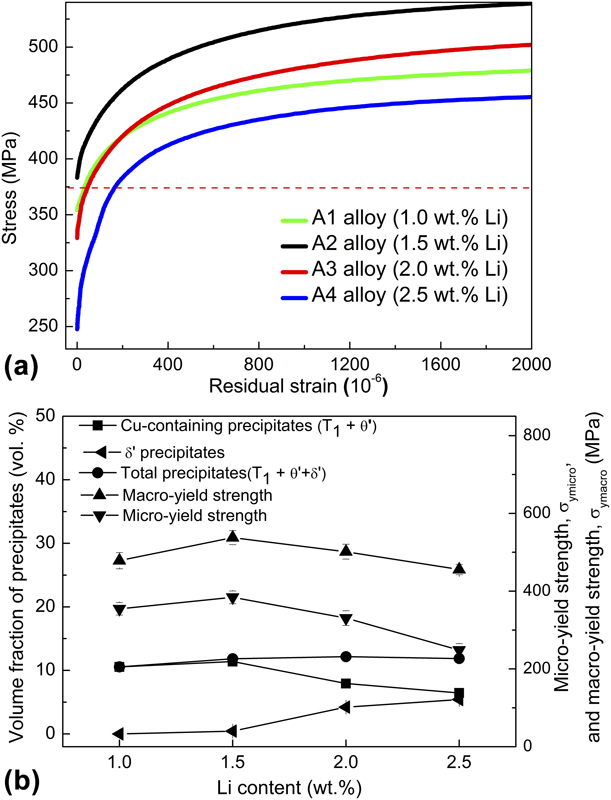
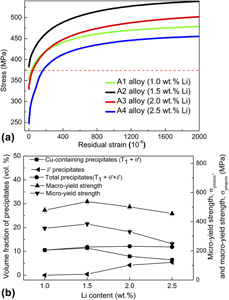
It is observed from Figs. 2–4 that Li content has a significant effect on the precipitates in the α-Al matrix of the Al–Cu–Mg–Li–Sc–Ag alloys, which likely influenced the dimensional stability of Al alloys [Reference Song, Ding, Xiao, Zhao, Cai, Guo, Li and Zheng4, Reference Cui, Wang and Ren9, Reference Liu, Li, Peng and Jun11]. To demonstrate the effect of Li content on the dimensional stability of the alloys, the micro-yield behavior of the alloys, and the relationship between the micro-yield and macro-yield strengths and the precipitates are shown in Figs. 5(a) and 5(b), respectively. As shown in the stress (σ)–residual strain (εr) curves in Fig. 5(a), an applied stress of 375 MPa (dashed line) resulted in the residual strains of 33 × 10−6, 0, 47.8 × 10⁻⁶, and 168.4 × 10⁻⁶ for the A1, A2, A3, and A4 alloys, respectively. The A2 alloy with 1.5 wt% Li had the smallest residual strain, indicating that it had the best dimensional stability under applied stress among the studied alloys.
(a) σ–εr curves and (b) the effect of Li content on the volume fractions of the precipitates, micro-yield and macro-yield strengths of the Al–Cu–Mg–Li–Sc–Ag alloys with various Li contents.

Figure 5(b) presents the relationship between the micro-yield and macro-yield strengths and the volume fraction of the precipitates. It is observed that as the Li content increased, the micro-yield and macro-yield strengths of the alloys first increased and then decreased. The change in the strengths was consistent with the volume fraction change of the Cu-containing precipitates (T1 + θ′ precipitates) rather than with that of the δ′ precipitates or that of the total precipitates (T1 + θ′ + δ′ precipitates) in the Al–Cu–Mg–Li–Sc–Ag alloys. This was mainly attributed to the superior pinning and impeding effect of the Cu-containing precipitates on the dislocation motion that is the essential mechanism of micro-yielding and macro-yielding [Reference Zhang, Sun, Li and Zhang32]. After artificial aging at an elevated temperature, the density of the mobile dislocations decreased due to the Cu-containing precipitates (T1, θ′ precipitates) preferentially nucleating on dislocations, which was similar to the dispersed phase in the 2024 alloy [Reference Yang and Wu33]. In addition, the Cu-containing precipitates act as obstacles to the dislocation movements during micro-yielding or macro-yielding. According to the classical dislocation theory [Reference Zhang, Sun, Li and Zhang32], the force required to overcome the strong obstacles encountered by the dislocation in the gliding process is given by Gb/L, where G and b are the shear modulus and Burgers vector of the matrix, respectively, and L is the effective distance between the obstacles in the matrix. When the Li content increased from 1.0 wt% (A1 alloy) to 1.5 wt% (A2 alloy), more Cu-containing precipitates precipitated from the α-Al matrix during aging. Therefore, L decreased and the resistance to the dislocation movement increased, resulting in higher micro-yield and macro-yield strengths. With the Li content further increasing to above 1.5 wt%, the θ′ precipitates disappeared and δ′ precipitates began to precipitate from the α-Al matrix. Although the increase in the volume fraction of the δ′ precipitates resulted in an increase in the total amount of precipitates (T1 + θ′ + δ′ precipitates) with increasing Li content, the low surface energy of the α/δ′ interface and the antiphase boundary energy of the δ′ phase [Reference Prasad and Ramachandran34] resulted in the easy shearing of the δ′ precipitates by the dislocations. Hence, the δ′ precipitates have a poor precipitation strengthening effect. The increase in the volume fraction of the δ′ precipitates can only suppress, but not reverse, the decrease in the micro-yield and macro-yield strengths. Hence, the micro-yield and macro-yield strengths were mainly due to the contribution of the T1 precipitates. Since the volume fraction of T1 precipitates began to decrease when Li content exceeded 1.5 wt%, the micro-yield and macro-yield strengths also decreased, so that the A2 alloy with the highest volume fraction of the T1 precipitates exhibited the highest micro-yield and macro-yield strengths.
Difference between micro-yield and macro-yield strength
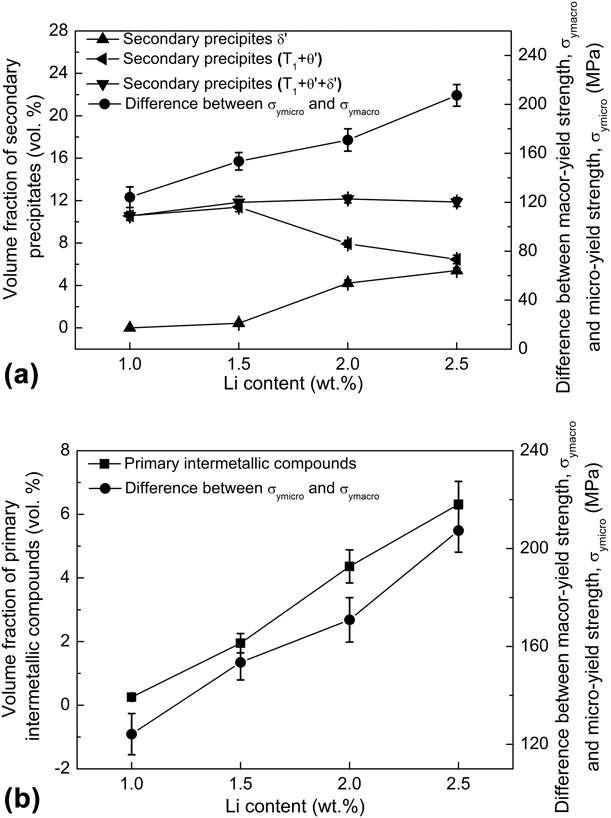
An examination of the micro-yield and macro-yield strength data presented in Fig. 5(b) shows that although they have the same trend with Li content, the difference between the MYS and macro-yield strength, σymacro–σymicro, increased with increasing Li content. It is inferred that the microstructure may have different effects on the MYS and macro-yield strength of the alloys. Both the micro-yield and macro-yield strengths are related to the strengthening effect arising from the secondary precipitates pinning and impeding the movement of the dislocations [Reference Wang, Wu, Sun, Qin and Tian3, Reference Zhang, Sun, Li and Zhang10]. In addition, it was found that the MYS of materials was significantly affected by the thermal residual stress [Reference Qu, Lou, Li, Kuang and Lou8], which could generated by the thermal expansion mismatch between the primary phases (intermetallic compounds) and the α-Al matrix [Reference Adrien, Maire, Estevez, Ehrstrom and Warner35]. To determine the effect of secondary precipitates or the primary phases in the Al–Cu–Mg–Li–Sc–Ag alloys on the σymacro–σymicro, the relationships between the σymacro–σymicro and volume fraction values of the precipitates (i.e., secondary θ′, δ′ and T1 precipitates) and primary phases (i.e., primary θ, Al8−x Cu4+x (Sc, Zr) and T1 phases) are presented in Figs. 6(a) and 6(b), respectively. As shown in Fig. 6(a), the relationship between σymacro–σymicro and Li content is inconsistent with that of the volume fractions of the various secondary precipitates. It is inferred that the difference in the volume fractions of the secondary precipitates in the Al–Cu–Mg–Li–Sc–Ag alloys with different Li contents is not the main reason for the increase in σymacro–σymicro with increasing Li content.
Relationship between the volume fractions and the difference between the micro-yield and macro-yield strengths for the Al–Cu–Mg–Li–Sc–Ag alloys with various Li contents: (a) secondary precipitates; (b) primary intermetallic compounds.

The examination of Fig. 6(b) shows that the relationship between the σymacro–σymicro value and Li content is consistent with that for the volume fraction of the primary intermetallic compounds. It is inferred that the difference in primary intermetallic compounds in the Al–Cu–Mg–Li–Sc–Ag alloys with various Li contents is likely the main origin of the difference in the MYS and macro-yield strength. This observation can be attributed to the increasing volume fraction of the primary intermetallic compounds increasing the thermal stress between the primary intermetallic compounds and α-Al matrix. The thermal stress may be superimposed on the applied stress to induce plastic deformation. Because the MYS is the stress corresponding to the residual strain of 1 × 10⁻⁶, the superimposition of applied stress and the thermal stress will decrease the stress required to induce a plastic deformation of 1 × 10⁻⁶ [Reference Zhang, Sun, Li and Zhang10], leading to the decrease in the MYS. In addition, the coarse primary intermetallic compounds gave rise to stress concentration around their edges during the loading process. The stress concentration may further reduce the MYS together with the thermal stress. Hence, the more primary intermetallic compounds corresponds to greater internal stress, more severe the stress concentration, and lower MYS. By contrast, because the macro-yield strength is the stress corresponding to the residual strain of 2 × 10⁻³, the thermal stress distribution around the intermetallic compounds hardly affected the macro-yield strength [Reference Zhang, Sun, Li and Zhang32]. Therefore, as the Li content increased, the increase in the volume fraction of the primary intermetallic compounds caused larger decreases for the MYS than for the macro-yield strength, resulting in the difference between the macro-yield and MYSs increasing with increasing Li content.
Thermal expansion behavior
As discussed above, the Li content influenced the MYS of aged Al–Cu–Mg–Li–Sc–Ag alloys due to the change in the volume fractions of the primary intermetallic compounds and secondary precipitates. It can be expected that this will affect the thermal dimensional stability of the alloy.
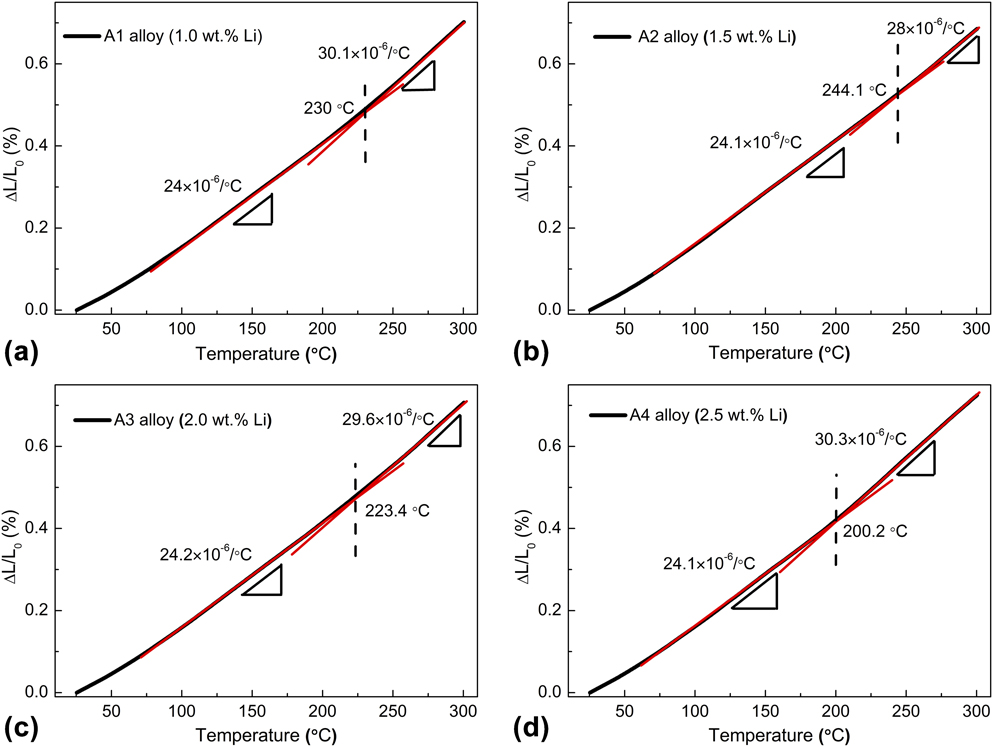
To demonstrate the influence of Li content on the thermal dimensional changes, the thermal expansion behaviors of the alloys with various Li contents were examined using thermal expansion measurements and the curves of the relative length change (RLC) versus temperature are shown in Figs. 7(a)–7(d). It was found that the slopes of the curves (coefficients of thermal expansion, CTE) of the studied alloys at high temperature deviated from those at low temperature as the test temperature increased from 25 °C to 300 °C, as shown in Figs. 7(a)–7(d). The degree of the deviation of CTEs and the CTE transition temperatures (CTETT, temperatures at which the slope change), changed with the Li content in the alloys. This finding indicated that the Li content had a significant effect on the thermal dimensional stability of the alloys.
Curves of the change in the relative length of the aged Al–Cu–Mg–Li–Sc–Ag alloys with various Li contents: (a) 1.0 wt%; (b) 1.5 wt%; (c) 2.0 wt%; (d) 2.5 wt%.
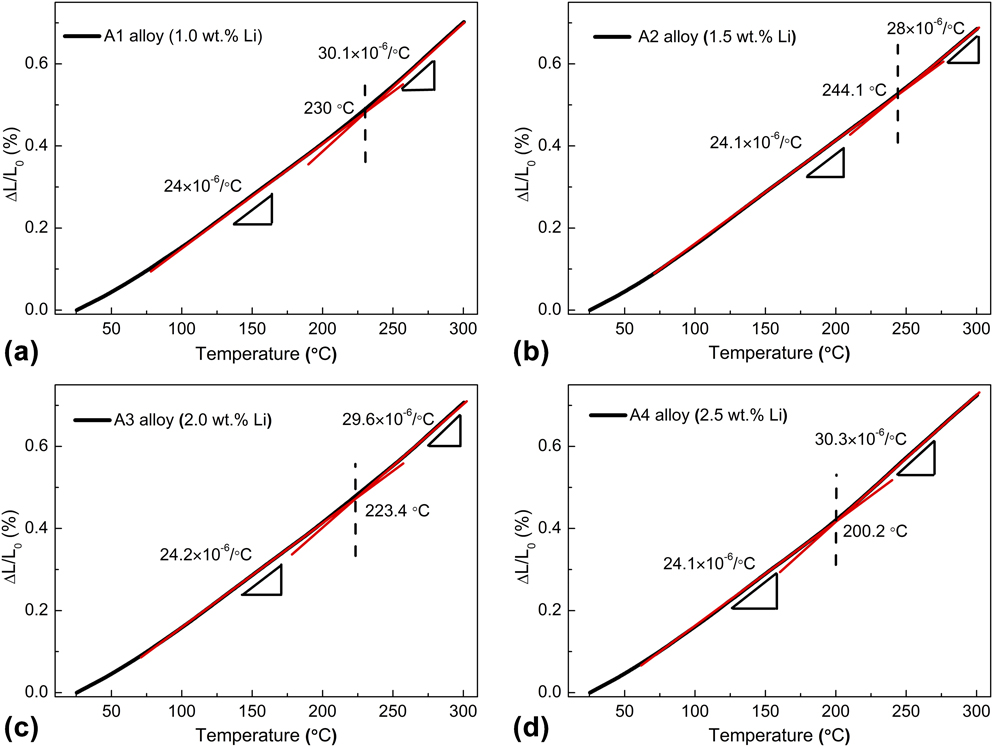
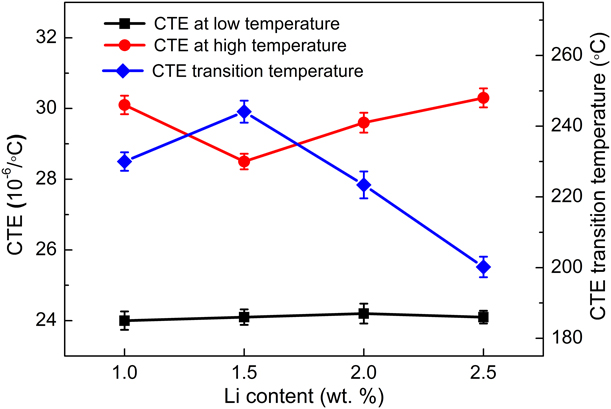
The average CTEs at low temperatures (25 °C to CTETT), referred to as CTEL, and those at high temperatures (CTETT to 300 °C), referred to as CTEH, and the CTETTs were measured and calculated and the results are presented in Fig. 8. An examination of Fig. 8 shows that with the Li content increasing from 1.0 to 2.5 wt%, the CTETT of the alloys first increased and then decreased, while the CTEHs of the alloys first decreased and then increased. The A2 alloy containing 1.5 wt% Li showed the highest CTETT and lowest CTEH, demonstrating the best thermal dimensional stability among the four alloys.
CTEs at low temperature (25 °C to CTETT) and high temperature (CTETT to 300 °C) and CTE transition temperature (CTETT) of the aged Al–Cu–Mg–Li–Sc–Ag alloys with various Li contents.
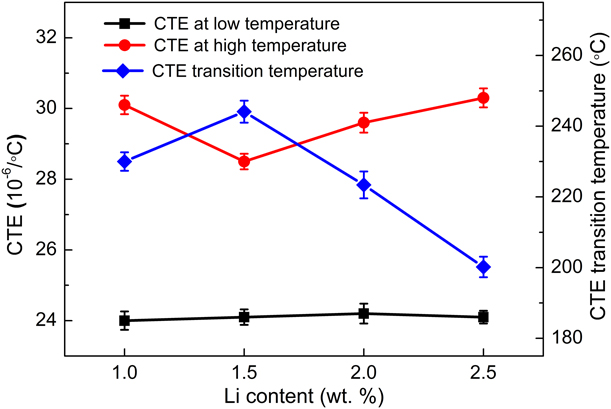
As shown in Fig. 8, the CTEL values of the studied alloys were relatively low and were not affected by the Li content, unlike the CTEH values. This may be attributed to the different relaxation mechanism of the residual stress between 25 °C and CTETT and between CTETT and 300 °C [Reference Yang, Wang, Tan, Zhi, Yang, Zhang, Liu, Ge and Liang36]. Due to the CTE mismatch between the intermetallic compounds and α-Al matrix, the residual stress in the studied alloys generated during the cooling process (such as casting and quenching processes [Reference Peng, Chen, Zhang, Liu and Wu37]) and a thermal CTE mismatch stress is generated during the heating process. As the experimental temperature increased, the residual stress was reduced elastically by the thermal CTE mismatch stress due to their opposite forming processes. Because the studied alloys may retain sufficiently high micro-yield and macro-yield strengths at the low test temperatures (25 °C to CTETT), it is difficult for these to be exceeded by the residual stress. Hence, the residual stress only relaxed by elastic relaxation rather than the plastic relaxation at the temperatures between 25 °C and CTETT. The changes in the dimensions of the alloys were due mainly to the elastic relaxation of the internal stress and were determined by the change in the average distance between the Al atoms [Reference Benal and Shivanand38], so that the four alloys showed similar CTEs in the temperature range between 25 °C and CTETT, as shown in Fig. 8.
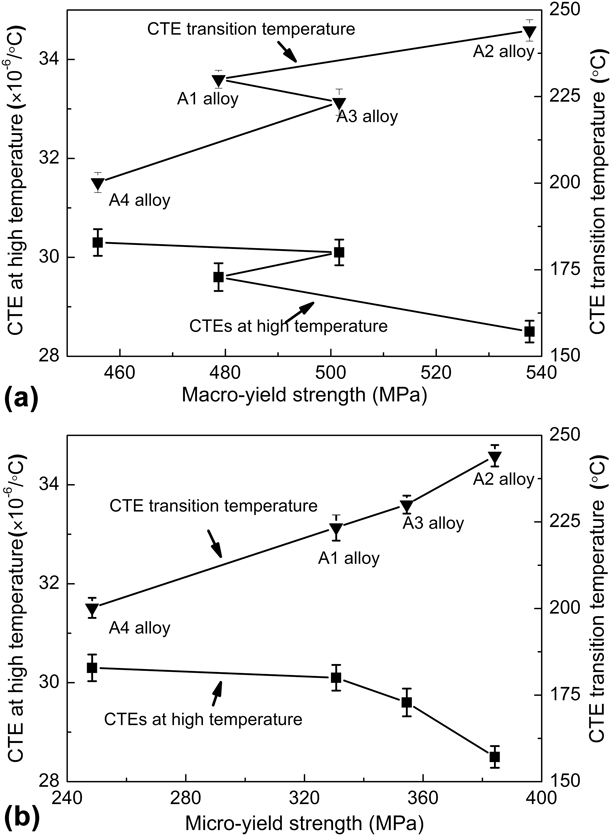
The macro-yield and MYSs decreased with increasing test temperature. The residual stress in the alloys may be greater than the macro-yield stress [Reference Deschamps, Garcia, Chevy, Davo and De Geuser18] or MYS [Reference Dong, Shao, Jiang, Chao and Zhen6], and cause it to relax by the plastic relaxation. Hence, the CTEs of the studied alloys increased, as shown in Fig. 8, where the CTEH in the temperature range between CTETT and 300 °C is higher than the CTEL in the temperature range between 25 °C and CTETT. To determine the strength that governs the CTE, the relationships between the CTEH and CTETT and the macro-yield and MYSs are shown in Figs. 9(a) and 9(b), respectively. It was found that the CTEH and CTETT shows a good correlation with the MYS rather than with the macro-yield strength, as shown in Fig. 9(b). It is inferred that the CTEH and CTETT are controlled by the MYS rather than the macro-yield strength of the alloys.
Relationship of the CTEs at high temperature and CTE transition temperatures to macro-yield strength (a) and MYS (b) of the aged Al–Cu–Mg–Li–Sc–Ag alloys.

As mentioned in the previous sections, the micro-yield and macro-yield strengths are theoretically the stresses corresponding to the residual strains of 1 × 10⁻⁶ and 2 × 10⁻³, respectively. The micro-yield deformation is due to the movement of a few dislocations while the macroscopic yield deformation is the result of a large number of dislocation movements. Hence, the MYS is more sensitive to the dislocation movements than the macro-yield strength. Since the increased test temperature enhanced atomic motions, promoting the motion of mobile dislocations, the MYS is more sensitive to temperature than the macro-yield strength. As the experimental temperature is raised, the temperature required to decrease the MYS may be lower than that required to decrease the macro-yield strength. Therefore, as the test temperature increased above the CTE transition temperature, the MYS was decreased below the residual stress while the macroscopic yield strength was still higher than the residual stress. The residual stress of the alloys is released by local micro-yield deformation rather than the macro-yield deformation [Reference Dong, Shao, Jiang, Chao and Zhen6], leading to an increase in the CTEs of the studied alloys. For the studied alloys with higher MYS, higher temperatures were required to decrease the MYS to give rise to the plastic relaxation of the residual stress, so that the alloys with high MYSs exhibited low CTEH and high CTETT values.
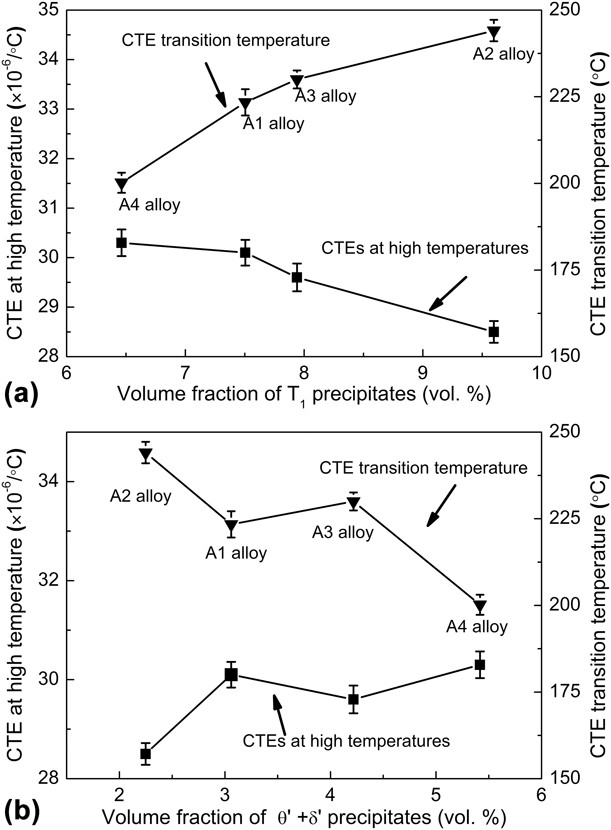
The effect of the MYS on CTEH and CTETT arises from the differences among the precipitates of the four kinds of tested alloys. T1 precipitates play an important role due to their superior thermal stability [Reference Balducci, Ceschini, Messieri, Wenner and Holmestad39] and are the main strengthening precipitates in the studied alloys. Figure 10 presents the relationship of CTEH, CTETT to the volume fraction of T1 [Fig. 10(a)] and θ′ + δ′ precipitates [Fig. 10(b)]. An examination of Fig. 10(a) shows that as the volume fraction of the T1 precipitates increased, the CTEH decreased while the CTETT increased. By contrast to the effect of T1 precipitates, the CTEH increased while the CTETT decreased with increasing total volume fraction of the θ′ + δ′ precipitates, as observed from Fig. 10(b). This finding indicated that the effect of the MYS on the CTEH and CTETT of the studied alloys mainly depended on the volume fraction of the T1 precipitates. This is because T1 precipitates have a high activation temperature of platelet thickening [Reference Chen, Zhao and Fan17], and greater content of the T1 precipitates in the studied alloy leads to higher MYS at high temperature and the slower decrease in the MYS with increasing test temperature. However, at high temperature, θ′ and δ′ precipitates have low stability compared to the T1 precipitates [Reference Chen, Zhao and Fan17, Reference Bonfield and Datta40]. As the test temperature rose above CTETT, the θ′ precipitates in the A1 alloy were coarsened by Ostwald ripening [Reference Bonfield and Datta40] and δ′ precipitates were dissolved into the α-Al matrix due to the increase in solubility of Li in the α-Al matrix [Reference Kellington, Loveridge and Titman41, Reference Hallstedt42]. As a result, the number density of the θ′ and δ′ precipitates decreased, and the distance between the precipitates increased, resulting in the decrease in the MYS of the alloys. Hence, it can be concluded that to improve the thermal dimensional stability of Al–Cu–Mg–Li–Sc–Ag alloys, it is crucial to promote the precipitation of the T1 phases by adding an appropriate content of Li to the Al–Cu–Mg–Li–Sc–Ag alloy. Since the A2 alloy contains the most T1 precipitates among the four kinds of alloys, it exhibited the lowest CTE at high temperature and the highest CTE transition temperature, as shown in Fig. 10.
Relationship of CTEs at high temperature and CTE transition temperatures to the volume fraction of the T1 (a) and θ′ + δ′ precipitates (b) of the aged Al–Cu–Mg–Li–Sc–Ag alloy.

Conclusions
(1) The Al–Cu–Mg–Li–Sc–Ag alloy with 1.5 wt% Li content mainly contained the primary T1, and θ phases, and secondary T1, θ′, and δ′ precipitates. Increasing Li content in the Al–Cu–Mg–Li–Sc–Ag alloy promoted the formation of the primary T1 phases and the secondary T1 and δ′ precipitates. However, an excessive Li content resulted in a greater amount of δ′ precipitates, which suppressed the precipitation of the T1 and θ′ precipitates.
(2) As the Li content increased, both MYS and macro-yield strength of Al–Cu–Mg–Li–Sc–Ag alloys first increased and then decreased due to the suitable Li content promoted the precipitation of Cu-containing phases, which were mainly T1 precipitates, while excessive Li content suppressed their precipitation. In addition, the difference between the micro yield strength and the macro-yield strength increased with increase in Li content due to the increase in the amount of the primary phase, mainly primary T1 phase.
(3) The CTEH of Al–Cu–Mg–Li–Sc–Ag alloys was higher than CTEL due to the plastic relaxation of residual stress. The increase in the Li content caused the CTEH to first decrease and then increase, while the CTETT of the alloys first increased and then decreased. The CTEH and CTETT values were determined by the MYS rather than by the macro-yield strength of the alloys. The effect of the MYS on CTEH and CTETT arises from the difference in the amounts of T1 precipitates among the four tested alloys because T1 precipitates had superior thermal stability.
Materials and experimental methods
Materials and heat treatment
In the present work, the alloys all share the same concentration of 4.4 wt% Cu as major alloying element and 0.4 wt% Mg, 0.4 wt% Ag, 0.5 wt% Mn, 0.5 wt% Zn, 0.2 wt% Sc, and 0.12 wt% Zr as micro-alloying elements. To study the effect of Li contents, four Al–Cu–Mg–Li–Sc–Ag alloys with various Li contents (1.0, 1.5, 2.0, and 2.5 wt%) were prepared using the conventional casting method. A mixed molten flux of LiF and LiCl (LiCl:LiF = 3:1) and dynamic argon protection were used to cover the molten Al–Cu–Mg–Li–Sc–Ag alloy to avoid oxidation and absorption of hydrogen from the atmosphere [Reference Singh and Gokhale43, Reference Wu, Chen, Li, Ma and Wang44]. All of the alloy ingots were first homogenized at 480 °C for 24 h and then hot extruded into 45 mm diameter bars at an extrusion temperature of 450 °C and a hot extrusion ratio of 4:1. The as-extruded bars were machined along the extrusion direction to fabricate the tensile samples with a diameter of 5 mm and gauge length 25 mm. The samples were then solution treated at 520 °C for 2 h, quenched in water at room temperature, and aged at 180 °C for 24 h.
Characterization of materials
The microstructures of the alloys were examined by scanning electron microscopy (SEM; JSM6700, JEOL Ltd., Tokyo, Japan) and transmission electron microscopy (TEM; JEM-2100, JEOL Ltd., Tokyo, Japan). Energy dispersive X-ray spectroscopy (EDS) was used to determine the chemical composition of each phase in the alloys. SAED was used to identify the precipitates in the alloys. TEM samples with a diameter of 3 mm and a thickness of 50 μm were prepared by mechanical grinding followed by twin-jet electropolishing with a solution of 25 vol% nitric acid and 75 vol% methanol at 15 V and −20 °C.
In present alloys, the volume fractions of the primary phases were identified as the area percent obtained by counting analysis on the SEM micrographs through the quantitative image analysis software (Image-Pro plus, Media Cybernetics, USA), on the basic of quantitative metallography [Reference Liao, Sun and Sun45]. Each data obtained represents an average of 15 pictures including the field of view in three directions of the alloy (one paralleling and two perpendicular to the extrusion direction).
The statistical analysis of TEM photographs based on stereology determined the volume fraction, number density, diameter and thickness of the second precipitate [Reference Gilmore and Starke46]. The formula for the volume fraction of precipitates is determined as:
 $${V_{\rm{V}}} = \left( {{{ - 2\pi d} \over {\pi d + 8h}}} \right)\ln \left( {1 - {A_{\rm{A}}}} \right)\quad ,$$
where d is the precipitate diameter, h is the foil thickness, and A A is the projected area fraction of the precipitate.
Dimensional stability tests
To evaluate the dimensional stability of Al–Cu–Mg–Li–Sc–Ag alloys, their MYS and CTE were determined with the continuous loading method, which is a general test method for measuring MYS [Reference Dong, Shao, Jiang, Chao and Zhen6, Reference Song, Ding, Zhao, Xiao and Guo7]. Compared with the step load–unload method, the former can reduce the strain hardening effect of micromechanical cyclic and test deviation attributing to the environmental fluctuations during the long test. The MYS values of the alloys were measured by a uniaxial tensile test at room temperature using a CMT 5105 universal testing machine. The stress–strain (σ–ε) curves were obtained after the test and the residual plastic strain (εp) was calculated according to the equation of εp = ε − σ/E. In the current study, the stresses corresponding to εp = 1 × 10⁻⁶ and 2 × 10⁻³ on the σ–εp curve were defined as the micro-yield and macro-yield strength, respectively [Reference Edeson, Aglietti and Tatnall47].
The thermal expansion measurements were carried out using the LINSEIS DIL L76 instrument, LINSEIS, Germany [Reference Cheng, Liang, Mao, Ge, Yuan, Guo and Liang48]. Prior to the test, the samples with length and diameter of 5 mm were stabilized at room temperature for 0.5 h to eliminate external disturbances and then were heated from room temperature to 300 °C at a rate of 5 °C/min. The RLCs were recorded and the CTE α was evaluated as the slope of the plot of the RLC values versus the temperature [Reference Uju and Oguocha49].