I. INTRODUCTION
Nanocrystalline materials have gained a lot of attention as a result of their unique microstructure, which leads to outstanding physical and mechanical properties.Reference Gleiter, Weissmuller, Wollersheim and Wurschum1–Reference Konstantatos and Sargent3 A number of methods have been developed to achieve a bulk material with nanometer-scale grains. These include rapid solidification,Reference Spassov, Rangelova and Neykov4 plasma processing,Reference Laha, Agarwal, McKechnie, Rea and Seal5 electrodeposition,Reference Bicelli, Bozzini, Mele and D’Urzo6 sputtering,Reference Park, Lee, Park, Kima and Choi7 torsion straining under high pressure,Reference Valiev8 equal channel angular pressing,Reference Furukawa, Horita, Nemoto and Langdon9 and mechanical attrition—ball milling.Reference Koch10–Reference Fecht13 In terms of cost and productivity, mechanical milling is an effective method to synthesize a large quantity of nanocrystalline material in powder form. This method induces severe plastic deformation, which consists of repeated welding, fracturing, and rewelding of the powders.
Cryomilling is basically a mechanical milling process conducted in a liquid nitrogen atmosphere, which results in much shorter milling times to reach the desired fine particle size. There are several advantages of cryomilling over milling at room temperature. First, powder agglomeration and welding to the milling media are suppressed, resulting in a more efficient milling outcome.Reference Lavernia, Han and Schoenung14 Second, oxidation reactions during milling are reduced under nitrogen atmosphere. Third, the milling time required to attain a nanostructure is significantly reduced due to the extremely low temperatures during cryomilling, which suppress dynamic recovery and recrystallization.Reference Suryanarayana15 The drawback of this processing technique is, however, that small amounts of impurity elements may be introduced during cryomilling and form nanoscale dispersions. However, it is well accepted that the existence of second phases such as oxides, nitrides, and carbides enhances the retarding force on grain-boundary migration, which plays a significant role in stabilizing the microstructure.Reference Tellkamp, Melmed and Lavernia16 Extensive experiments have been performed to achieve nanostructured Al-based alloys,Reference Tellkamp, Melmed and Lavernia16–Reference Witkin and Lavernia22 Zn–Al alloys,Reference Xun, Lavernia and Mohamed23 Mg–Fe mixtures,Reference Riktor, Deledda, Herrich, Gutfleisch, Fjellvåg and Hauback24 and Ti alloysReference Ertorer, Zúñiga, Topping, Moss and Lavernia25 by cryomilling. However, nanocrystalline Mg-based alloys fabricated by cryomilling have not been reported yet. As of today, grain refinement of Mg and Mg-based alloys to nanometer scale by conventional processing techniques continues to be a challenging task mainly due to the dynamic recovery and recrystallization that cannot be suppressed.Reference Su, Lu and Lai26 In addition, it is well known that the hexagonal crystal structure of Mg provides only a limited number of active slip systems. Therefore, factors such as shear planes, grain rotation, and texture seem to play an important role in assisting grain refinement by conventional techniques.Reference Matsubara, Miyahara, Horita and Langdon27–Reference Pérez-Prado, del Valle and Ruano29 In this work, we demonstrate that nanocrystalline Mg-based alloy powders with an average grain size of 25 nm can be successfully processed by cryomilling.
To synthesize the cryomilled powders into a bulk material, a number of conventional consolidation methods, such as hot-isostatic-pressing (HIPing)Reference Han, Lee, Nutt, Lavernia and Mohamed19 and cold-isostatic-pressing (CIP),Reference Ye, Han, Lee, Ahn, Nutt and Schoenung20 exist, which are generally accompanied by extrusion,Reference Han, Lavernia and Mohamed18–Reference Park, Chung, Kim and Lavernia21 as a secondary process to remove any remaining porosity and to enhance the mechanical properties. However, a significant grain growth has been observed using HIPing or after secondary process. To preserve the initial fine grain size after consolidation, it has been demonstrated that spark-plasma-sintering (SPS) can successfully consolidate nanocrystalline powders into a bulk material form with shorter time and lower temperature than those required in the conventional methods and without any secondary process.Reference Chaim, Shen and Nygren30, Reference Ye, Ajdelsztajn and Schoenung31 SPS is basically a modified hot pressing technique in which a pulsed DC current and an uniaxial pressure are applied simultaneously. Traditionally, the current passes through an electrically conductive graphite die and heats the sample. The localized high temperature at powder particle contacts can further lead to the densification of the powders.
In the present study, nanocrystalline Mg-based alloy powders are successfully processed via cryomilling. We use the SPS process to consolidate the cryomilled powders to achieve a bulk nanocrystalline material. The as-received and cryomilled powders and the consolidated bulk material are characterized by scanning electron microscopy (SEM), electron dispersive spectroscopy (EDX), x-ray diffraction (XRD), and transmission electron microscopy (TEM).
II. EXPERIMENTAL PROCEDURE
Commercially available gas-atomized Mg and Mg–Al alloy (Mg50Al50) powders were blended to formulate a final composition of Mg70Al30 (wt.%). Half of a kilogram of the blended powder was cryogenically milled under liquid nitrogen atmosphere in a Union Process, Szegvari mill (Akron, OH) extensively modified at California Nanotechnologies for safe light alloy processing. Hardened stainless steel balls (6-mm diameter) were used as milling media at a particular ball-to-charge ratio for a given material. A 30:1 ball-to-powder mass ratio is common for milling metallic powders. Powder consolidation was performed using an SPS system (Syntex Inc., Dr. Sinter Lab TM, model SPS-515S, Kanagawa, Japan). The processed powder was placed in a graphite die lined with graphite foil. The sintering process was performed in a vacuum and under a maximum uniaxial pressure of 65 MPa. A K-type thermocouple inserted into the outer wall of the die was used to control the ramp rate (75 °C/min) and hold temperature (for 6 min at 400 °C) as a pulsed electric current was applied through graphite punches. The SPS-consolidated specimen resulted in a disk with 25.4 mm and 6 mm of diameter and thickness, respectively.
The morphology and composition of the as-received and cryomilled powders and the bulk nanocrystalline SPS sample were investigated with SEM. A FEI Nova 230 Variable Pressure SEM (VP-SEM) equipped with a Thermo Fisher Scientific EDS system at 15-kV accelerating voltage was used for this purpose. XRD was performed using a Panalytical X’Pert ProX-ray Powder Diffractometer using Cu Kα (λ = 0.1542 nm) radiation to determine the crystalline size. High-resolution microstructural characterization was carried out using a FEI Titan 300-kV scanning transmission electron microscope (STEM). TEM samples of the as-received and cryomilled powders were prepared by spreading of an ultrasonicated suspension of the powders in ethanol onto a regular Cu-grid. A FEI Nova 600 Nanolab DualBeam focused ion beam (FIB)-SEM was used to prepare a thin film TEM sample from the bulk material.
III. RESULTS AND DISCUSSION
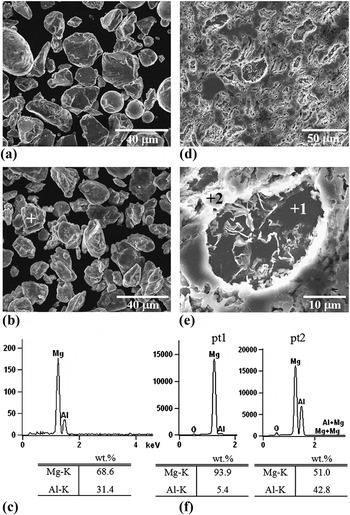
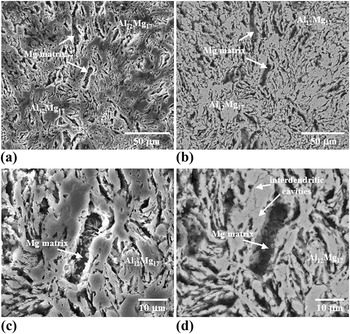
Figure 1 shows the SEM characterization of the as-received and cryomilled Mg70Al30 powders, as well as the material after SPS. The as-received powders with an average particle size of 26.8 ± 7.8 μm of a total of 20 particles measured are shown in Fig. 1(a). The powders after cryomilling [Fig. 1(b)] present a more faceted shape as a result of repeated fracturing involved in the milling.Reference Koch10–Reference Fecht13 Note that the particle size of the cryomilled powders is smaller, with an average value of 19.4 ± 6.7 μm of a total of 20 powder particles measured. The composition of the cryomilled powders, confirmed by the EDX analysis as shown in Fig. 1(c), comprises 69 wt.% Mg and 31 wt.% Al. The cryomilled powders were consolidated by SPS to produce a disk-shaped specimen, referred to as the SPS sample. Figures 1(d) and 1(e) show the SEM images of the microstructure of the SPS sample after polishing and etching with Nital 2%. Figure 1(d) reveals interdendritic network morphology of a second phase that corresponds to Al12Mg17, as shown by the XRD analysis (Fig. 3). Figure 1(e) shows a high-magnification SEM image of the interdendritic Al12Mg17 in bright contrast (highlighted by position 2). In dark contrast appear the Mg-rich regions (highlighted by position 1) as revealed by the EDX analysis shown in Fig. 1(f). The EDX quantitative analysis of position 1 reveals a composition rich in Mg, i.e., around 94 wt.% Mg and 5 wt.% Al, whereas position 2 gives a composition of 51 wt.% Mg and 43 wt.% Al. This particular dendritic morphology due to a high volume fraction of intermetallic compound Al12Mg17 can be seen in more detail in Fig. 2, which displays both secondary and backscatter SEM images of the same region. SEM image [Fig. 2(a)] shows the morphology of the intermetallic compound Al12Mg17 and the Mg-matrix that is visible in the interdendritic space. The two phases are clearly indicated by the contrast in composition in Fig. 2(b). Figures 2(c) and 2(d) correspond to the secondary and backscatter images, respectively, at higher magnification. The presence of small interdendritic cavities due to the nature of the dendritic structure can be observed at higher magnification in Fig. 2(d). To estimate the porosity, we measured the density by immersing the SPS sample in water and using the Archimedes’ method. A 97% density was obtained after SPS.
Scanning electron microscopy (SEM) and electron dispersive spectroscopy (EDX) analysis of the as-received and cryomilled Mg70Al30 powders and of the SPS sample. (a) SEM image of the as-received Mg70Al30 powders. (b) SEM image of the cryomilled Mg70Al30 powders. (c) EDX spectrum and quantitative values (inset) from the marked powder in (b). Low magnification (d) and high magnification (e) SEM images showing the microstructure of the SPS sample. (f) EDX spectra and the quantitative analysis (insets) from the points highlighted by 1 and 2 in (e).

Secondary electron microscopy images (a) and (c) and backscatter electron microscopy images (b) and (d) at different magnifications of the SPS sample.

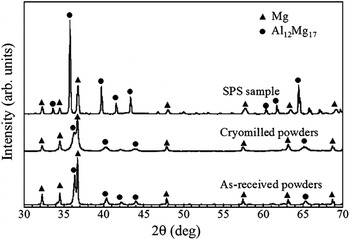
X-ray diffraction spectra for the as-received and cryomilled Mg70Al30 powders and the SPS sample.

Figure 3 shows the XRD spectra for the as-received and cryomilled powders and for the SPS sample. The characteristic peaks of Mg and intermetallic A112Mg17 phases are clearly observed. As expected from the Mg–Al phase diagram, hexagonal close-packed (hcp) Mg and intermetallic A112Mg17 are the two equilibrium phases present at room temperature.Reference Schoenitz and Dreizin32 Note that the intermetallic phase is more predominant after SPS. Once the powders are heat-treated during the SPS process (400 ºC), the formation of A112Mg17 occurs upon cooling.Reference Schoenitz and Dreizin32 The shift A112Mg17 peaks to lower angles indicates a lattice expansion of the SPS sample due to the residual Mg atoms. According to the Scherrer equation, peak width is inversely proportional to crystallite size. Thus, a bigger peak width after cryomilling indicates that the crystallite size is smaller. In contrast, a smaller peak width is obtained after SPS, suggesting a slight grain growth after consolidation. The average crystallite size determined by the peak broadening was 63.4 and 25.3 nm for the as-received and cryomilled powders, respectively. This result indicates that the cryomilling reduces the crystallite size (~3:1) of the as-received powders. As expected, the crystallite size increases (approximately two times higher) after SPS process. Therefore, a crystallite size of the bulk SPS sample arises around 52 nm, which is one of the smallest grain sizes for bulk nanocrystalline Mg-based alloys ever reported. This increase in grain size observed in the bulk sample is attributed to the grain growth during SPS, where the material experienced a high temperature (400 °C) for a few minutes.
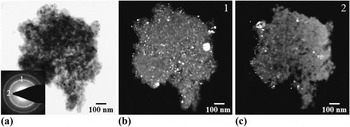
The nanostructure of the as-received and cryomilled powders and of the SPS sample was confirmed by TEM analysis. Figure 4 shows the complementary bright-field and dark-field TEM images of an as-received powder. The dark-field TEM images labeled as 1 and 2 are obtained by setting the objective aperture in the Mg( ) ring and Mg(0002) spot, respectively, as shown in the selective area electron diffraction (SAED) in the inset. Both dark-field TEM images illustrate a grain size distribution with small grains of around 30 nm and larger grains of 70–100 nm.
Transmission electron microscopy (TEM) analysis of the as-received Mg70Al30 powders. (a) Bright-field TEM image of an as-received powder. (b) and (c) Dark-field TEM images from the spots marked 1 and 2, respectively, in the selective area electron diffraction (SAED) of the powder as inset in (a).

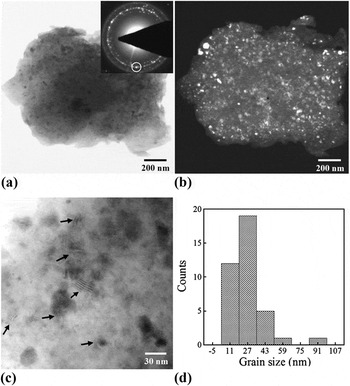
TEM analysis corresponding to a cryomilled powder particle is shown in Fig. 5. Figures 5(a) and 5(b) illustrate the complementary bright-field and dark-field TEM images, respectively, of the cryomilled powder. SAED in the inset [Fig. 5(a)] reveals a typical ring pattern corresponding to nanocrystalline Mg. Dark-field TEM image [Fig. 5(b)] is obtained by setting the objective aperture in the Mg( ) ring as shown in the region highlighted by a circle in the SAED. The bright-field TEM image at higher magnification [Fig. 5(c)] displays the nanocrystalline grains nearly equiaxed with Moiré fringes decorating the interior of some of the grains (highlighted by arrows). To get an average grain size, a total of 50 grains were measured from several dark-field TEM images. The histogram in Fig. 5(d) indicates the distribution of grain size in the cryomilled powder with an average grain size of 27 nm, which is consistent with the results from the XRD analysis (25 nm).
TEM study of the cryomilled Mg70Al30 powders. Complementary bright-field (a) and dark-field (b) TEM images of a cryomilled powder. SAED of the powder as the inset in (a). (c) Higher resolution TEM image of the nanocrystalline grains showing Moiré fringes (highlighted by arrows). (d) A histogram indicating the distribution of grain size in cryomilled Mg70Al30 powders.

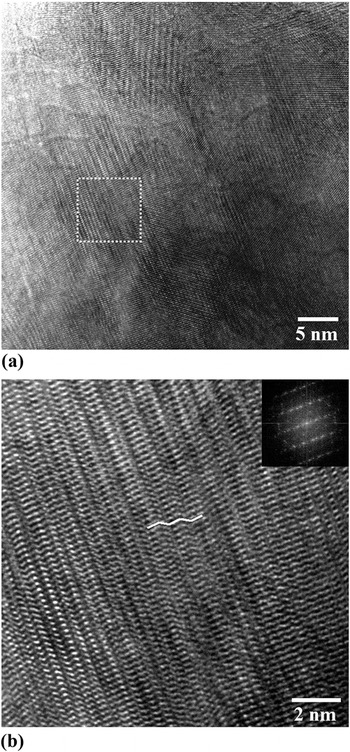
Interestingly, TEM images of the nanocrystalline grains after cryomilling reveal the formation of nanotwins as shown in Fig. 6(a) for a nanocrystalline grain of approximately 20 nm in size. Higher resolution TEM image [Fig. 6(b)] of the region highlighted by the square in Fig. 6(a) exhibits nanotwins and stacking faults inside the grain. Fast Fourier transform (FFT) of the image as inset reveals the characteristic streaks corresponding to structural defects such as twins and stacking faults. This is a surprising result since deformation twinning is rarely observed in nanocrystalline hcp Mg. Even though deformation twinning is known to be an important deformation mechanism in hcp coarse-grained Mg alloys,Reference Reed-Hill and Robertson33 twins are rarely observed in nanocrystalline Mg alloys mainly due to the high stress required for nucleation. Recent studies have demonstrated that the stress required for twin nucleation increases drastically with decreasing grain size to the nanometer scale.Reference Yu, Shan, Li, Huang, Xiao, Sun and Ma34 However, deformation twins have been reported in hcp TiReference Ertorer, Zúñiga, Topping, Moss and Lavernia25 and in nanocrystalline face-centered cubic (fcc) Al with grain size below 20 nm.Reference Chen, Ma, Hemker, Sheng, Wang and Cheng35 Once the grain size decreases, partial dislocation activity inside the grains may result in the formation of stacking faults, and deformation twinning becomes dominant. Here, we provide experimental data showing that deformation twinning in Mg-based powders can be activated by plastic deformation induced during cryomilling. However, further investigations are required to understand the underneath mechanisms inducing deformation twinning in hcp nanocrystalline Mg-based alloys.
(a) Bright-field TEM image of the nanocrystalline grains after cryomilling revealing the formation of nanotwins. (b) Higher resolution TEM image of the region highlighted by the white square in (a) showing the nanotwins and stacking fault defects. Inset is fast Fourier transform of the image.

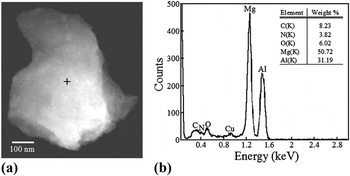
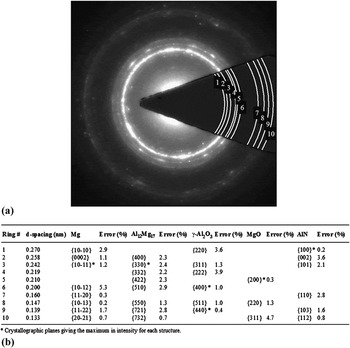
As mentioned before, small amounts of impurity elements may be introduced during cryomilling in liquid nitrogen and form nanoscale dispersions such as oxides and nitrides. The presence of second phases, however, is known to play a significant role in stabilizing the microstructure after heat treatment.Reference Tellkamp, Melmed and Lavernia16 As a matter of fact, a thorough TEM analysis of the cryomilled powders reveals some traces of nitrogen and oxygen. A STEM image of a cryomilled powder and its corresponding EDX analysis are shown in Figs. 7(a) and 7(b), respectively. In addition to Mg and Al, peaks corresponding to N and O can also be found in the EDX spectrum, while the Cu signal is due to the regular Cu-grid used for the TEM observation. The EDX quantitative analysis (as inset) reveals an amount of 3.8 wt.% of N and 6 wt.% of O, suggesting that N and O might exist as impurity atoms in the Mg lattice or in the form of oxides and nitrides. To identify the possible phases present in the cryomilled powders, we performed a detailed indexing of the SAED pattern [Fig. 8(a)]. All the interplanar spacing measurements are shown in Fig. 8(b). The relative errors between the measured and tabulated interplanar spacing values for each structure are also included. The relatively low errors obtained suggest the presence of second phases such as γ-Al2O3, MgO, and AlN, although in much lower volume fraction than the main phases (Mg and Al12Mg17).
(a) STEM image of a cryomilled powder. (b) EDX analysis and quantitative values (inset) from the powder in (a).

(a) SAED pattern of a cryomilled powder. (b) Table showing the interplanar spacing determined by indexing the SAED in (a) and the possible phases present in the cryomilled powders.

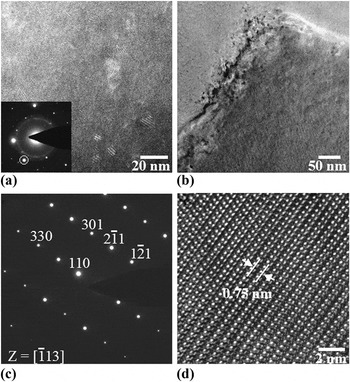
TEM analysis of the nanostructured SPS sample is shown in Fig. 9. Figure 9(a) shows the dark-field TEM image corresponding to the spot highlighted by a circle in the SAED pattern shown in the inset. In addition to the fine-grain region of Al12Mg17 with grains smaller than 25 nm, coarse grains with an average grain size around 500 nm are also observed [Fig 9(b)]. The SAED from this grain [Fig. 9(c)] indicates a single crystal grain of Al12Mg17 oriented to the [ ] zone axis. Figure 9(d) shows the atomic resolution TEM image of the Al12Mg17 grain with the characteristic {110} interplanar spacing of 0.75 nm.
TEM analysis of the SPS sample. (a) Dark-field TEM image from the spot highlighted by a circle in the SAED (inset) showing a fine grain distribution. (b) Bright-field TEM image showing a coarse-grain region. (c) SAED from the coarse grain shown in (b) indexed as Al12Mg17 oriented to the [ ] zone axis. (d) Atomic resolution TEM image of the Al12Mg17 grain.

The coarse-grain region observed by TEM analysis in the SPS sample has also been noticed in Al-based systemsReference Ye, Ajdelsztajn and Schoenung31, Reference Sasaki, Ohkubo and Hono36 and is mainly due to local heterogeneous grain growth during SPS consolidation. In the initial stages of SPS when the powders start to interact to each other, small surface contact areas in which the current density is highly localized are formed. As a result of this localized current density, the contact areas are heated up due to the Joule effect, which induces the grain growth in these localized regions.
The above results suggest a bimodal grain size distribution in the SPS sample as a consequence of the processing. Thus, there are basically fine-grain regions as a consequence of a severe plastic deformation induced by the cryomilling process, along with some coarse grains as a result of local heterogeneous grain growth during SPS. This bimodal grain size distribution is actually desirable to enhance the mechanical properties of the nanostructured bulk materials. For instance, an improvement in ductility has been lately reported and attributed to the occurrence of crack bridging and delamination between nanostructured and coarse-grained regions during plastic deformation.Reference Zehetbauer and Zhu37, Reference Han, Lee, Witkin, Nutt and Lavernia38
IV. CONCLUSIONS
We have demonstrated the novel synthesis of nanocrystalline Mg70Al30 alloy via cryomilling and SPS. The as-received and cryomilled powders and the consolidated SPS bulk material were characterized by SEM, TEM, XRD, and EDX techniques. TEM data, in good agreement with the XRD analysis, revealed nanocrystalline grains of the cryomilled powders with an average size of 25 nm. In the SPS consolidated Mg alloy, we found a bimodal grain size distribution with coarse grains around 500 nm and fine grains with an average grain size of 52 nm. Deformation twinning has been observed in nanocrystalline Mg-based powders, which can be activated by plastic deformation induced during cryomilling. The resultant reduced grain size presented in this work along with the presence of deformation twins in nanocrystalline grains could lead to unique mechanical properties of nanocrystalline Mg-based alloys. Our results indicate that cryomilling along with SPS is a successful processing route, which provides unprecedented opportunities for developing bulk nanostructured Mg-based alloys.
ACKNOWLEDGMENTS
The authors express their appreciation to the Army Research Office (ARO) for financial support of this work under the ARO Contract No. W911NF-09-1-0558. They are particularly grateful to the ARO program manager, Dr. Larry Russell. They are also grateful to the anonymous referees for their insightful remarks that helped to improve the scientific quality of the original manuscript.