1 Introduction
The sloshing of a liquid phase contained in a tank under the effect of an external force is a topic of high interest in many applications. Several disruptions can affect the stability of a satellite. They may originate from the space environment, as solar winds, magnetic fields or atmospheric residues. Furthermore, they may come from the satellite itself such as inertial reactions due to propulsion or internal mechanisms, construction defects, sloshing generated by flexible components (solar panel or antenna) or fluids inside the tank. It is well known (Lepilliez Reference Lepilliez2015) that the magnitude of fluid sloshing disruption is one of the most important of all those cited. Indeed, during its lifetime in space, a satellite will execute a wide range of operational manoeuvres, such as reorientation of an Earth observation device or solar panels. During these manoeuvres, inertial forces acting on propellant tanks will induce sloshing of a helium bubble formed inside these tanks after the latter gas was injected to maintain a sufficient pressure. By generating forces and torques on the structure, this bubble sloshing can deteriorate the quality of satellite imaging. Substantial efforts are undertaken to predict this unexpected phenomenon in order to propose technical solutions to decrease the amplitude of bubble sloshing in microgravity conditions. Several previous studies have been conducted to predict slosh behaviour inside a satellite tank, as in Abramson (Reference Abramson1967) and Dodge (Reference Dodge2000), where analytical models were proposed, respectively based on a one-dimensional mass–spring system or a pendulum system. The motion of the centre of mass was deduced from a second-order linear equation which gives the sloshing frequency, the damping ratio and allows calculation of the sloshing forces. These models provide a correct order of magnitude of the sloshing parameters for high values of Bond number (
 $Bo>10$
) and are currently used in the space industry, in particular for high thrust manoeuvres. However, they become inefficient for applications involving lower values of the Bond number where surface tension effects cannot be neglected, leading to nonlinear equations. Several theoretical studies have also been proposed recently (Faltinsen & Timokha Reference Faltinsen and Timokha2010; Faltinsen, Firoozkoohi & Timokha Reference Faltinsen, Firoozkoohi and Timokha2011; Ikeda et al.
Reference Ikeda, Ibrahim, Harata and Kuriyama2012; Faltinsen & Timokha Reference Faltinsen and Timokha2013) in configurations involving circular, spherical or rectangular tanks. Considering the complexity of these phenomena where a strongly perturbed interface can interact with a complex geometry in nonlinear regimes, numerical simulations, as the ones presented in Veldman et al. (Reference Veldman, Gerrits, Luppes, Helder and Vreeburg2007), Liu & Lin (Reference Liu and Lin2008), are complementary to theoretical studies in order to push back the limits of our knowledge in the field of sloshing. However, none of the previous studies have considered the bubble motion in a spherical tank subjected to an external force, as can occur during the manoeuvring of a satellite in microgravity conditions. Little experimental data exist on bubble sloshing in microgravity conditions, and significant advances are expected by using the direct numerical simulation to investigate the low Bond number regimes which are of great interest for satellite station keeping, rather than high thrust manoeuvres. Consequently, the present study is focused on configurations involving external forces which have the same order of magnitude or a smaller magnitude than the capillary forces, i.e. for a low Bond number varying between 0.05 and 5.
The objectives of this paper are as follows; (i) first, by providing accurate comparisons between well-resolved three-dimensional numerical simulations and microgravity conditions experiments, a strong validation of the overall numerical methodology is given in the considered configurations, (ii) secondly, depending on the dimensionless numbers, a detailed numerical study of the bubble motion is presented both in the first unsteady phase and in the steady phase of the manoeuvring, finally (iii) a numerical investigation on the steady bubble deformation depending on the centrifugal Bond number is detailed. As this parameter is of utmost importance for the design of satellites, our study also includes an analysis on the forces acting on the tank wall during the manoeuvre.
In § 2, the tank configuration in microgravity conditions is presented. The dimensionless analysis of the governing equations highlights the dominating effects coming from the inertial forces which are expressed with two Bond numbers. Some of the physical hypotheses we make are also justified in this section, such as the incompressibility of both phases and the perfectly wetting contact angle model. Section 3 details the formalism and the numerical methods we implement to model the fluids’ behaviour inside the tank. Then the validation of our numerical code with experimental data collected in the International Space Station is presented in § 4. The evolution of the centre of mass of the fluids inside the tank is investigated in § 5. After presenting a space convergence study and an example of bubble behaviour during a manoeuvre, the trajectory of the centre of mass of the fluid medium is analysed depending on the dimensionless parameters. A focus on the oscillation regime and on the equilibrium position of the centre of mass is presented. The forces acting on the solid frontier at the steady state are also investigated in this section. Finally, § 6 depicts the bubble shape evolution through time. The capillary wave and the first bounces of the bubble against the tank wall are studied and the equilibrium shape of the bubble is described.
2 Formalism and description of the tank modelling
We propose in this section, a description of the satellite tank configuration and the manoeuvres we enforce. The analysis of the dimensionless Navier–Stokes equations emphasises the dominating effects and physical assumptions are justified.
2.1 Dimensionless Navier–Stokes equations
Consider a domain
 $\unicode[STIX]{x1D6FA}=\unicode[STIX]{x1D6FA}_{f}\cup \unicode[STIX]{x1D6FA}_{s}$
with boundary
 $\unicode[STIX]{x2202}\unicode[STIX]{x1D6FA}$
. The regions
 $\unicode[STIX]{x1D6FA}_{f}$
and
 $\unicode[STIX]{x1D6FA}_{s}$
represent the fluid and solid regions, respectively. The boundary between the fluid and the solid, denoted by
 $\unicode[STIX]{x1D6E4}_{s}$
, is a sphere of diameter
 $D_{t}$
which symbolises the tank wall. The incompressible Navier–Stokes equations for Newtonian single-phase flows can be written
 $$\begin{eqnarray}\displaystyle & \displaystyle \unicode[STIX]{x1D735}\boldsymbol{\cdot }\boldsymbol{u}=0\quad \text{in }\unicode[STIX]{x1D6FA}_{f}, & \displaystyle\end{eqnarray}$$
 $$\begin{eqnarray}\displaystyle & \displaystyle \unicode[STIX]{x1D70C}\left(\frac{\unicode[STIX]{x2202}\boldsymbol{u}}{\unicode[STIX]{x2202}t}+(\boldsymbol{u}\boldsymbol{\cdot }\unicode[STIX]{x1D735})\boldsymbol{u}\right)=-\unicode[STIX]{x1D735}p+\unicode[STIX]{x1D735}\boldsymbol{\cdot }(2\unicode[STIX]{x1D707}\unicode[STIX]{x1D63F})+\boldsymbol{F}_{\boldsymbol{e}\boldsymbol{x}\boldsymbol{t}}\quad \text{in }\unicode[STIX]{x1D6FA}_{f}, & \displaystyle\end{eqnarray}$$
where
 $t$
is the time,
 $\unicode[STIX]{x1D70C}$
the fluid density,
 $\boldsymbol{u}=(u,v,w)$
the velocity field,
 $\unicode[STIX]{x1D707}$
the fluid viscosity,
 $p$
the pressure,
 $\boldsymbol{F}_{\boldsymbol{e}\boldsymbol{x}\boldsymbol{t}}$
the volume forces induced by the motion of the satellite and
 $\unicode[STIX]{x1D63F}$
is the rate-of-deformation tensor defined as
 $$\begin{eqnarray}\unicode[STIX]{x1D63F}=\frac{\unicode[STIX]{x1D735}\boldsymbol{u}+\unicode[STIX]{x1D735}\boldsymbol{u}^{T}}{2}.\end{eqnarray}$$
We now divide the fluid domain
 $\unicode[STIX]{x1D6FA}_{f}$
into two parts, a liquid and a gas region denoted by
 $\unicode[STIX]{x1D6FA}_{l}$
and
 $\unicode[STIX]{x1D6FA}_{g}$
, respectively. (We consider a liquid region and a gas region for the sake of presentation, but this work is equally applicable to two liquids.) The interface between the two fluids is called
 $\unicode[STIX]{x1D6E4}$
and
 $\boldsymbol{n}$
is its outward normal. Likewise,
 $\boldsymbol{n}_{s}$
corresponds to the outward normal of the solid’s boundary
 $\unicode[STIX]{x1D6E4}_{s}$
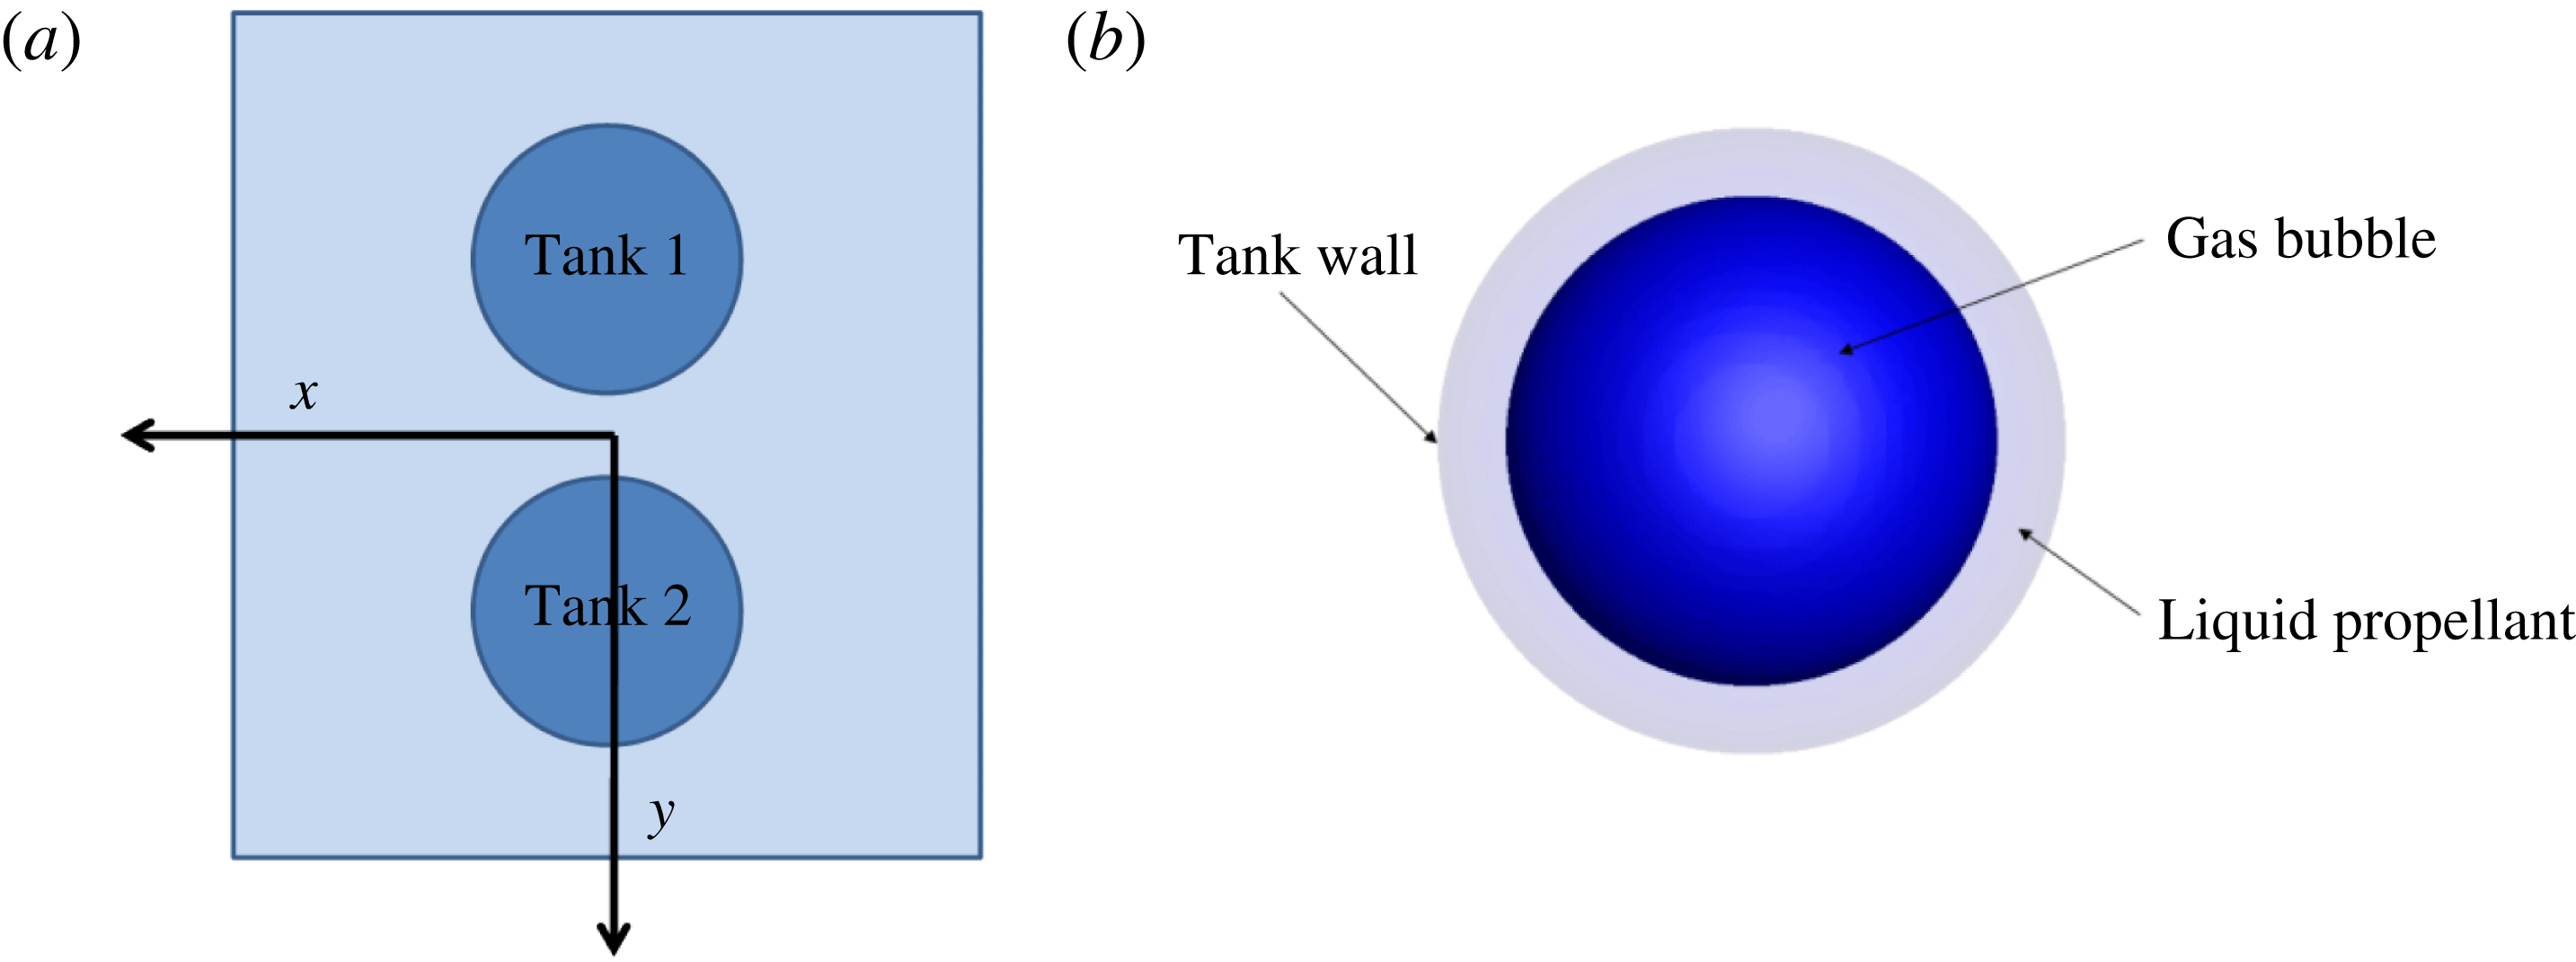
. Initially, the liquid–gas interface is a sphere, the liquid is in contact with the tank wall and the gas forms a spherical bubble of diameter
 $D_{0}$
in the centre (see figure 1). The density and viscosity fields are discontinuous at the interface and the effect of the surface tension
 $\unicode[STIX]{x1D70E}$
must be considered.
Typical positioning of tanks in a satellite and inside view of a tank.
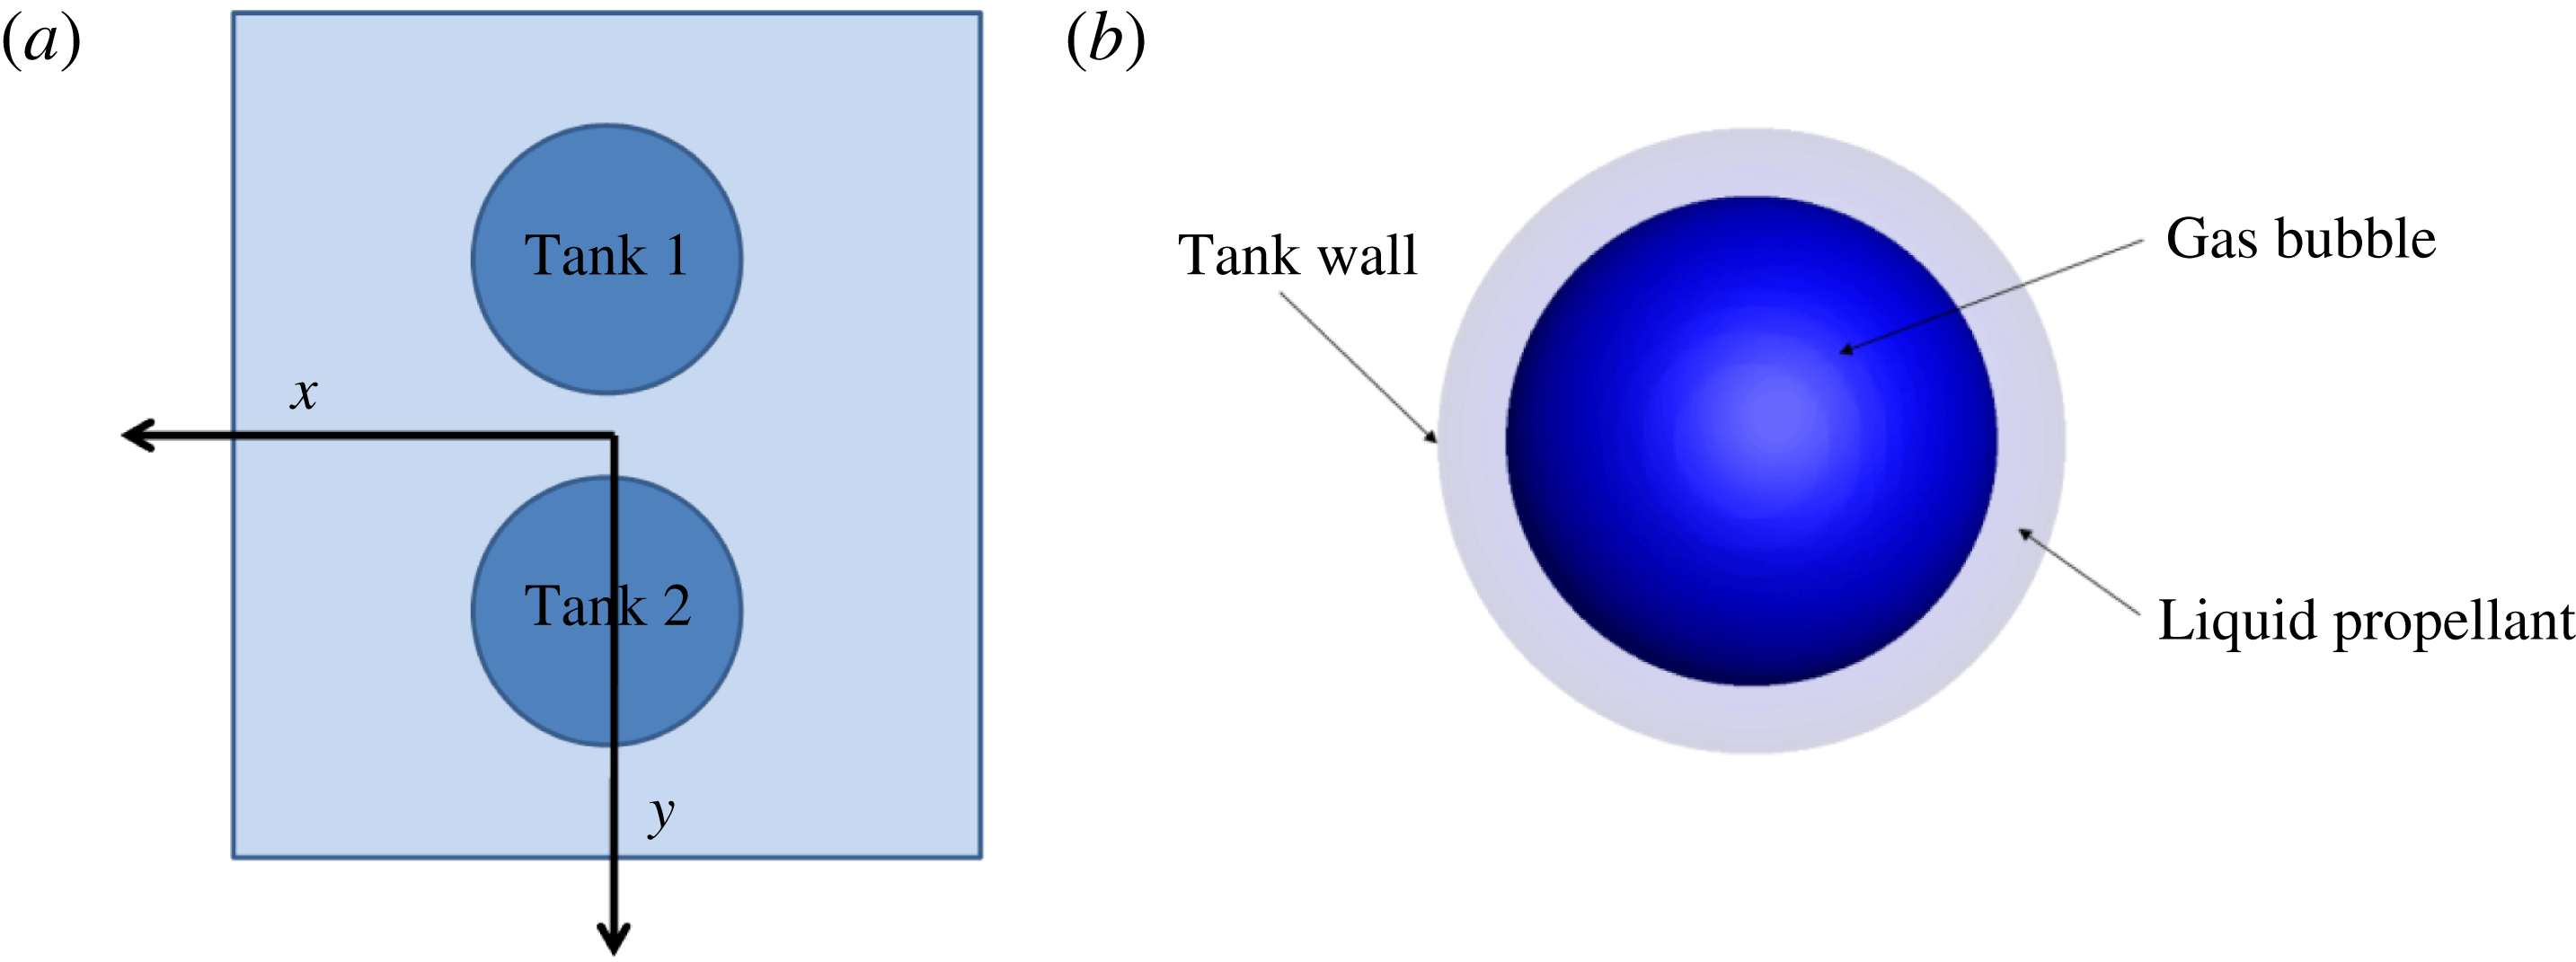
In order to understand the prominent physical effects involved in this configuration, we present here the expressions of the external forces acting in the Navier–Stokes equations (2.1) and (2.2). The equations are solved in the frame of the tank which is a non-Galilean referential when the satellite is rotating. Figure 1 shows that satellite tanks are usually not aligned with the rotation axis. As a consequence, external forces, induced by the rotation of the tank around the rotation axis, such as inertial and Coriolis effects (although the latter forces are weak in the configurations discussed in this study), are taken into account. The Coriolis acceleration
 $\boldsymbol{a}_{\mathbf{1}}$
is expressed as follows,
 $$\begin{eqnarray}\boldsymbol{a}_{\mathbf{1}}=2\unicode[STIX]{x1D734}\times \boldsymbol{u},\end{eqnarray}$$
where
 $\unicode[STIX]{x1D734}=\unicode[STIX]{x1D6FA}\boldsymbol{e}_{\boldsymbol{z}}$
is the angular velocity vector of the satellite. The inertial acceleration
 $\boldsymbol{a}_{\boldsymbol{c}\boldsymbol{e}}$
is the sum of the Euler acceleration
 $\boldsymbol{a}_{\mathbf{2}}$
, the centrifugal acceleration
 $\boldsymbol{a}_{\mathbf{3}}$
and the acceleration
 $\boldsymbol{a}_{\boldsymbol{R}}$
between the centre of mass of the satellite and the tank.
 $$\begin{eqnarray}\boldsymbol{a}_{\boldsymbol{c}\boldsymbol{e}}=\boldsymbol{a}_{\mathbf{2}}+\boldsymbol{a}_{\mathbf{3}}+\boldsymbol{a}_{\boldsymbol{R}}\quad \text{with }\boldsymbol{a}_{\mathbf{2}}=\dot{\unicode[STIX]{x1D734}}\times \boldsymbol{O}\boldsymbol{M}\quad \text{and}\quad \boldsymbol{a}_{\mathbf{3}}=\unicode[STIX]{x1D734}\times (\unicode[STIX]{x1D734}\times \boldsymbol{O}\boldsymbol{M}),\end{eqnarray}$$
where
 $\dot{\unicode[STIX]{x1D734}}=\dot{\unicode[STIX]{x1D6FA}}\boldsymbol{e}_{\boldsymbol{z}}$
the angular acceleration vector,
 $\boldsymbol{O}\boldsymbol{M}$
the position vector of the fluid particle, defined as
 $\boldsymbol{O}\boldsymbol{M}=x\boldsymbol{e}_{\boldsymbol{x}}+(L+y)\boldsymbol{e}_{\boldsymbol{y}}+z\boldsymbol{e}_{\boldsymbol{z}}$
with
 $L$
the lever arm (distance between the centre of the tank and the axis of rotation). As the tank is fixed to the satellite,
 $\boldsymbol{a}_{\boldsymbol{R}}$
is null. After defining the forces induced by the change of referential, we give now the expression of the Navier–Stokes equations in the frame of a rotating tank,
 $$\begin{eqnarray}\displaystyle & \displaystyle \unicode[STIX]{x1D735}\boldsymbol{\cdot }\boldsymbol{u}=0, & \displaystyle\end{eqnarray}$$
 $$\begin{eqnarray}\displaystyle & \displaystyle \unicode[STIX]{x1D70C}\left(\frac{\unicode[STIX]{x2202}\boldsymbol{u}}{\unicode[STIX]{x2202}t}+(\boldsymbol{u}\boldsymbol{\cdot }\unicode[STIX]{x1D735})\boldsymbol{u}\right)=-\unicode[STIX]{x1D735}p+\unicode[STIX]{x1D735}\boldsymbol{\cdot }(2\unicode[STIX]{x1D707}\unicode[STIX]{x1D63F})+\unicode[STIX]{x1D70C}(\boldsymbol{a}_{\mathbf{1}}+\boldsymbol{a}_{\boldsymbol{c}\boldsymbol{e}}). & \displaystyle\end{eqnarray}$$
To define dimensionless Navier–Stokes equations in our configuration, the latter two expressions can be specified with the dimensionless variables,
 $$\begin{eqnarray}\unicode[STIX]{x1D70C}^{\ast }=\frac{\unicode[STIX]{x1D70C}}{\unicode[STIX]{x1D70C}_{l}},\quad \unicode[STIX]{x1D707}^{\ast }=\frac{\unicode[STIX]{x1D707}}{\unicode[STIX]{x1D707}_{l}},\quad p^{\ast }=\frac{pD_{0}}{\unicode[STIX]{x1D70E}},\quad \boldsymbol{u}^{\ast }=\boldsymbol{u}\sqrt{\frac{\unicode[STIX]{x1D70C}_{l}D_{0}}{\unicode[STIX]{x1D70E}}},\quad t^{\ast }=t\sqrt{\frac{\unicode[STIX]{x1D70E}}{\unicode[STIX]{x1D70C}_{l}D_{0}^{3}}},\end{eqnarray}$$
 $$\begin{eqnarray}\unicode[STIX]{x1D735}^{\ast }=D_{0}\unicode[STIX]{x1D735},\quad \boldsymbol{a}_{\mathbf{1}}^{\ast }=\frac{\boldsymbol{a}_{\mathbf{1}}}{\unicode[STIX]{x1D6FE}},\quad \boldsymbol{a}_{\mathbf{2}}^{\ast }=\frac{\boldsymbol{a}_{\mathbf{2}}}{\unicode[STIX]{x1D6FE}_{a}},\quad \boldsymbol{a}_{\mathbf{3}}^{\ast }=\frac{\boldsymbol{a}_{\mathbf{3}}}{\unicode[STIX]{x1D6FE}},\end{eqnarray}$$
with
 $\unicode[STIX]{x1D6FE}$
and
 $\unicode[STIX]{x1D6FE}_{a}$
characteristic accelerations of the flow that are defined below. Then the Navier–Stokes equations become
 $$\begin{eqnarray}\displaystyle & \displaystyle \unicode[STIX]{x1D735}^{\ast }\boldsymbol{\cdot }\boldsymbol{u}^{\ast }=0, & \displaystyle\end{eqnarray}$$
 $$\begin{eqnarray}\displaystyle & \displaystyle \unicode[STIX]{x1D70C}^{\ast }\left(\frac{\unicode[STIX]{x2202}\boldsymbol{u}^{\ast }}{\unicode[STIX]{x2202}t^{\ast }}+(\boldsymbol{u}^{\ast }\boldsymbol{\cdot }\unicode[STIX]{x1D735}^{\ast })\boldsymbol{u}^{\ast }\right)=-\unicode[STIX]{x1D735}^{\ast }p^{\ast }+Oh\unicode[STIX]{x1D735}^{\ast }\boldsymbol{\cdot }(2\unicode[STIX]{x1D707}^{\ast }\unicode[STIX]{x1D63F}^{\ast })+Bo_{i}\unicode[STIX]{x1D70C}^{\ast }\boldsymbol{a}_{\mathbf{2}}^{\ast }+Bo_{c}\unicode[STIX]{x1D70C}^{\ast }(\boldsymbol{a}_{\mathbf{1}}^{\ast }+\boldsymbol{a}_{\mathbf{3}}^{\ast }), & \displaystyle \nonumber\\ \displaystyle & & \displaystyle\end{eqnarray}$$
with
 $Oh$
the Ohnesorge number and two Bond numbers, defined as
 $$\begin{eqnarray}Oh=\left(\frac{\unicode[STIX]{x1D707}_{l}^{2}}{\unicode[STIX]{x1D70C}_{l}\unicode[STIX]{x1D70E}D_{0}}\right)^{1/2},\quad Bo_{c}=\frac{\unicode[STIX]{x1D70C}_{l}\unicode[STIX]{x1D6FE}D_{0}^{2}}{\unicode[STIX]{x1D70E}},\quad Bo_{i}=\frac{\unicode[STIX]{x1D70C}_{l}\unicode[STIX]{x1D6FE}_{a}D_{0}^{2}}{\unicode[STIX]{x1D70E}}.\end{eqnarray}$$
The Bond numbers compare the inertial effects induced by the satellite motion to surface tension effects, and the Ohnesorge number compares viscosity to surface tension effects. The two different accelerations,
 $\unicode[STIX]{x1D6FE}$
and
 $\unicode[STIX]{x1D6FE}_{a}$
, are respectively based on the angular velocity
 $\unicode[STIX]{x1D6FA}$
, such as
 $\unicode[STIX]{x1D6FE}=\unicode[STIX]{x1D6FA}^{2}L$
, and the angular acceleration
 $\unicode[STIX]{x1D6FE}_{a}=\dot{\unicode[STIX]{x1D6FA}}L$
. As a result, the following two Bond numbers can be defined to characterise our physical system,
 $$\begin{eqnarray}Bo_{c}=\frac{\unicode[STIX]{x1D70C}_{l}\unicode[STIX]{x1D6FA}^{2}LD_{0}^{2}}{\unicode[STIX]{x1D70E}},\quad Bo_{i}=\frac{\unicode[STIX]{x1D70C}_{l}\dot{\unicode[STIX]{x1D6FA}}LD_{0}^{2}}{\unicode[STIX]{x1D70E}},\end{eqnarray}$$
where
 $Bo_{c}$
is the Bond number related to the angular velocity responsible of centrifugal forces, and
 $Bo_{i}$
the Bond number depending on the angular acceleration.
2.2 Description of the tank and the manoeuvres
The spherical tank has a diameter of
 $D_{t}=0.585~\text{m}$
and is not aligned with the rotation axis of the satellite. The lever arm, for which the value is
 $L=0.4~\text{m}$
, is the distance between the centre of the tank and the axis of rotation. The properties of the fluids included in the tank (close to the actual properties of fluids used in space applications) are
 $\unicode[STIX]{x1D70C}_{l}=1004~\text{kg}~\text{m}^{-3}$
,
 $\unicode[STIX]{x1D707}_{l}=9.13\times 10^{-4}~\text{kg}~\text{m}^{-1}~\text{s}^{-1}$
for the liquid phase, and
 $\unicode[STIX]{x1D70C}_{g}=2.41~\text{kg}~\text{m}^{-3}$
,
 $\unicode[STIX]{x1D707}_{g}=1.99\times 10^{-5}~\text{kg}~\text{m}^{-1}~\text{s}^{-1}$
for the gas phase. The surface tension is equal to
 $\unicode[STIX]{x1D70E}=0.03325~\text{N}~\text{m}^{-1}$
. The bubble is initially located at the centre of the tank. As the wall of the tank is perfectly wet, the static contact angle is set to
 $\unicode[STIX]{x1D703}_{s}=0^{\circ }$
, preventing the formation of a contact line on the solid frontier. This assumption is justified in § 2.3.
The manoeuvres consist in a rotation of the satellite around its vertical axis
 $\boldsymbol{e}_{\boldsymbol{z}}$
. They can be split in two steps, first a constant acceleration phase,
 $\dot{\unicode[STIX]{x1D6FA}}=Cste\neq 0$
and
 $\unicode[STIX]{x1D6FA}(t)=\dot{\unicode[STIX]{x1D6FA}}t$
until the final angular velocity
 $\unicode[STIX]{x1D6FA}$
is reached. In the second step, the angular acceleration is stopped
 $\dot{\unicode[STIX]{x1D6FA}}=0$
, and the final angular velocity is maintained to its final value
 $\unicode[STIX]{x1D6FA}$
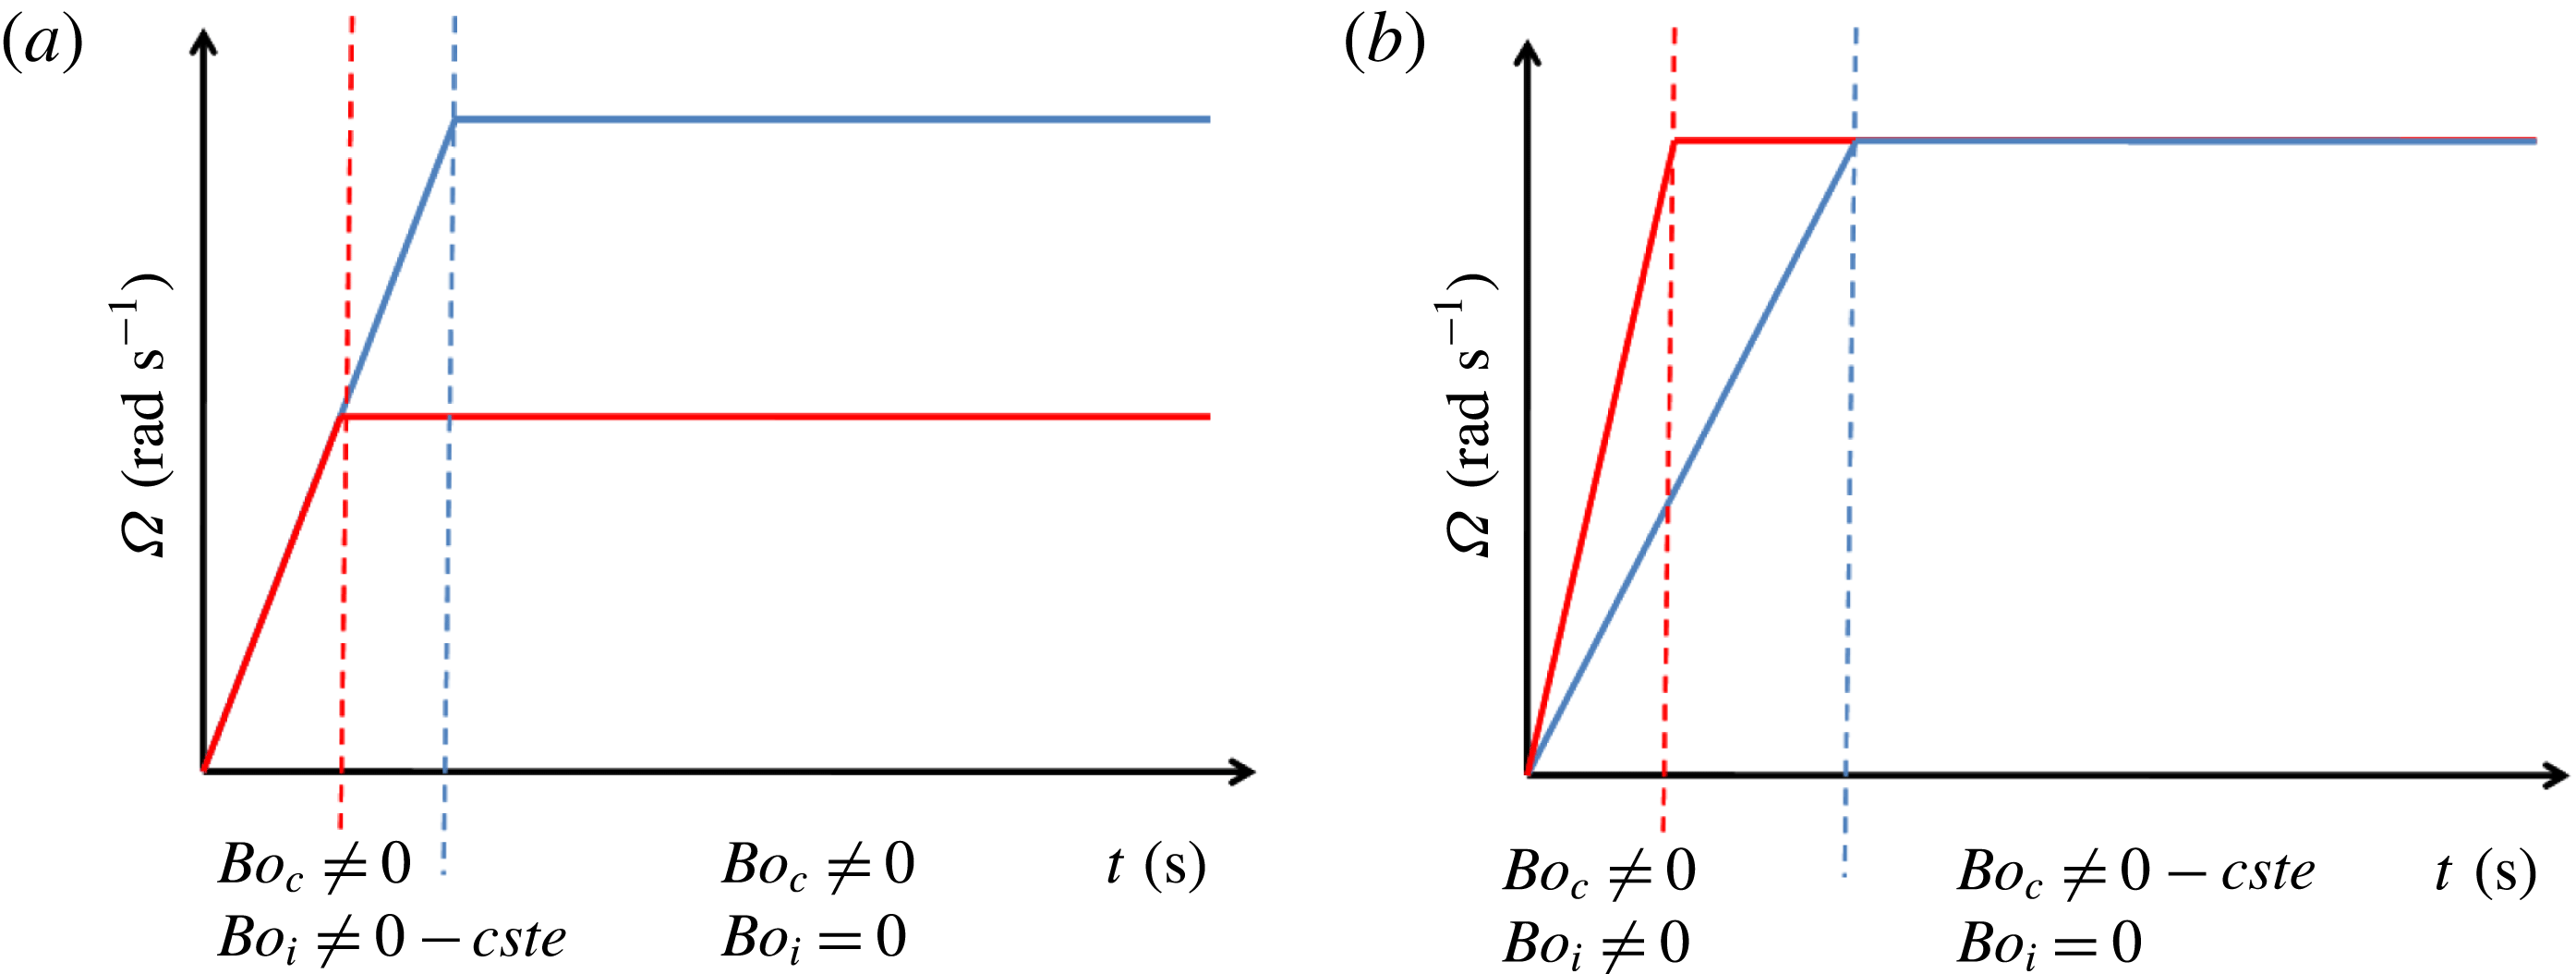
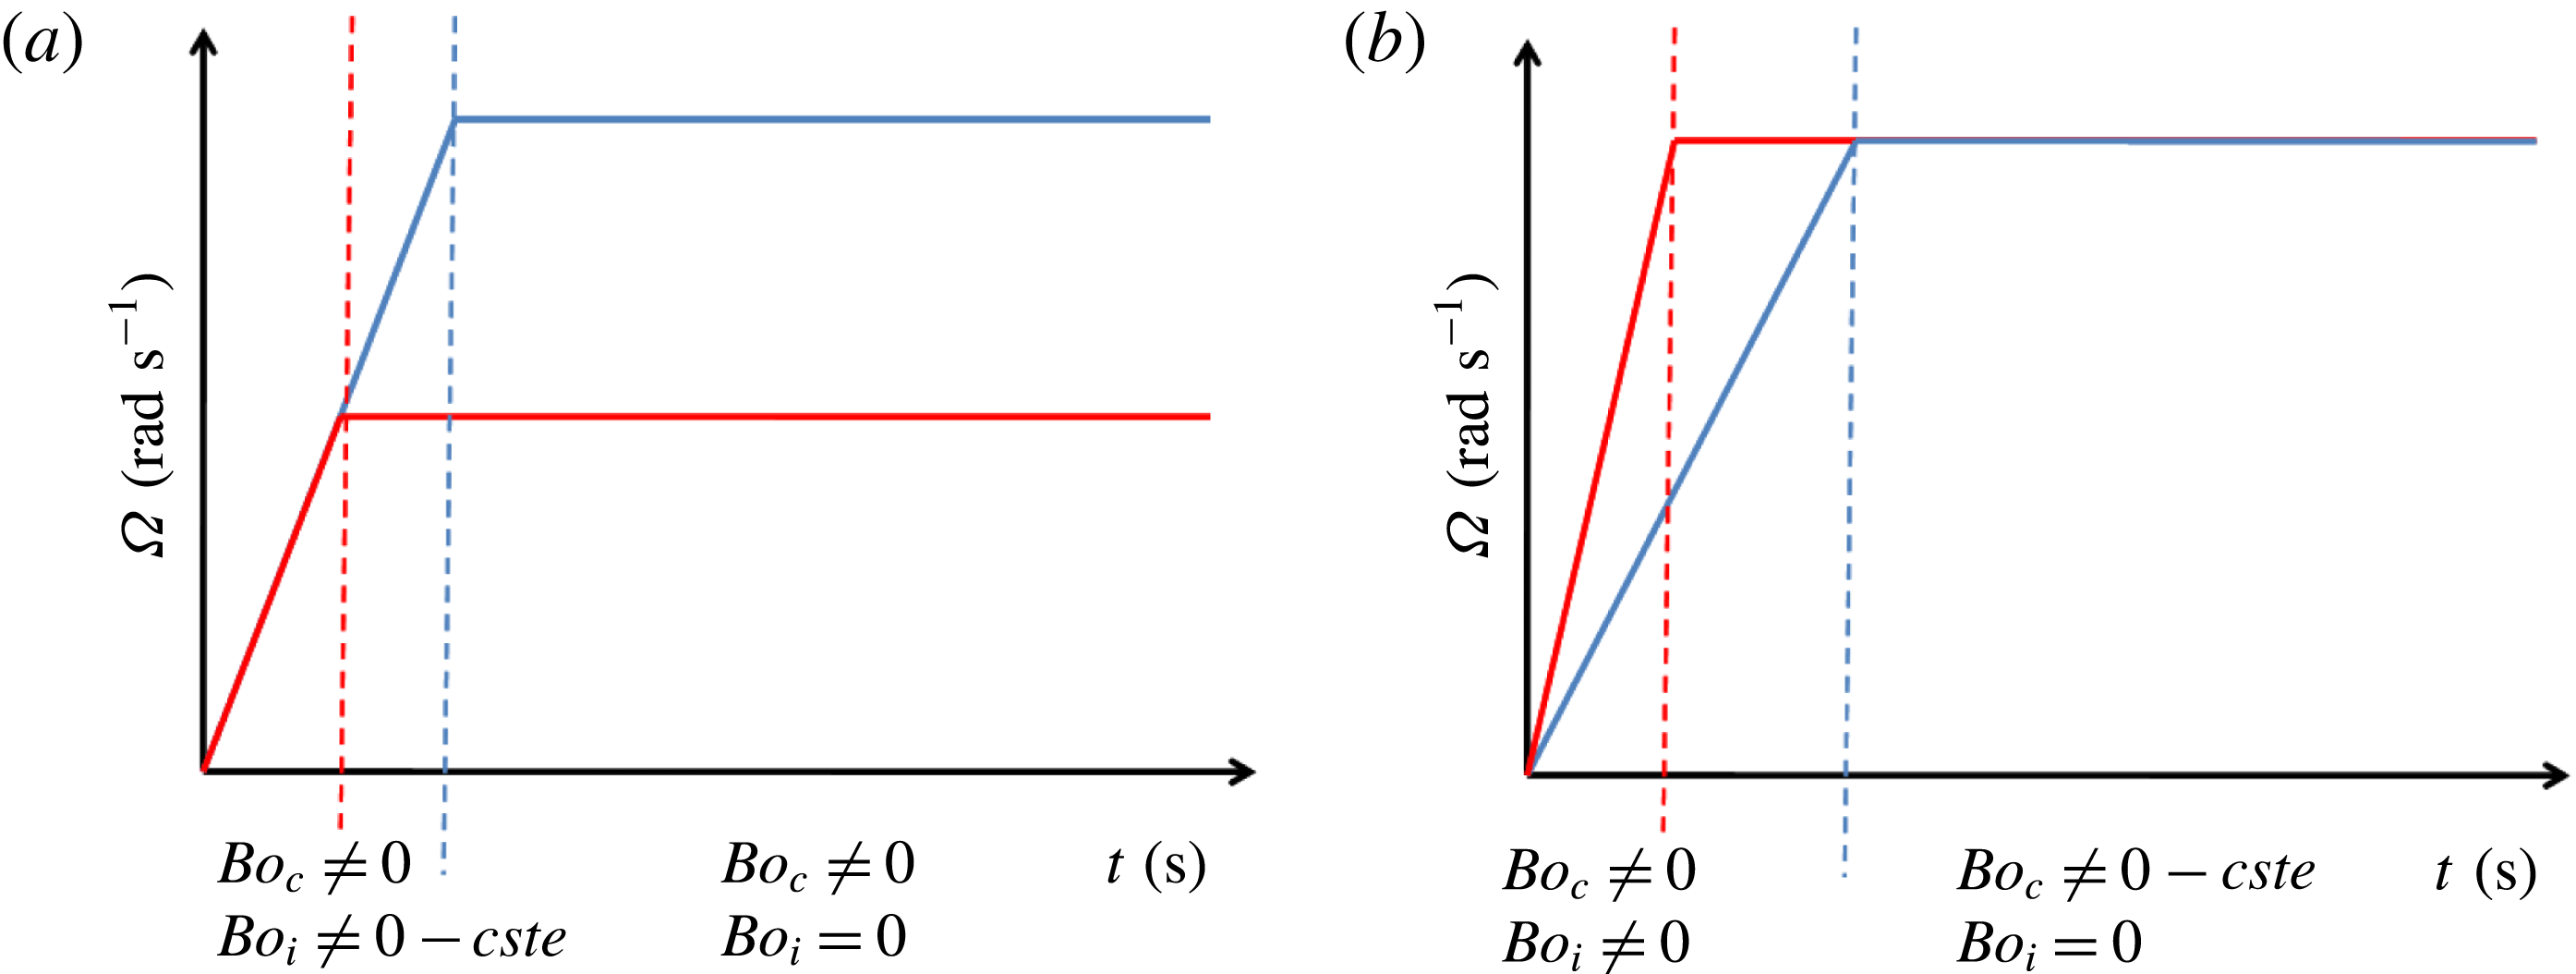
. These angular acceleration and final velocity are respectively related to the impulsional and centrifugal Bond numbers defined in (2.13). Figure 2 illustrates the evolution of
 $Bo_{c}$
and
 $Bo_{i}$
throughout the manoeuvre. The figure on the left presents two configurations with the same
 $Bo_{i}$
to reach different values of the final
 $Bo_{c}$
, whereas the figure on the right shows two different
 $Bo_{i}$
to obtain the same
 $Bo_{c}$
in the final step of the manoeuvre.
Examples of different velocity profiles, with the evolution of
 $\unicode[STIX]{x1D6FA}$
throughout the manoeuvre.
Inertial parameters used for this study for
 $\unicode[STIX]{x1D70F}_{fill}=50\,\%$
:
 $Bo_{i}$
and
 $\dot{\unicode[STIX]{x1D6FA}}$
.

Inertial parameters used for this study for
 $\unicode[STIX]{x1D70F}_{fill}=50\,\%$
:
 $Bo_{c}$
and
 $\unicode[STIX]{x1D6FA}$
.

The range of the Bond numbers are described in tables 1 and 2 in the case of a half-filled tank. The corresponding angular accelerations and velocities are low values, which correspond to low inertial manoeuvres.
2.3 Assumptions of the physical model
In this section, we justify two important assumptions that have been made in our physical model, i.e. the fluids’ incompressibility and the zero contact angle condition. First, the effect of gas compressibility is investigated through the Mach number. We define two characteristic velocities
 $v_{1}$
and
 $v_{2}$
which depend on the angular velocity
 $\unicode[STIX]{x1D6FA}$
and the angular acceleration
 $\dot{\unicode[STIX]{x1D6FA}}$
imposed during the manoeuvre of the tank,
 $$\begin{eqnarray}v_{1}=\unicode[STIX]{x1D6FA}L\quad \text{and}\quad v_{2}=\sqrt{\dot{\unicode[STIX]{x1D6FA}}}L.\end{eqnarray}$$
Considering helium gas, the velocity of sound
 $c_{he}$
is computed using the ideal gas law
 $c_{he}=\sqrt{\unicode[STIX]{x1D6FE}RT/M}$
with
 $\unicode[STIX]{x1D6FE}=1.4$
the adiabatic index,
 $R=8.31~\text{J}~\text{mol}^{-1}~\text{K}^{-1}$
the molar gas constant,
 $M=4~\text{g}~\text{mol}^{-1}$
the molar mass of the helium and
 $T\approx 300~\text{K}$
the absolute temperature. Finally, the following two Mach numbers can be considered
 $$\begin{eqnarray}\displaystyle & \displaystyle Ma_{1}=\frac{v_{1}}{c_{he}}=\unicode[STIX]{x1D6FA}L\sqrt{\frac{M}{\unicode[STIX]{x1D6FE}RT}}, & \displaystyle\end{eqnarray}$$
 $$\begin{eqnarray}\displaystyle & \displaystyle Ma_{2}=\frac{v_{2}}{c_{he}}=L\sqrt{\frac{\dot{\unicode[STIX]{x1D6FA}}M}{\unicode[STIX]{x1D6FE}RT}}. & \displaystyle\end{eqnarray}$$
Given the inertial parameters of tables 1 and 2, the Mach numbers always respect
 $Ma_{1}<2.2\times 10^{-5}$
and
 $Ma_{2}<2.2\times 10^{-5}$
. Therefore, we neglect the gas compressibility and consider the incompressible Navier–Stokes equations in the fluid phase.
We introduce now a discussion on the no contact angle assumption which is made in our simulations. A contact angle between a solid and a liquid–gas interface results from a force balance between the surface tension forces between the liquid–gas, liquid–solid and the solid–gas interfaces. If the surface tension characterising the solid–fluid interactions is not always well known (Langbein Reference Langbein2002), indirect measurements of the difference between these two surface tension coefficients can be obtained by measuring the contact angle of a bubble or a droplet on a substrate.
As usual propellants are perfectly wetting fluids, we impose in our simulations a perfectly wetting condition, i.e. the contact angle is set equal to zero, when the liquid–gas interface will be close to the tank wall. This condition prevents the formation of a contact line at the frontier between the liquid, the gas and the solid phase. As a result a thin liquid film is still entrapped between the solid wall and the liquid–gas interface. Consequently, there is no hydrodynamical singularity on the viscous dissipation in this specific configuration since there is no contact line, and thus no contact line velocity. This no contact line assumption seems reasonable within the limits of low Bond numbers which is consistent with the present study. Indeed, it is clear that even if a perfectly wetting fluid is considered, in high Bond number configurations, the thin liquid film can be disrupted by strong external forces, such as gravity in ground applications. However, to the best of our knowledge, the critical Bond number for which the liquid film disruption will be observed is not known. In fact, an indirect validation of the no contact line assumption is presented in the rest of the paper by comparing our numerical simulations with experimental results from fluidics experiments both on the force acting on the tank wall and more specifically on the torque exerted by the fluid motion on the tank.
Finally, it should be noticed here that an apparent contact angle can also result from boiling phenomena, even if perfectly wetting fluids are involved, see for instance Stephan & Busse (Reference Stephan and Busse1992), Huber et al. (Reference Huber, Tanguy, Sagan and Colin2017), Urbano et al. (Reference Urbano, Tanguy, Huber and Colin2018) for more details. However as we consider here isothermal conditions, this physical effect is not relevant in the present study.
3 Numerical methods
Our numerical simulations have been performed by using the home-made code DIVA (dynamics of interface for vaporisation and atomisation) which is based on a wide range of numerical methods specifically dedicated to the computation of two-phase flows. In particular, the level set method (Sussman, Smereka & Osher Reference Sussman, Smereka and Osher1994) and the ghost fluid method (Fedkiw et al. Reference Fedkiw, Aslam, Merriman and Osher1999; Kang, Fedkiw & Liu Reference Kang, Fedkiw and Liu2000; Liu, Fedkiw & Kang Reference Liu, Fedkiw and Kang2000; Sussman et al. Reference Sussman, Smith, Hussaini, Ohta and Zhi-Wei2007) are used jointly to ensure a sharp and accurate representation of the liquid–gas interface. Computations in complex geometry can be performed by using the numerical scheme proposed in Ng, Min & Gibou (Reference Ng, Min and Gibou2009) for single-phase flows and for which an extension to two-phase flows is proposed in Lepilliez et al. (Reference Lepilliez, Popescu, Gibou and Tanguy2016). This numerical scheme is based on a second-order numerical scheme to impose the Neumann boundary condition on the pressure field at the solid frontier while maintaining a sharp representation of the solid–fluid interface. Our numerical tool also allows computations of liquid–vapour phase change following the numerical methods described in Gibou et al. (Reference Gibou, Fedkiw, Cheng and Kang2002, Reference Gibou, Cheng, Nguyen and Banerjee2007), Tanguy, Menard & Berlemont (Reference Tanguy, Menard and Berlemont2007), Papac, Gibou & Ratsch (Reference Papac, Gibou and Ratsch2010), Tanguy et al. (Reference Tanguy, Sagan, Lalanne, Couderc and Colin2014), Rueda Villegas et al. (Reference Rueda Villegas, Alis, Lepilliez and Tanguy2016) and interaction of acoustic waves with bubbles (Huber et al. Reference Huber, Tanguy, Bera and Gilles2015). It has been validated by direct comparisons with a wide range of theoretical studies (Tanguy et al. Reference Tanguy, Sagan, Lalanne, Couderc and Colin2014; Huber et al. Reference Huber, Tanguy, Bera and Gilles2015; Lalanne et al. Reference Lalanne, Villegas, Tanguy and Risso2015b ; Rueda Villegas et al. Reference Rueda Villegas, Alis, Lepilliez and Tanguy2016) and experimental data (Tanguy & Berlemont Reference Tanguy and Berlemont2005; Lalanne et al. Reference Lalanne, Chebel, Vejrazka, Tanguy, Masbernat and Risso2015a ; Huber et al. Reference Huber, Tanguy, Sagan and Colin2017; Rueda Villegas et al. Reference Rueda Villegas, Tanguy, Castanet, Caballina and Lemoine2017) both for isothermal two-phase flows and configurations involving liquid–vapour phase change. This section describe briefly the formalism and the numerical methods used to perform multiphase flows simulations by solving the Navier–Stokes equations, and imposing the suitable boundary conditions on the solid frontier when an irregular domain is involved.
3.1 Interface tracking method
In this work, the level set method of Osher & Sethian (Reference Osher and Sethian1988) and Sussman et al. (Reference Sussman, Smereka and Osher1994) is used, both to capture the interface motion between the two fluids and to impose the static boundary condition between the fluids and the solid. Signed and continuous level set functions
 $\unicode[STIX]{x1D719}$
and
 $\unicode[STIX]{x1D719}_{s}$
are defined in the domain
 $\unicode[STIX]{x1D6FA}$
respectively such as
 $\unicode[STIX]{x1D6FA}_{g}=\{\boldsymbol{x}:\unicode[STIX]{x1D719}(\boldsymbol{x})<0\}$
,
 $\unicode[STIX]{x1D6FA}_{l}=\{\boldsymbol{x}:\unicode[STIX]{x1D719}(\boldsymbol{x})>0\}$
and
 $\unicode[STIX]{x1D6E4}=\{\boldsymbol{x}:\unicode[STIX]{x1D719}(\boldsymbol{x})=0\}$
where
 $\unicode[STIX]{x1D6E4}$
represents the fluid–fluid interface and
 $\unicode[STIX]{x1D6FA}_{s}=\{\boldsymbol{x}:\unicode[STIX]{x1D719}_{s}(\boldsymbol{x})>0\}$
,
 $\unicode[STIX]{x1D6FA}_{f}=\{\boldsymbol{x}:\unicode[STIX]{x1D719}_{s}(\boldsymbol{x})<0\}$
and
 $\unicode[STIX]{x1D6E4}_{s}=\{\boldsymbol{x}:\unicode[STIX]{x1D719}_{s}(\boldsymbol{x})=0\}$
, the fluid–solid interface. The fluid–solid interface does not move because the simulation is done in the referential of the tank. The motion of the liquid–gas interface
 $\unicode[STIX]{x1D6E4}$
is captured by solving the following transport equation
 $$\begin{eqnarray}\frac{\unicode[STIX]{x2202}\unicode[STIX]{x1D719}}{\unicode[STIX]{x2202}t}+\boldsymbol{u}\boldsymbol{\cdot }\unicode[STIX]{x1D735}\unicode[STIX]{x1D719}=0.\end{eqnarray}$$
The level set method benefits from attractive regularity properties in the whole domain that allow a simple, stable and efficient computation of the interface curvature. In particular, the signed distance function property can be imposed at the initial step of the computation and maintained all along the temporal integration process by applying the reinitialisation algorithm proposed in Sussman et al. (Reference Sussman, Smereka and Osher1994) at the end of every physical time step. It consists in solving the following partial differential equation over a fictitious time
 $\unicode[STIX]{x1D70F}$
,
 $$\begin{eqnarray}\frac{\unicode[STIX]{x2202}\text{d}}{\unicode[STIX]{x2202}\unicode[STIX]{x1D70F}}+\text{sign}(\unicode[STIX]{x1D719})(1-\Vert \unicode[STIX]{x1D735}d\Vert )=0.\end{eqnarray}$$
Next, geometrical properties such as
 $\boldsymbol{n}$
the outward unit normal vector to the interface and
 $\unicode[STIX]{x1D705}$
the local mean curvature can be computed by a simple differencing of the level set function
 $\unicode[STIX]{x1D719}$
. Spatial derivatives in the transport equation and the reinitialisation equation are computed with the weighted essentially non-oscillatory scheme (Borges et al.
Reference Borges, Carmona, Costa and Don2008), and the temporal derivatives with a third-order total variation diminishing Runge–Kutta scheme. Inside the solid domain, the following boundary condition is imposed on the level set function,
 $$\begin{eqnarray}\boldsymbol{n}_{\boldsymbol{s}}\boldsymbol{\cdot }\unicode[STIX]{x1D735}\unicode[STIX]{x1D719}|_{\unicode[STIX]{x1D6E4}}=\cos \unicode[STIX]{x1D703}_{s},\end{eqnarray}$$
where
 $\unicode[STIX]{x1D703}_{s}$
is the contact angle formed on the triple line between the liquid, the gas and the solid. Let us note here that
 $\unicode[STIX]{x1D703}_{s}=0^{\circ }$
and thus, the right-hand side is equal to
 $1$
. Based on the previous works of Fedkiw et al. (Reference Fedkiw, Aslam, Merriman and Osher1999), this boundary condition can be imposed by extending the level set function
 $\unicode[STIX]{x1D719}$
inside the solid domain, following the approach proposed in Lepilliez et al. (Reference Lepilliez, Popescu, Gibou and Tanguy2016).
The motion of the liquid–gas interface occurs at the beginning of each time step and allows us to update the viscosity and density fields
 $\{\unicode[STIX]{x1D707}^{n+1};\unicode[STIX]{x1D70C}^{n+1}\}$
. They can be expressed with the following expressions
 $$\begin{eqnarray}\displaystyle & \displaystyle \unicode[STIX]{x1D70C}(\unicode[STIX]{x1D719})=\unicode[STIX]{x1D70C}_{l}\left(\frac{\unicode[STIX]{x1D70C}_{g}}{\unicode[STIX]{x1D70C}_{l}}+\left(1-\frac{\unicode[STIX]{x1D70C}_{g}}{\unicode[STIX]{x1D70C}_{l}}\right)H(\unicode[STIX]{x1D719})\right), & \displaystyle\end{eqnarray}$$
 $$\begin{eqnarray}\displaystyle & \displaystyle \unicode[STIX]{x1D707}(\unicode[STIX]{x1D719})=\unicode[STIX]{x1D707}_{l}\left(\frac{\unicode[STIX]{x1D707}_{g}}{\unicode[STIX]{x1D707}_{l}}+\left(1-\frac{\unicode[STIX]{x1D707}_{g}}{\unicode[STIX]{x1D707}_{l}}\right)H(\unicode[STIX]{x1D719})\right), & \displaystyle\end{eqnarray}$$
where
 $H(\unicode[STIX]{x1D719})$
is the Heaviside function, defined as
 $H(\unicode[STIX]{x1D719})=0$
in the gas and
 $H(\unicode[STIX]{x1D719})=1$
in the liquid. For cells crossed by the interface, a sharp interpolation of the density and the viscosity is used following the general guidelines proposed in Liu et al. (Reference Liu, Fedkiw and Kang2000) and Sussman et al. (Reference Sussman, Smith, Hussaini, Ohta and Zhi-Wei2007).
3.2 Projection method
The incompressible Navier–Stokes equations for Newtonian two-phase flows can be described in different ways, whether the jump conditions between the two fluids are imposed as smoothed singular functions, or as sharp jump conditions locally applied to the density, viscosity and pressure field. In what follows, we briefly present one of the formulations for two-phase flows, adapted from the projection method of Chorin (Reference Chorin1967) and first introduced by Sussman et al. (Reference Sussman, Smith, Hussaini, Ohta and Zhi-Wei2007). Some other formulations are thoroughly detailed and compared by Lepilliez (Reference Lepilliez2015) and Lalanne et al. (Reference Lalanne, Villegas, Tanguy and Risso2015b
). The authors demonstrate that the following formulation is best suited for our study. The implicit temporal discretisation, referred to as the ghost fluid conservative method with an implicit scheme (GFCMI) in Lepilliez (Reference Lepilliez2015) is used in this study. First, given a velocity
 $\boldsymbol{u}^{n}$
at time
 $t^{n}=n\unicode[STIX]{x0394}t$
, an auxiliary field
 $\boldsymbol{u}^{\ast }$
can be computed for a time step
 $\unicode[STIX]{x0394}t$
without considering the pressure component
 $$\begin{eqnarray}\unicode[STIX]{x1D70C}^{n+1}\boldsymbol{u}^{\ast }-\unicode[STIX]{x0394}t\unicode[STIX]{x1D735}\boldsymbol{\cdot }(2\unicode[STIX]{x1D707}^{n+1}\unicode[STIX]{x1D63F}^{\ast })=\unicode[STIX]{x1D70C}^{n+1}\left(\boldsymbol{u}^{n}-\unicode[STIX]{x0394}t\left((\boldsymbol{u}^{n}\boldsymbol{\cdot }\unicode[STIX]{x1D735})\boldsymbol{u}^{n}-\frac{\boldsymbol{F}_{\boldsymbol{e}\boldsymbol{x}\boldsymbol{t}}}{\unicode[STIX]{x1D70C}^{n+1}}\right)\right),\end{eqnarray}$$
which leads to a large linear system where the three velocity components are coupled. As it is a diagonally dominant linear system, it can be simply and quickly solved (approximately 10 iterations or less in most configurations) by using a Gauss–Seidel algorithm.
Then the pressure field
 $p^{n+1}$
serves as the scalar potential function of the Hodge decomposition, satisfying a Poisson equation with homogeneous Neumann boundary conditions on
 $\unicode[STIX]{x2202}\unicode[STIX]{x1D6FA}$
and non-homogeneous Neumann boundary condition on
 $\unicode[STIX]{x1D6E4}_{s}$
 $$\begin{eqnarray}\unicode[STIX]{x1D735}\boldsymbol{\cdot }\left(\frac{\unicode[STIX]{x1D735}p^{n+1}}{\unicode[STIX]{x1D70C}^{n+1}}\right)=\frac{\unicode[STIX]{x1D735}\boldsymbol{\cdot }\boldsymbol{u}^{\ast }}{\unicode[STIX]{x0394}t}+\unicode[STIX]{x1D735}\boldsymbol{\cdot }\left(\frac{\unicode[STIX]{x1D70E}\unicode[STIX]{x1D705}\boldsymbol{n}\unicode[STIX]{x1D6FF}_{\unicode[STIX]{x1D6E4}}}{\unicode[STIX]{x1D70C}^{n+1}}\right),\end{eqnarray}$$
where
 $\unicode[STIX]{x1D705}$
and
 $\unicode[STIX]{x1D6FF}_{\unicode[STIX]{x1D6E4}}$
are respectively the local curvature of the interface and a multidimensional Dirac distribution located at the interface. It is well known that the resolution of the Poisson equation is the most expensive step in numerical simulations of two-phase flows. Consequently, to speed up our simulations, we have implemented the black box multigrid method from Dendy (Reference Dendy1982) and MacLachlan, Tang & Vuik (Reference MacLachlan, Tang and Vuik2008) which allows a fast resolution of pseudo-Poisson equations that contain irregular terms either in the matrix coefficients (density jump) or on the right-hand side (pressure jump) of the linear system. These singular source terms are approximated using the general schemes developed in Liu et al. (Reference Liu, Fedkiw and Kang2000) for maintaining a sharp representation of the liquid–gas interface.
Finally, the fluid velocity
 $\boldsymbol{u}^{n+1}$
is defined at the new time step
 $t^{n+1}$
as the projection of
 $\boldsymbol{u}^{\ast }$
onto the divergence-free space
 $$\begin{eqnarray}\boldsymbol{u}^{n+1}=\boldsymbol{u}^{\ast }-\frac{\unicode[STIX]{x0394}t}{\unicode[STIX]{x1D70C}^{n+1}}(\unicode[STIX]{x1D735}p^{n+1}-\unicode[STIX]{x1D70E}\unicode[STIX]{x1D705}\boldsymbol{n}\unicode[STIX]{x1D6FF}_{\unicode[STIX]{x1D6E4}}).\end{eqnarray}$$
3.3 Numerical methods for the fluid–solid boundary
As our simulations imply a solid irregular frontier immersed in the computational domain, the velocity field must respect the impermeability and no-slip conditions at the tank wall. A subcell resolution of a Dirichlet boundary condition has to be imposed on the velocity field. For numerical stability consideration, the latter condition can be imposed by applying the second-order numerical scheme from Gibou et al. (Reference Gibou, Fedkiw, Cheng and Kang2002) that requires the implicit temporal discretisation of the viscous terms (Ng et al. Reference Ng, Min and Gibou2009; Lepilliez et al. Reference Lepilliez, Popescu, Gibou and Tanguy2016) when solving Navier–Stokes equations.
The pressure field is computed with the formulation proposed in Lepilliez et al. (Reference Lepilliez, Popescu, Gibou and Tanguy2016). This formulation, based on the previous works of Ng et al. (Reference Ng, Min and Gibou2009) for single-phase flows, enables taking into account the surface tension forces in a grid cell that contains both a liquid–gas interface and a solid–fluid interface. A Neumann boundary condition on the immersed solid boundary
 $\unicode[STIX]{x1D6E4}_{s}$
is imposed on the pressure field. If a contact line is formed on the solid frontier, the surface tension effect must be taken into account on the Neumann pressure boundary condition
 $$\begin{eqnarray}\left.\boldsymbol{n}_{s}\boldsymbol{\cdot }\frac{\unicode[STIX]{x1D735}p}{\unicode[STIX]{x1D70C}}\right|_{\unicode[STIX]{x1D6E4}_{s}}=\boldsymbol{n}_{s}\boldsymbol{\cdot }(\boldsymbol{u}^{\ast }-\boldsymbol{u}_{s}+\unicode[STIX]{x1D70E}\unicode[STIX]{x1D705}\boldsymbol{n}\unicode[STIX]{x1D6FF}_{\unicode[STIX]{x1D6E4}})|_{\unicode[STIX]{x1D6E4}_{s}},\end{eqnarray}$$
with
 $\boldsymbol{u}_{s}$
the solid velocity.
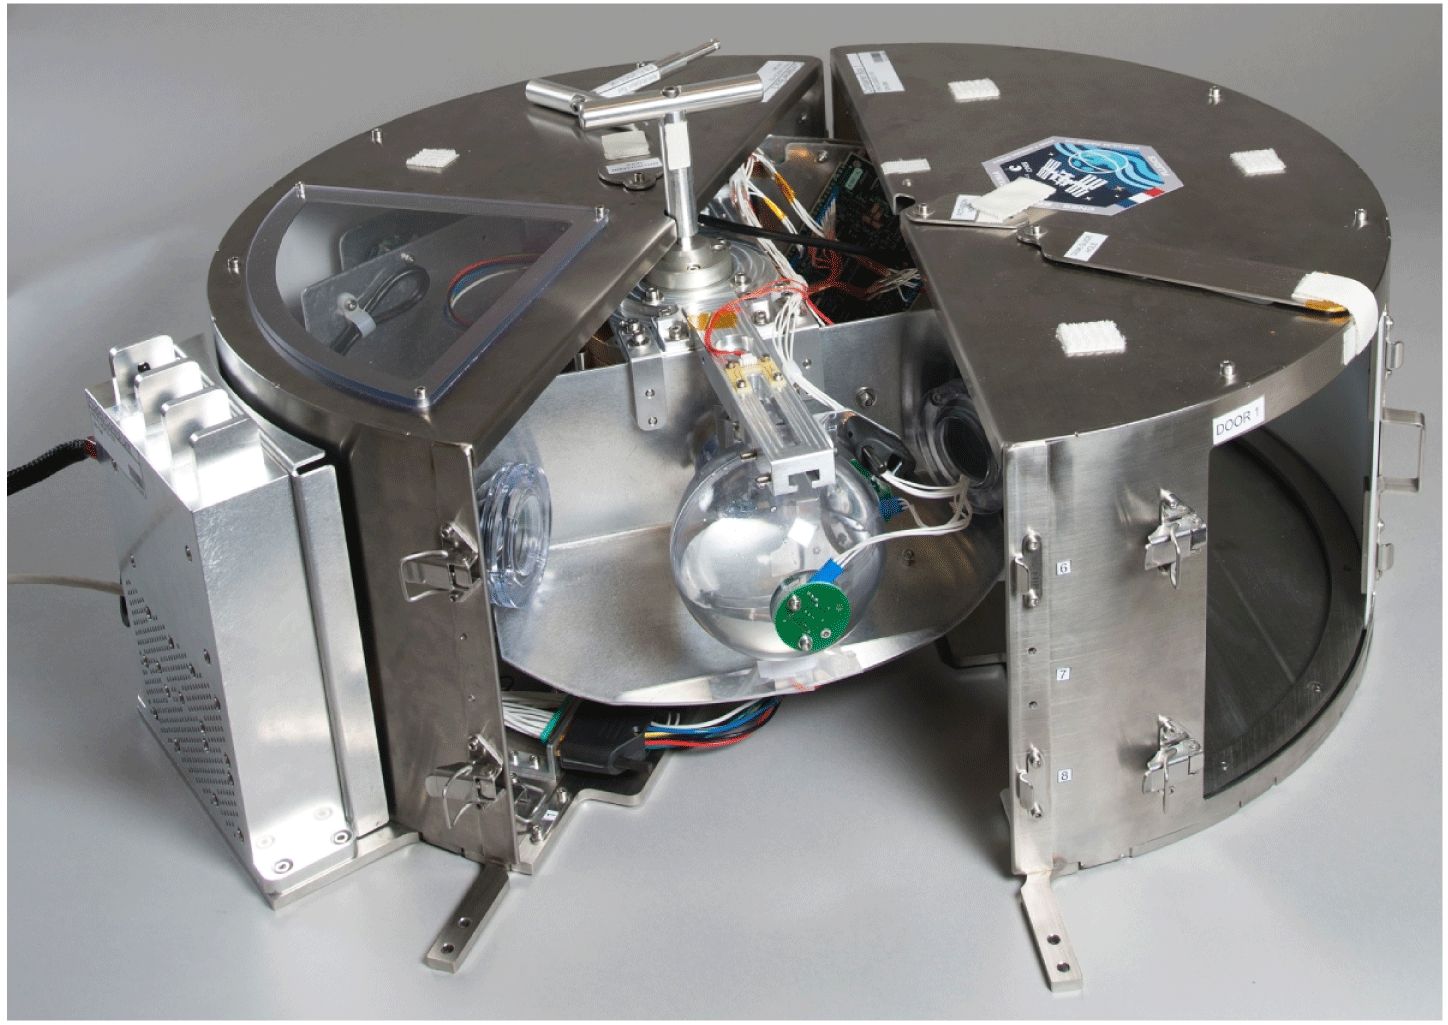
The Fluidics experiment.

4 Comparison with the Fluidics experiment data
Very few experimental data exist for the study of low Bond number manoeuvres in a microgravity environment because of the long time period required that cannot be achieved with drop tower or parabolic flight experiments. In 2017, the Fluidics experiment was sent by the CNES, the French national space agency, to the International Space Station (ISS) to quantify the sloshing phenomenon inside a spherical tank (Mignot et al. Reference Mignot, Pierre, Berhanu, Busset, Roumiguié, Bavestrello, Bonfanti, Miquel, Marot and Llodra-Perez2017). To validate the numerical code, we implement the case of the Fluidics experiment and compare our numerical results with the experimental data.
4.1 Description of the Fluidics experiment
The experiment, represented in figure 3, consists of a spherical transparent tank containing a safe substitute of propellant and helium, connected by an arm to a motor in the centre. The global system is integrated into a metallic housing and fixed on the seat rack rails of the ISS. The tank is subjected to angular velocity profiles similar to figure 2 followed by a deceleration and a zero velocity phase. Forces and torques generated on the tank are measured by sensors and bubble deformations are observed thanks to cameras. Two tanks have been sent to the ISS with a filling ratio of respectively 50 % and 75 %. The same angular acceleration
 $\dot{\unicode[STIX]{x1D6FA}}$
and velocity
 $\unicode[STIX]{x1D6FA}$
are enforced on the tanks. Equation (2.13) returns the Bond numbers of each tank as
 $Bo_{i}=23$
and
 $Bo_{c}=76$
for the half-filled tank and
 $Bo_{i}=15$
and
 $Bo_{c}=48$
for the tank with a filling ratio of 75 %. The values of the Bond numbers are higher than those of § 2.2 because of the noise of the experimental data. Indeed, the data from the force and torque sensor contain an important level of noise which prevents the data recovery from low Bond numbers manoeuvres.
4.2 Space convergence
The simulations of the Fluidics case are computed with a mesh of 128 cells in the 3 directions. To prove the space convergence, we consider the half-filled tank because the Bond numbers,
 $Bo_{i}=23$
and
 $Bo_{c}=76$
, are higher than those of the tank with
 $\unicode[STIX]{x1D70F}_{fill}=75\,\%$
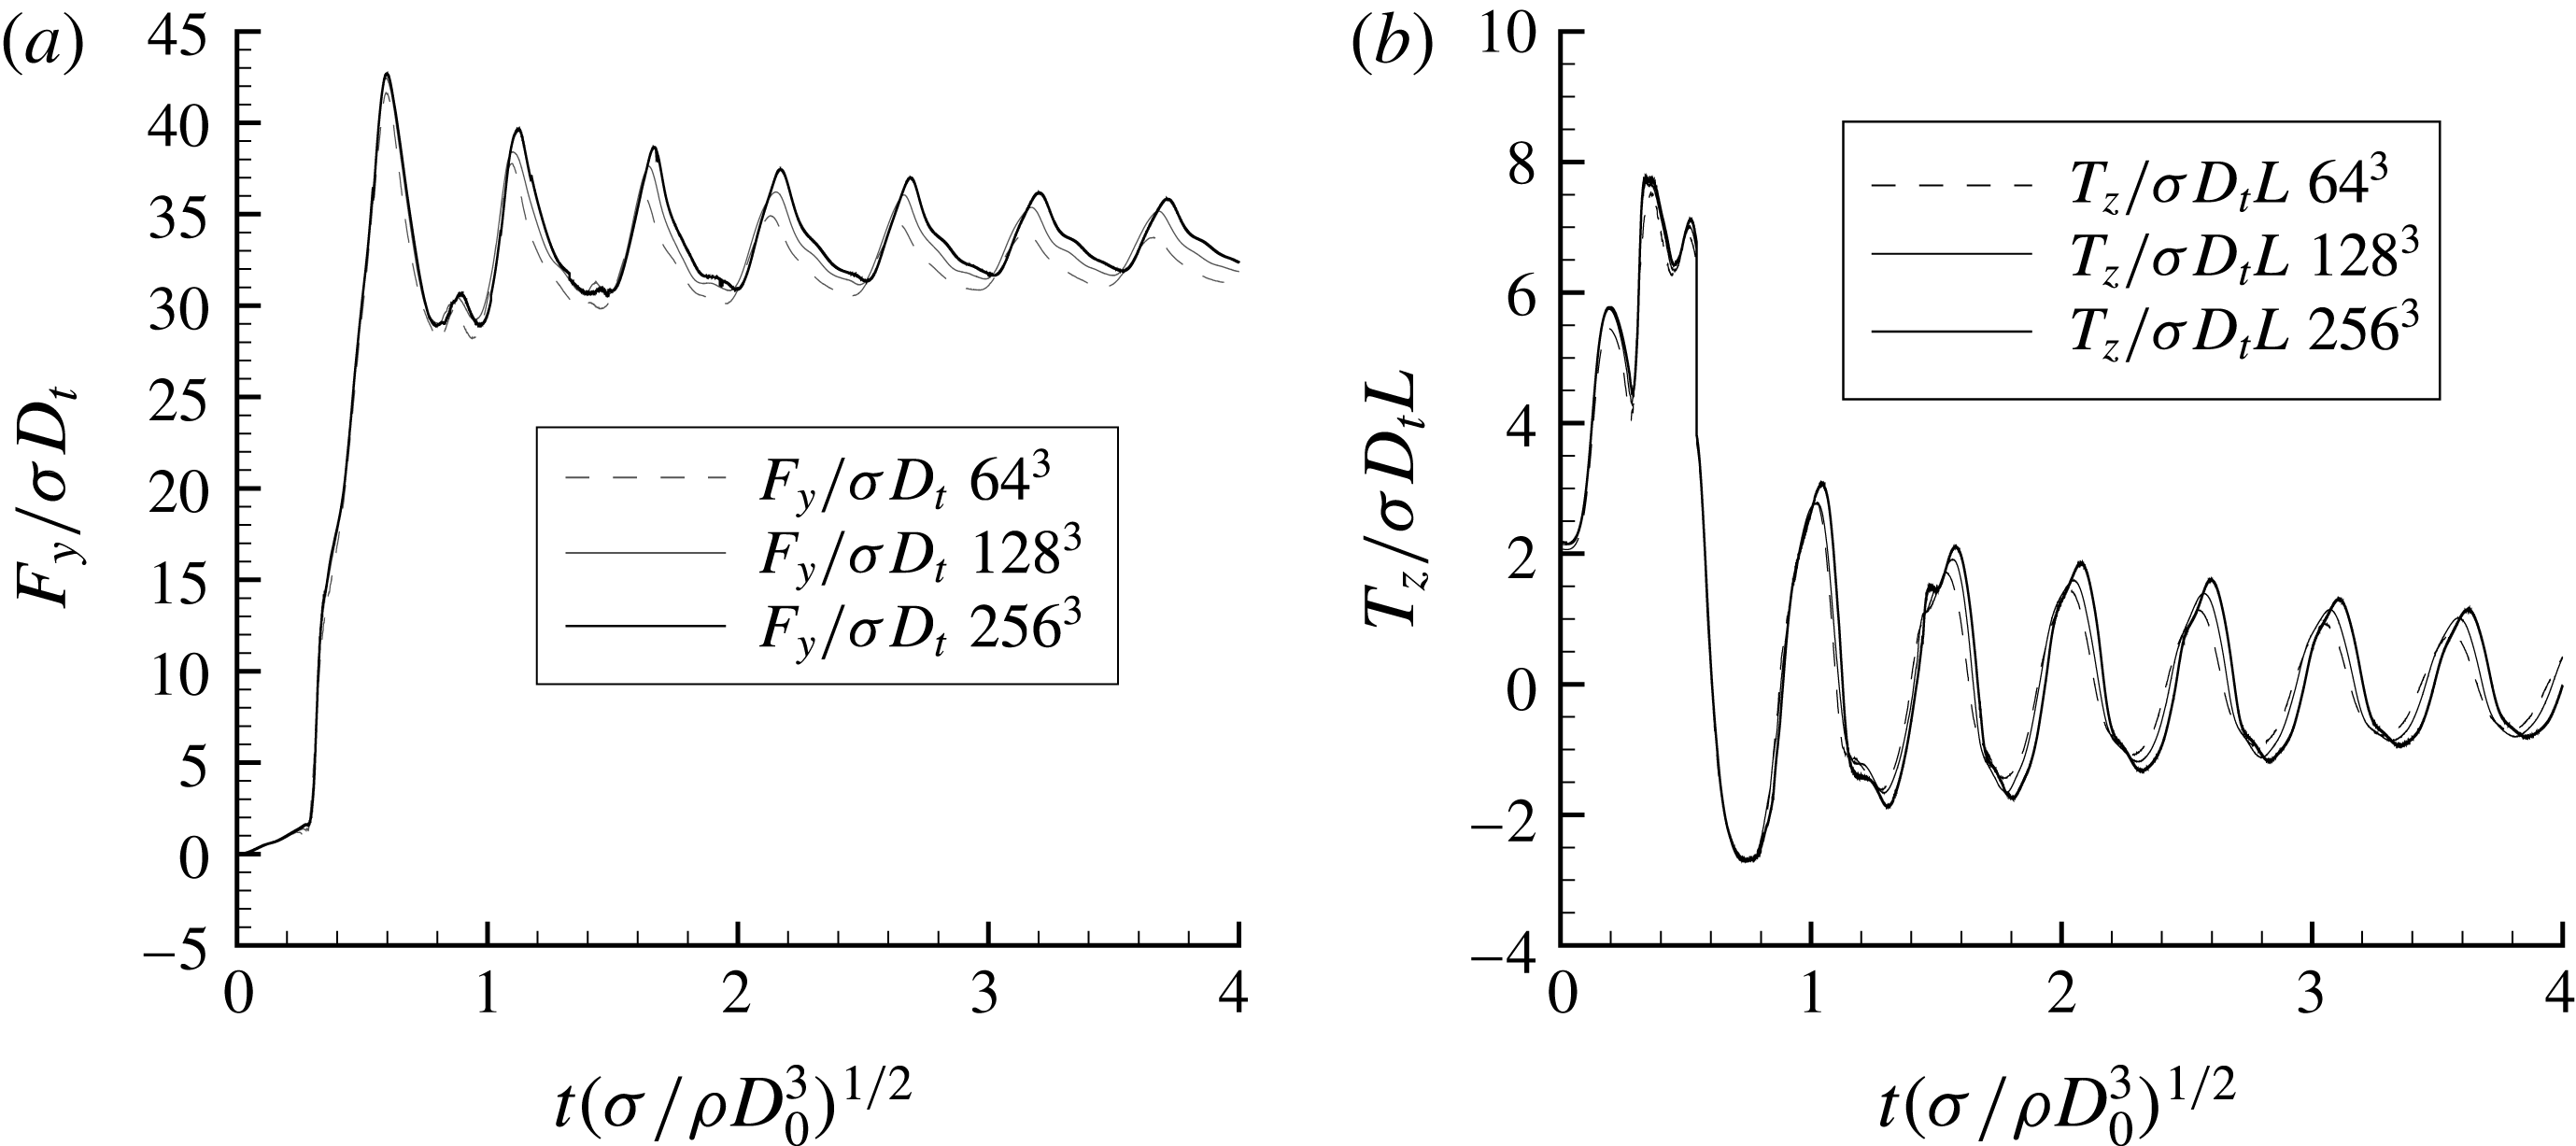
. The evolution of the force in the
 $y$
-direction and the torque in the
 $z$
-direction through time are shown in figure 4, for three different meshes, 64, 128 and 256 nodes in each direction. We observe that the global evolution of the force through time is well predicted by the three meshes. The average force during the constant angular velocity phase remains identical but the magnitude and the frequency of the oscillations depend weakly on the mesh size. A finer grid leads to slightly stronger oscillations around the mean value. The same behaviour appears for the evolution of the
 $z$
-direction torque. Finally, we can conclude that the two finer grids give results that are close enough to allow us to compare the experimental data with the results from the mesh with 128 cells in each direction.
Evolution of the
 $y$
-direction force and
 $z$
-direction torque generated by the fluids in the half-filled tank for
 $Bo_{c}=76$
and
 $Bo_{i}=23$
and three different meshes:
 $64^{3}$
,
 $128^{3}$
and
 $256^{3}$
.

4.3 Study of the force exerted on the tank wall
First, the force exerted on the tank wall by the fluids during the manoeuvre is investigated. The results from the sensor are compared to the computed force defined as
 $$\begin{eqnarray}\boldsymbol{F}=\int _{\unicode[STIX]{x1D6FA}_{f}}(\unicode[STIX]{x1D735}p-\unicode[STIX]{x1D70E}\unicode[STIX]{x1D705}\boldsymbol{n}\unicode[STIX]{x1D6FF}_{\unicode[STIX]{x1D6E4}})\,\text{d}V.\end{eqnarray}$$
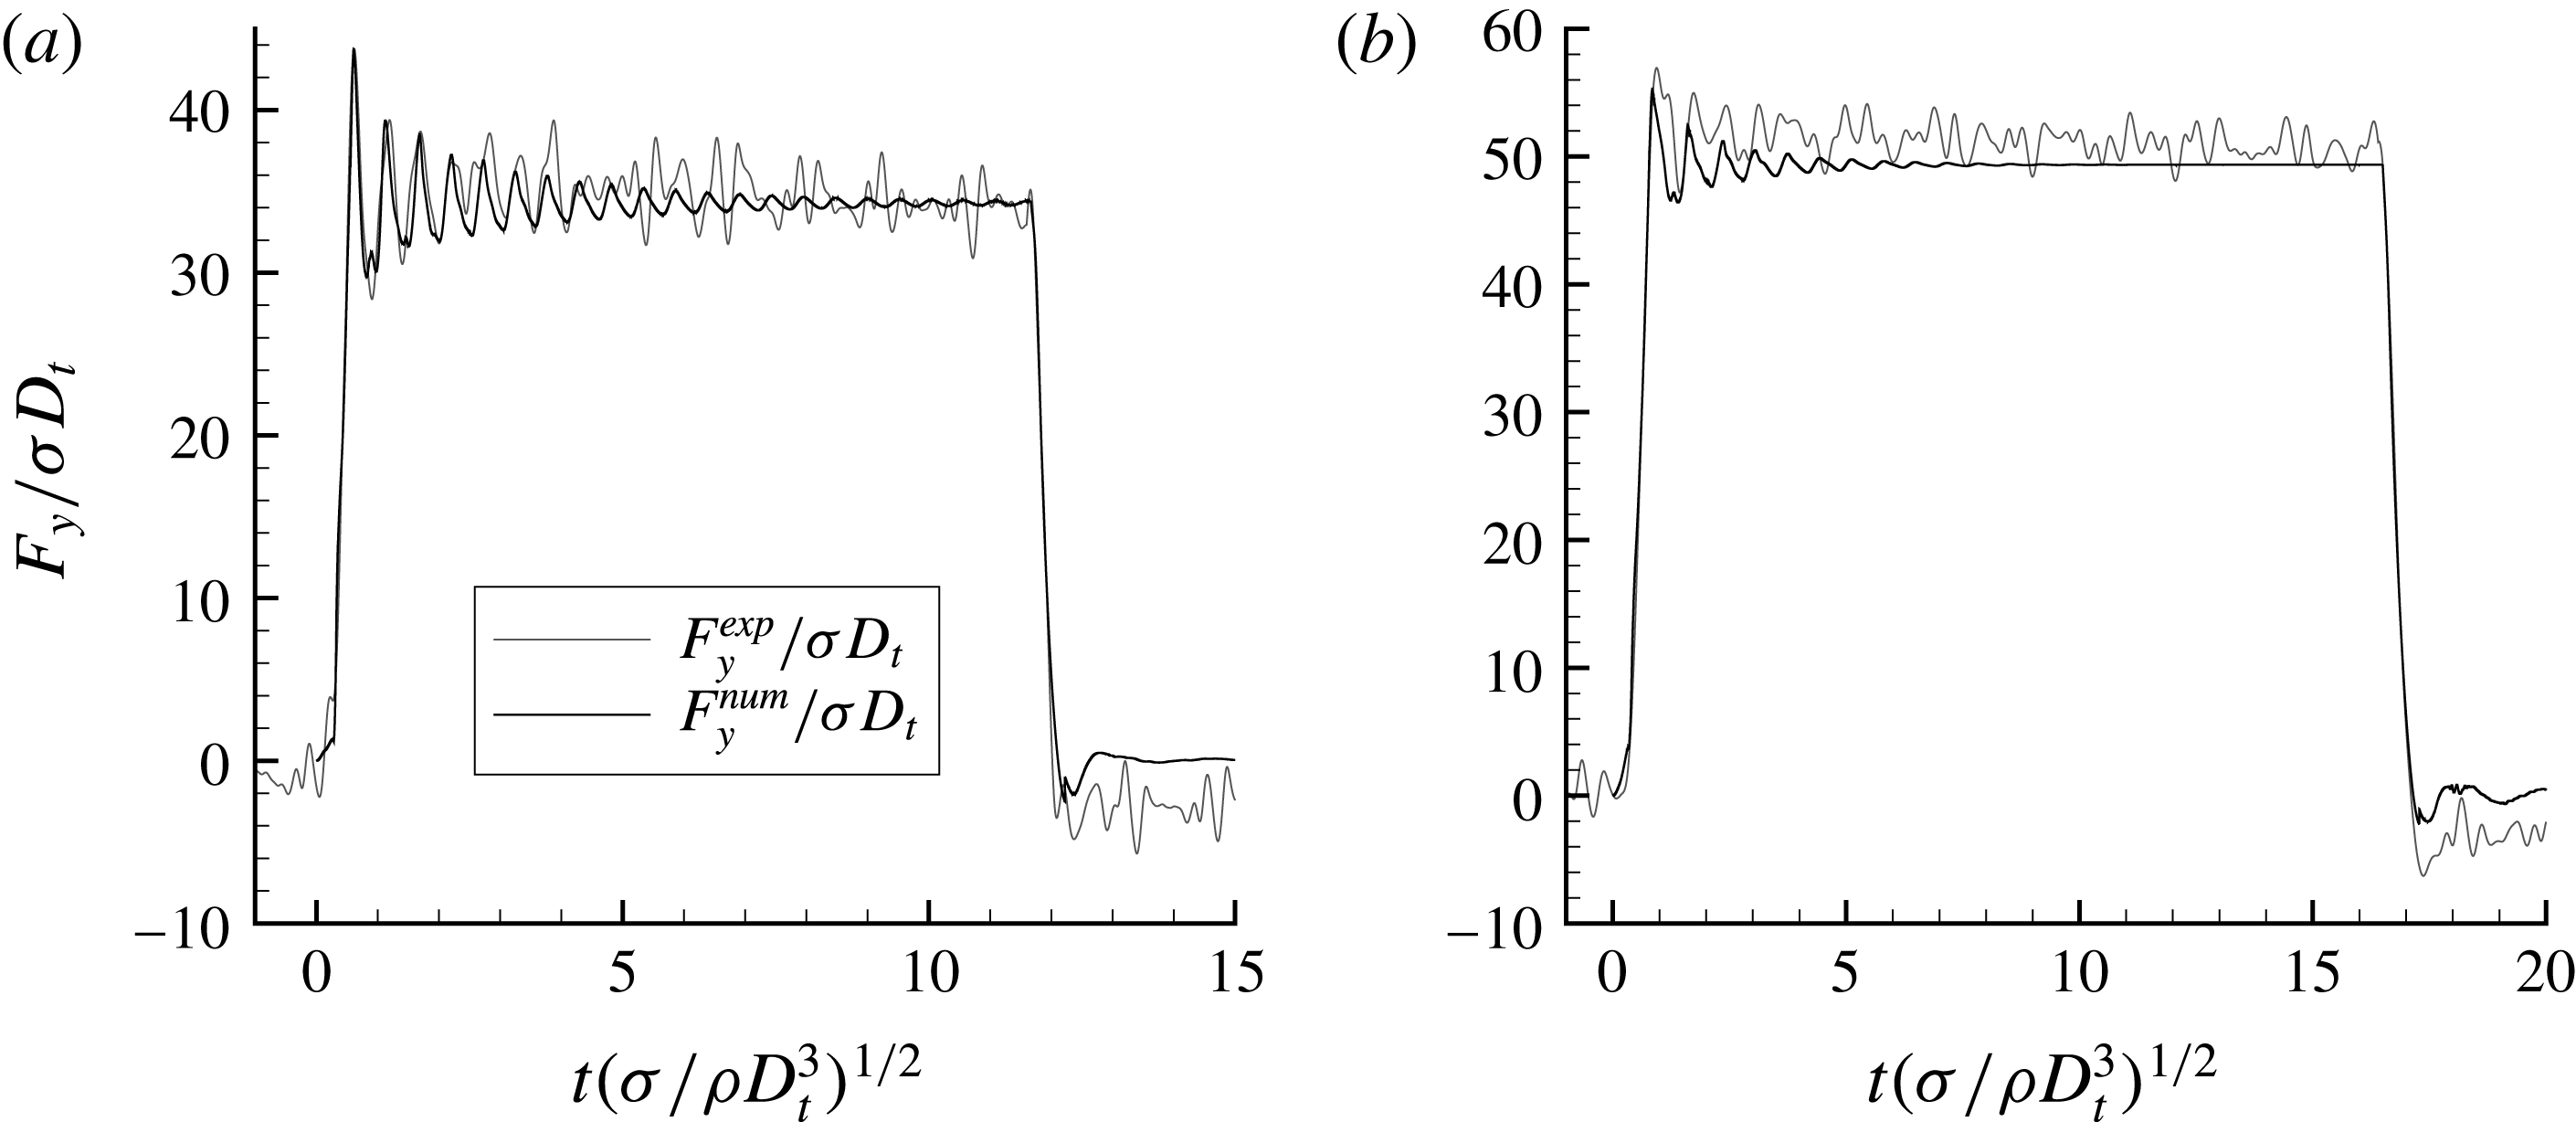
Figure 5 confronts the dimensionless force in the
 $y$
-direction measured by the sensor with the one obtained by computation during the manoeuvre on the two tanks. The force in the
 $y$
-direction, denoted by
 $F_{y}$
, increases quickly at the beginning because of the angular acceleration. When the constant angular velocity phase is reached, the force oscillates around a constant value. This value corresponds to the centrifugal force exerted by the liquid on the tank wall. The average value of the dimensionless force is higher for the tank with
 $\unicode[STIX]{x1D70F}_{fill}=75\,\%$
because more liquid is subjected to the centrifugal acceleration. The force evolution with the filling ratio is discussed in § 5.6. Moreover, the damping of the oscillations of the force is more important in the
 $\unicode[STIX]{x1D70F}_{fill}=75\,\%$
tank. Indeed, the gas bubble is smaller in this tank and more constrained by the liquid against the tank wall. Finally, the angular velocity decreases until it reaches zero leading to the cancellation of the force on the tank wall.
Comparison of the
 $y$
-direction force from the experimental data and our numerical simulations with (a)
 $\unicode[STIX]{x1D70F}_{fill}=50\,\%$
and (b)
 $\unicode[STIX]{x1D70F}_{fill}=75\,\%$
.

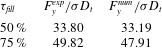
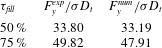
The global evolution of the force achieved with our simulations is similar to the force measured under microgravity conditions despite the important noise that remains in the experimental signal. Table 3 lists the average values of the dimensionless force during the constant angular velocity phase obtained with the experimental data,
 $F_{y}^{exp}/\unicode[STIX]{x1D70E}D_{t}$
, and our simulations,
 $F_{y}^{num}/\unicode[STIX]{x1D70E}D_{t}$
, for both filling ratio cases. These values are close together with an error of
 $1.8\,\%$
for the half-filled tank and
 $3.8\,\%$
for
 $\unicode[STIX]{x1D70F}_{fill}=75\,\%$
which consolidates the validity of the numerical simulations. The oscillations are difficult to compare because of the noise of the experimental data. Nevertheless, the first oscillations of the half-filled tank case, which magnitudes are higher than the level noise, are well predicted by the numerical simulations.
Comparison of the mean
 $y$
-direction forces in both cases of the Fluidics experiment.
4.4 Study of the torque exerted on the tank wall
The torque data are also compared to our numerical results. The sensor is located at the interface between the rotating arm and the tank. The torque data allow us to validate the force exerted by the fluids on the tank wall and the position of the centre of mass. The torque
 $\boldsymbol{T}$
is integrated in our simulations as
 $$\begin{eqnarray}\boldsymbol{T}=\int _{\unicode[STIX]{x1D6FA}_{f}}\boldsymbol{S}\boldsymbol{M}\times (\unicode[STIX]{x1D735}p-\unicode[STIX]{x1D70E}\unicode[STIX]{x1D705}\boldsymbol{n}\unicode[STIX]{x1D6FF}_{\unicode[STIX]{x1D6E4}})\,\text{d}V.\end{eqnarray}$$
with
 $\boldsymbol{S}\boldsymbol{M}$
the vector between the sensor position and the fluid particle.
Comparison of the
 $z$
-direction torque from the experimental data and our numerical simulations with (a)
 $\unicode[STIX]{x1D70F}_{fill}=50\,\%$
and (b)
 $\unicode[STIX]{x1D70F}_{fill}=75\,\%$
.

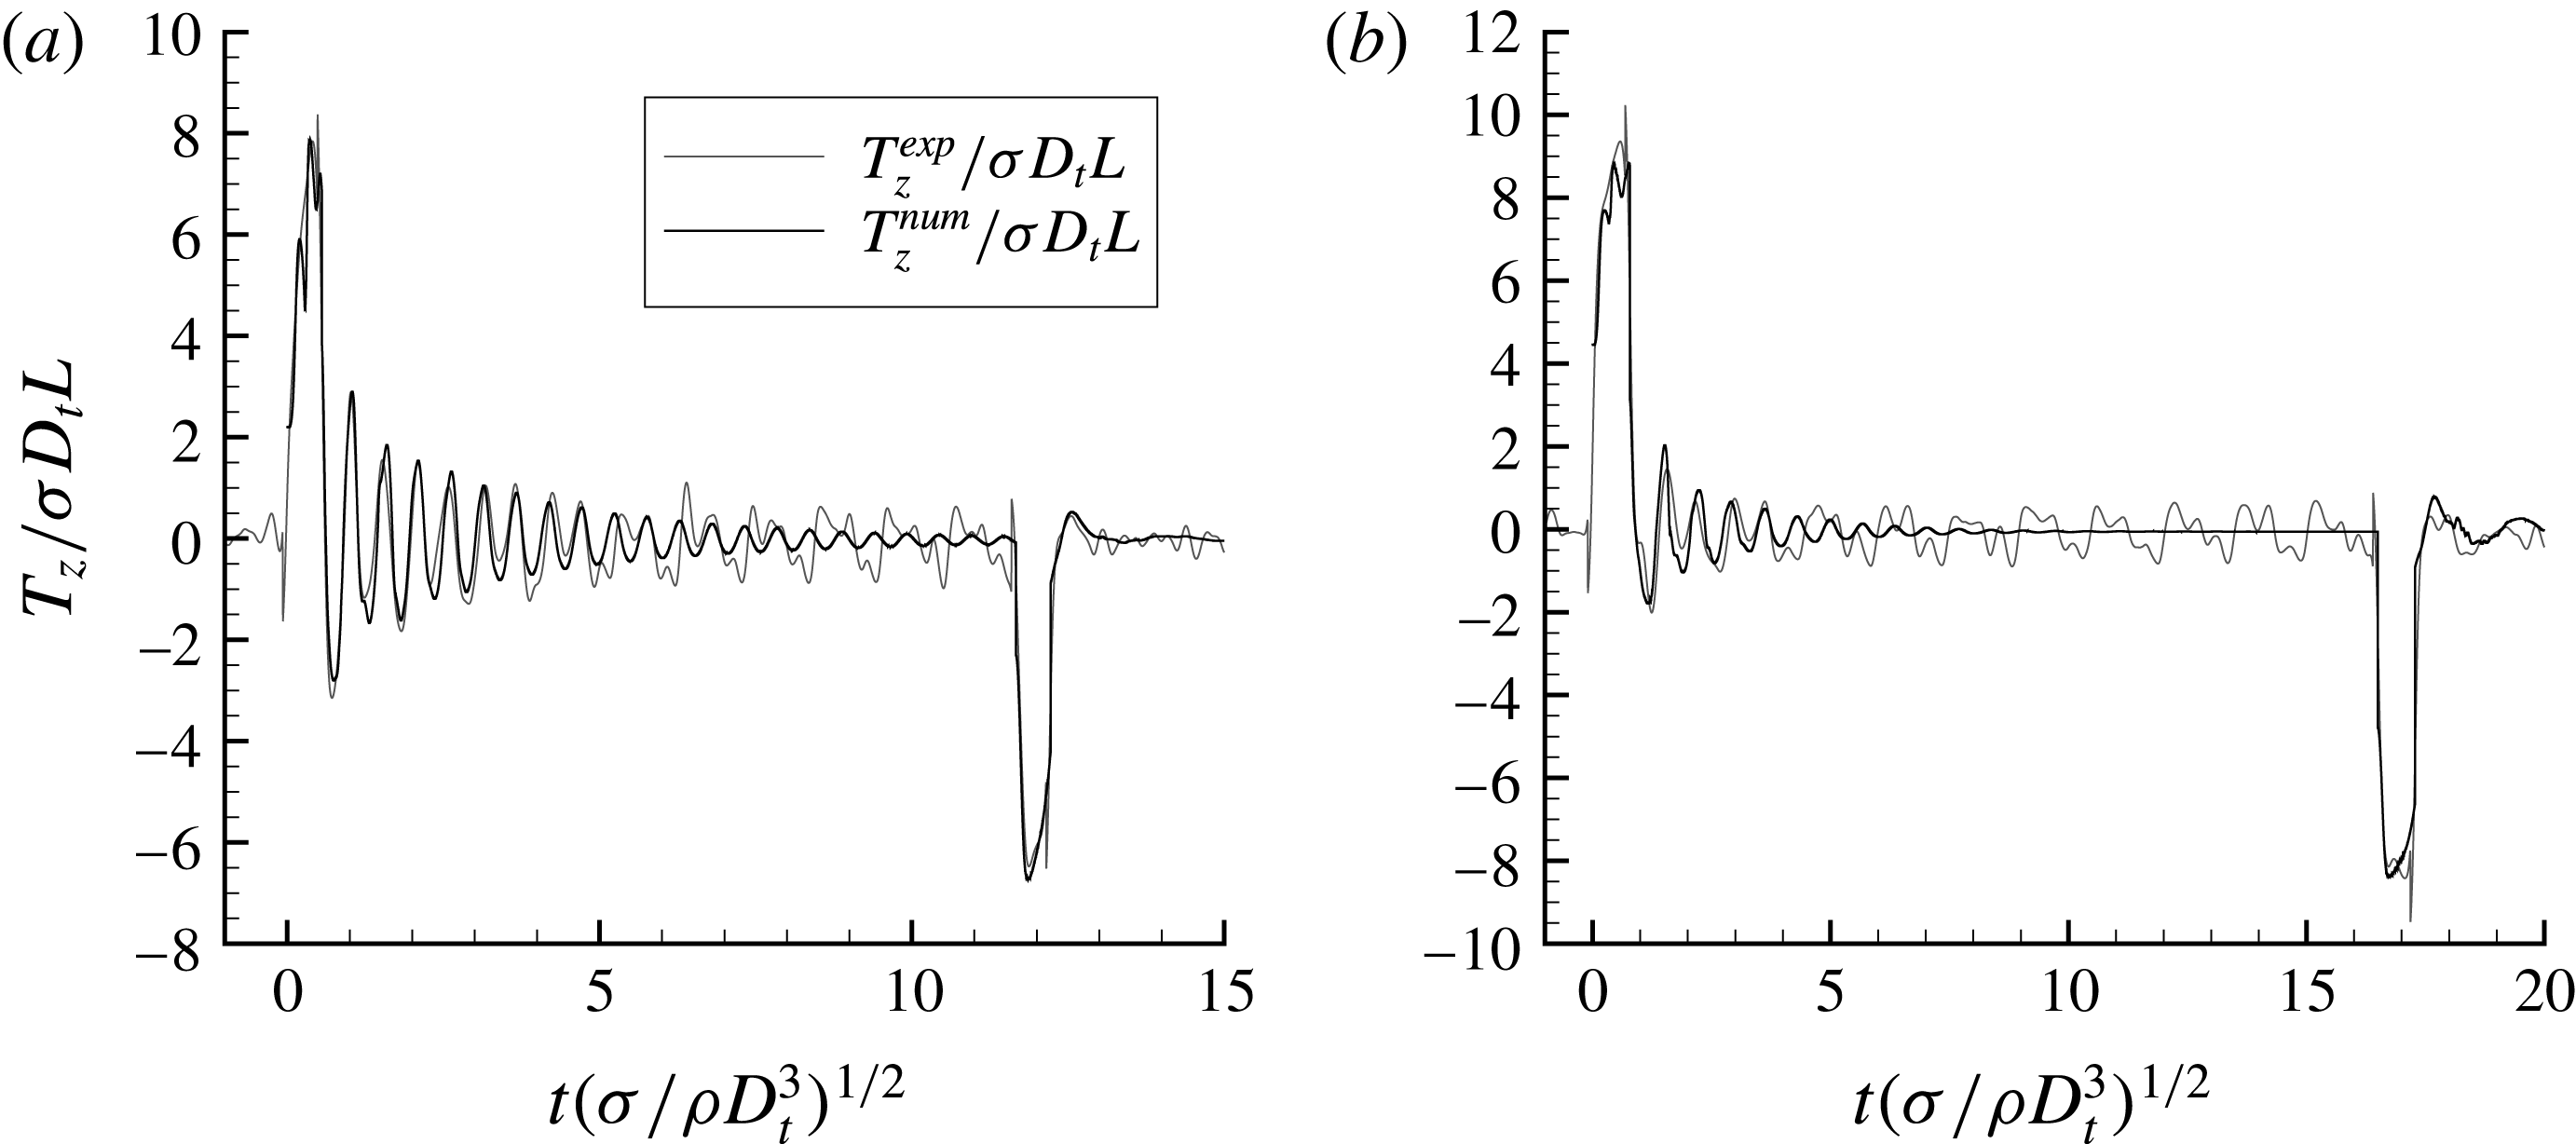
Figure 6 compares the torque in the
 $z$
-direction from the Fluidics data to our numerical results for the two tanks cases. During the acceleration phase, we observe a positive peak of the
 $z$
-direction torque which is due to the component of the acceleration in the
 $x$
-direction depending on
 $Bo_{i}$
in (2.7). We observe the same peak with the opposite sign during the deceleration phase, at
 $t^{\ast }=11.5$
for the half-filled tank and at
 $t^{\ast }=16$
for the tank with
 $\unicode[STIX]{x1D70F}_{fill}=75\,\%$
. During the constant velocity phase, the
 $z$
-direction torque oscillates around zero. It represents the oscillation of the bubble around its equilibrium position against the tank wall. This bubble behaviour generates forces in the
 $x$
-direction which appear in the
 $z$
-direction torque. The numerical simulation reproduces well the torque oscillations until the damping brings their magnitudes around the noise level. The damping of the oscillation is more important with the higher filling ratio because more liquid is subjected to the centrifugal acceleration. Finally, during the zero velocity phase at the end, the torque remains zero. The peaks and the oscillations for which the magnitude is higher than the noise level are well predicted by the numerical simulations.
As the torque depends both on the force exerted on the tank wall and on the centre of mass of the liquid, these results provide a strong validation for these variables. As a result, an indirect validation of the zero contact angle hypothesis is obtained here since the centre of mass depends mainly on the bubble volume and on the interface shape and thus on the contact angle value.
5 Evolution of the centre of mass
This section investigates the evolution of the centre of mass of the fluid medium under the effect of the inertial forces. First, a grid sensitivity study is presented. Then, an overview of the physical phenomena is given through an example of the fluids behaviour during a manoeuvre. The temporal evolution of the centre of mass is described for a wide range of the Bond numbers. For some of the higher values of the dimensionless parameters, an oscillatory phenomenon of the centre of mass around its equilibrium position is observed and discussed. Finally, the position of the centre of mass and the force exerted on the tank wall at the steady state are described and fitted by semi-empirical laws.
The subsections focusing on the transient regime consider the filling ratio of 50 % and the Bond numbers summarised in tables 1 and 2. The two last subsections aim the steady state, which does not depend on
 $Bo_{i}$
, and investigate the influence of the filling ratio. The filling ratios considered in the steady state are listed in table 4.
5.1 Grid sensitivity study
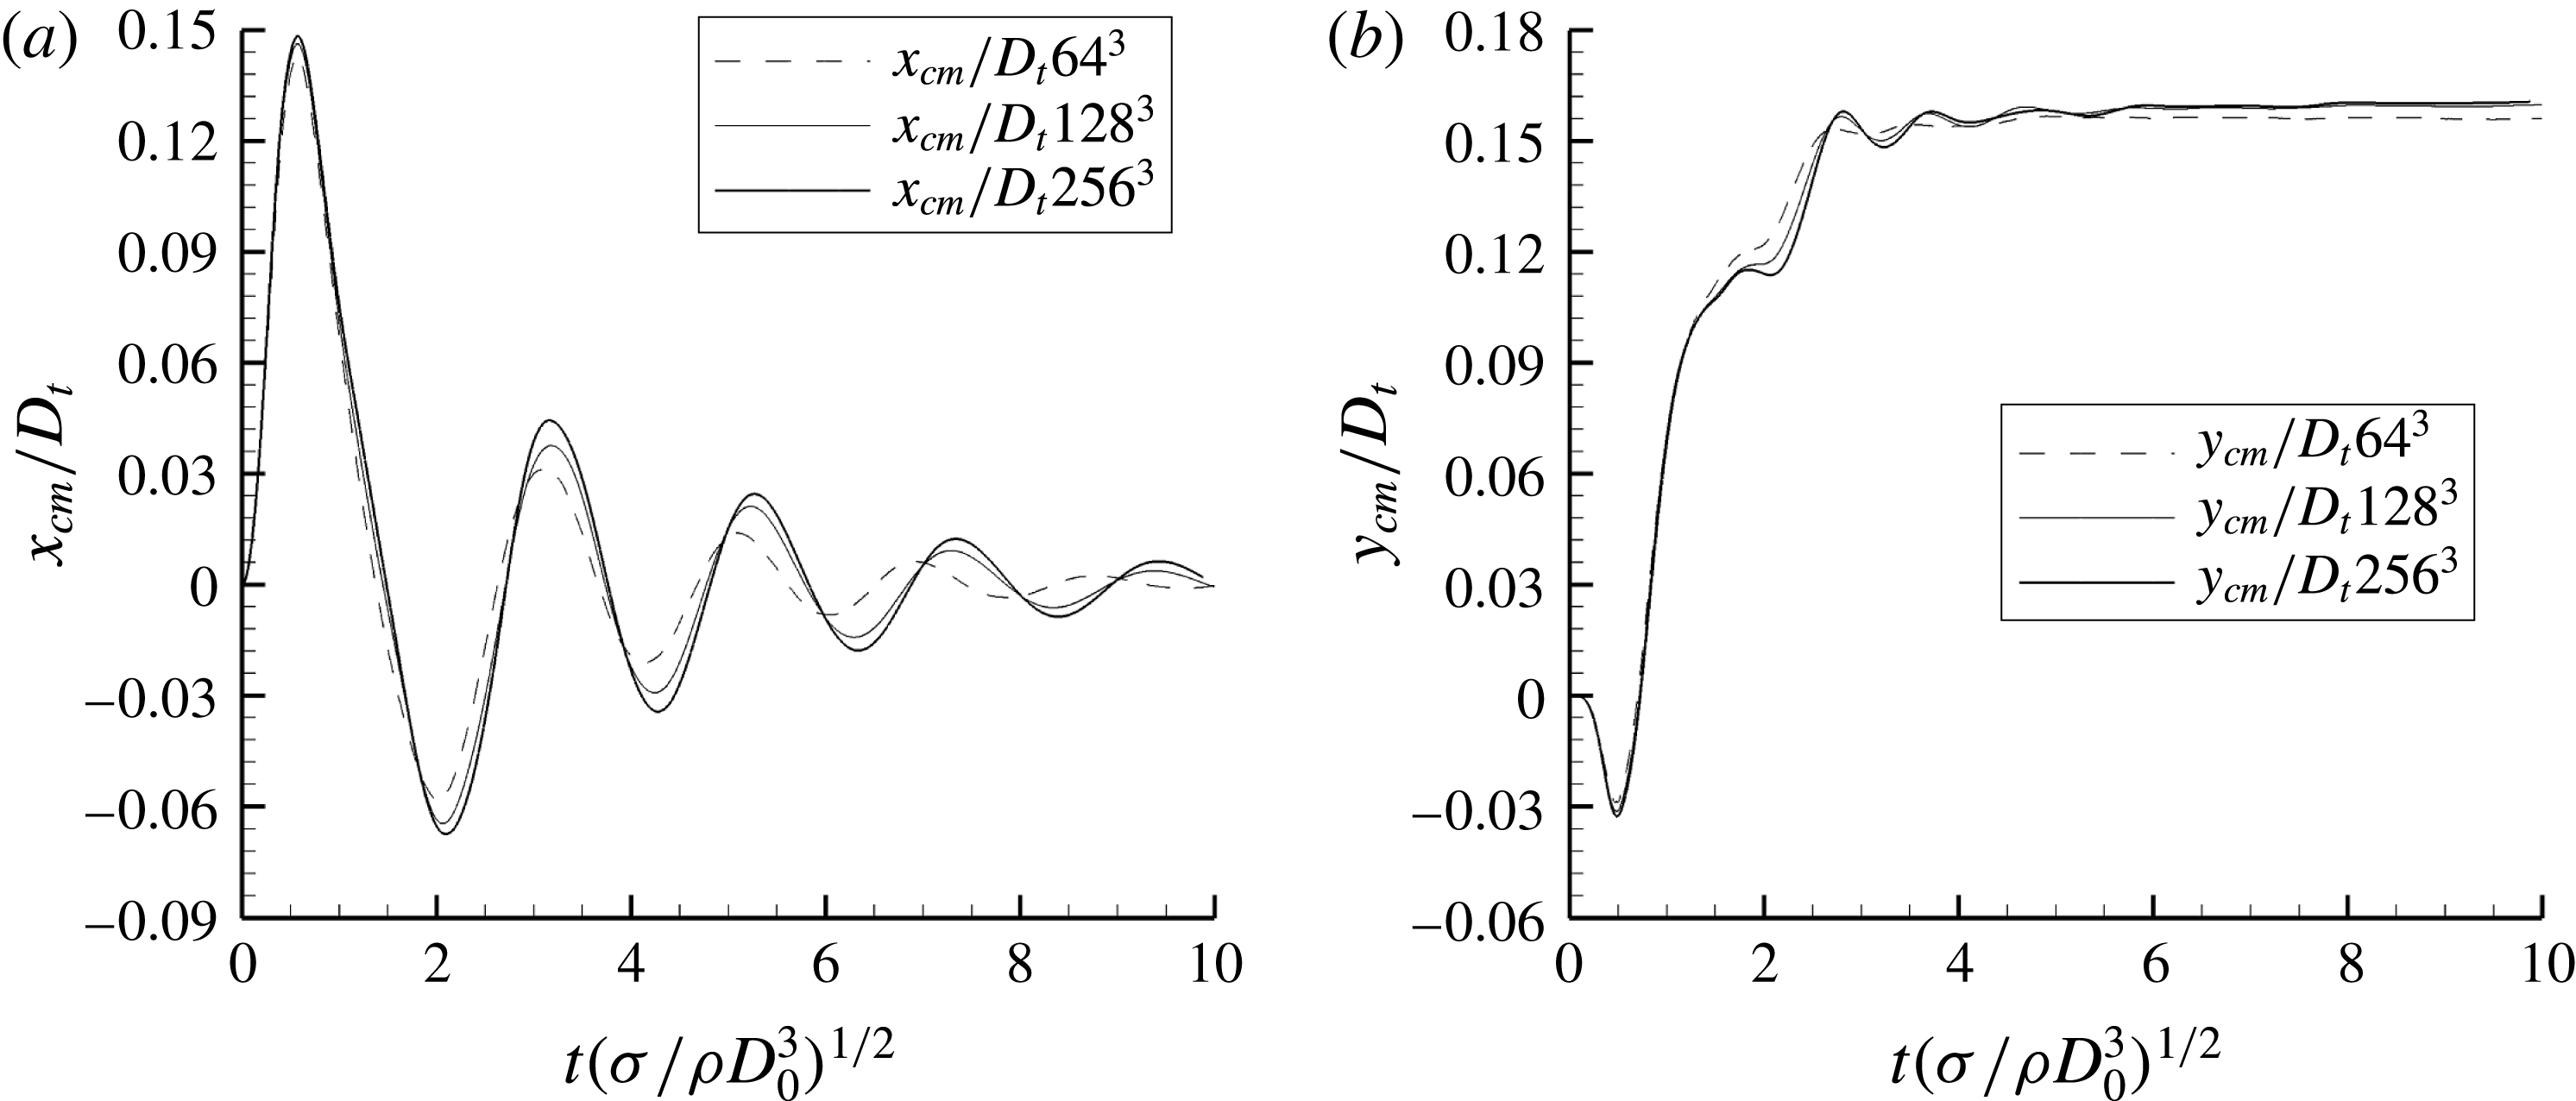
We present here numerical evidence about the grid sensitivity of the numerical simulations. All the simulations presented in this study have been computed with a mesh of 128 cells in each direction. In figure 7, the evolution of the coordinates of the centre of mass of the fluids throughout time has been plotted for three different meshes containing respectively
 $64$
,
 $128$
and
 $256$
nodes in each direction. The
 $z$
-coordinate of the centre of mass does not appear in figure 7 because no external acceleration happens in the
 $z$
-direction and therefore, the bubble stays centred in the
 $z$
-direction. The
 $z$
-coordinate of the centre of mass obtained in our numerical results is always lower than the mesh size. These results correspond to the case with
 $Bo_{c}=5.80$
,
 $Bo_{i}=5.80$
and
 $\unicode[STIX]{x1D70F}_{fill}=50\,\%$
implying the highest velocity of the centre of mass and the highest deformation of the bubble. These comparisons show a good agreement between the solutions on the latter two grids, from which we assume that the intermediate grid
 $128^{3}$
is thin enough considering the spatial convergence of our computations.
Evolution of the coordinates of the centre of mass of the fluids for
 $Bo_{c}=5.80$
,
 $Bo_{i}=5.80$
,
 $\unicode[STIX]{x1D70F}_{fill}=50\,\%$
and three different meshes:
 $64^{3}$
,
 $128^{3}$
and
 $256^{3}$
.

Filling ratios of liquid in the tank and the corresponding initial bubble diameters.

5.2 An example of bubble motion
This section describes the motion of the fluids inside the tank in a specific case. It illustrates the global behaviour of the bubble gas, and consequently the centre of mass evolution, during a manoeuvre. We consider the half-filled tank case with
 $Bo_{i}=1.16$
and
 $Bo_{c}=0.116$
.
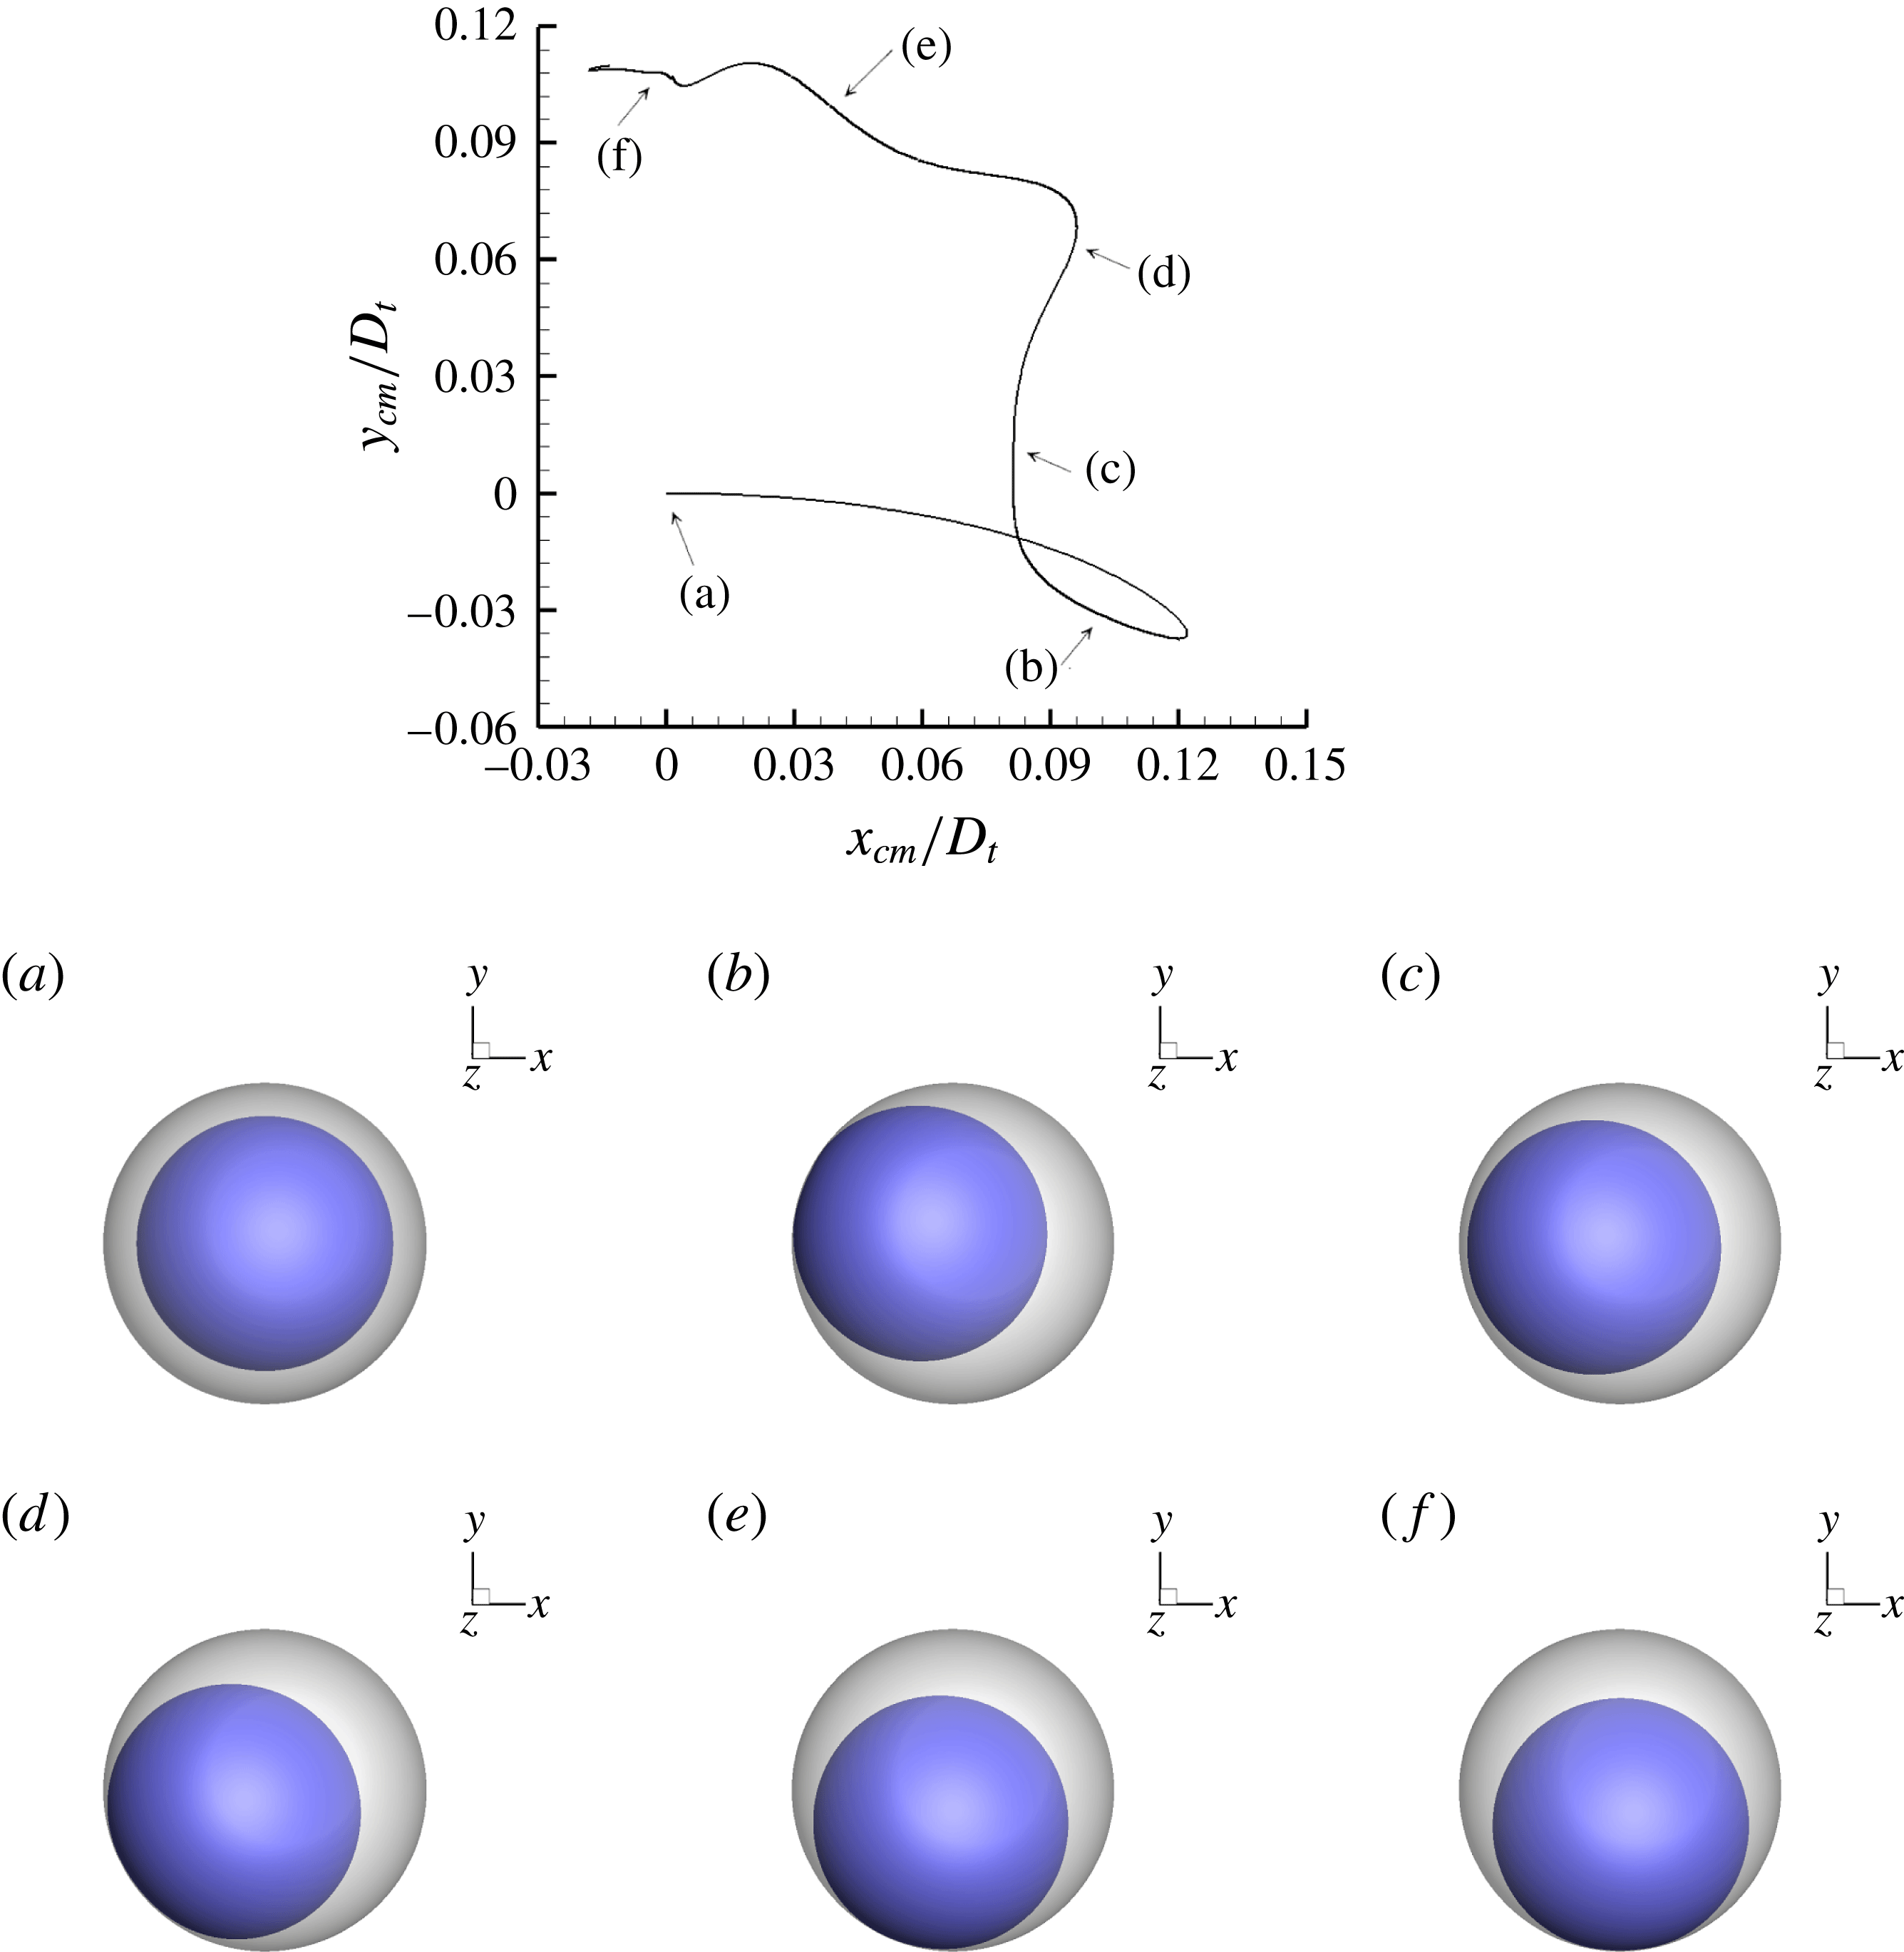
The first plot in figure 8 shows the trajectory of the centre of mass in the
 $xy$
-plane. The other plots in figure 8 are pictures of the position of the fluids inside the tank at 6 specific times and are described below. The dark blue interface represents the gas-liquid interface and the grey represents the fluid–solid interface. In addition, movie 1 (available at https://doi.org/10.1017/jfm.2018.389) displays the accelerated motion of the bubble during the manoeuvre.
Trajectory of the centre of mass of the tank in the
 $xy$
-plane and bubble positions at 6 different times with
 $Bo_{i}=1.16$
,
 $Bo_{c}=0.116$
and
 $\unicode[STIX]{x1D70F}_{fill}=50\,\%$
.

Initially, the bubble is spherical and located in the centre of the tank (a). At the beginning of the manoeuvre, the bubble goes toward the axis
 $-\boldsymbol{e}_{\boldsymbol{x}}$
until it reaches the tank wall (b). The bubble spreads and bounces (c), moves in the direction
 $-\boldsymbol{e}_{\boldsymbol{y}}$
and spreads on the wall a second time (d). Finally, the bubble follows the tank wall (e) until it reaches its final position around the
 $x$
-axis (f). The motion of the centre of mass is the opposite of the global motion of the bubble. The first bouncing of the bubble leads to the loop in the trajectory of the centre of mass. In all the pictures in figure 8, a thin film of liquid is always trapped between the gas bubble and the tank wall because of the perfectly wetting condition.
The detailed analysis of the trajectories for different Bond numbers is the aim of the next subsection.
5.3 Trajectory of the centre of mass
The trajectory of the centre of mass of the fluids depends on the temporal evolution of the inertial acceleration
 $\boldsymbol{a}_{\boldsymbol{i}}=\boldsymbol{a}_{\mathbf{1}}+\boldsymbol{a}_{\mathbf{2}}+\boldsymbol{a}_{\mathbf{3}}$
, expressed here as a function of the two main dimensionless numbers
 $Bo_{i}$
and
 $Bo_{c}$
characterising our physical system,
 $$\begin{eqnarray}\boldsymbol{a}_{\boldsymbol{i}}=\frac{\unicode[STIX]{x1D70E}}{\unicode[STIX]{x1D70C}_{l}D_{0}^{2}L}[Bo_{i}(-(L+y)\boldsymbol{e}_{\boldsymbol{x}}+x\boldsymbol{e}_{\boldsymbol{y}})-Bo_{c}(x\boldsymbol{e}_{\boldsymbol{x}}+(L+y)\boldsymbol{e}_{\boldsymbol{y}})].\end{eqnarray}$$
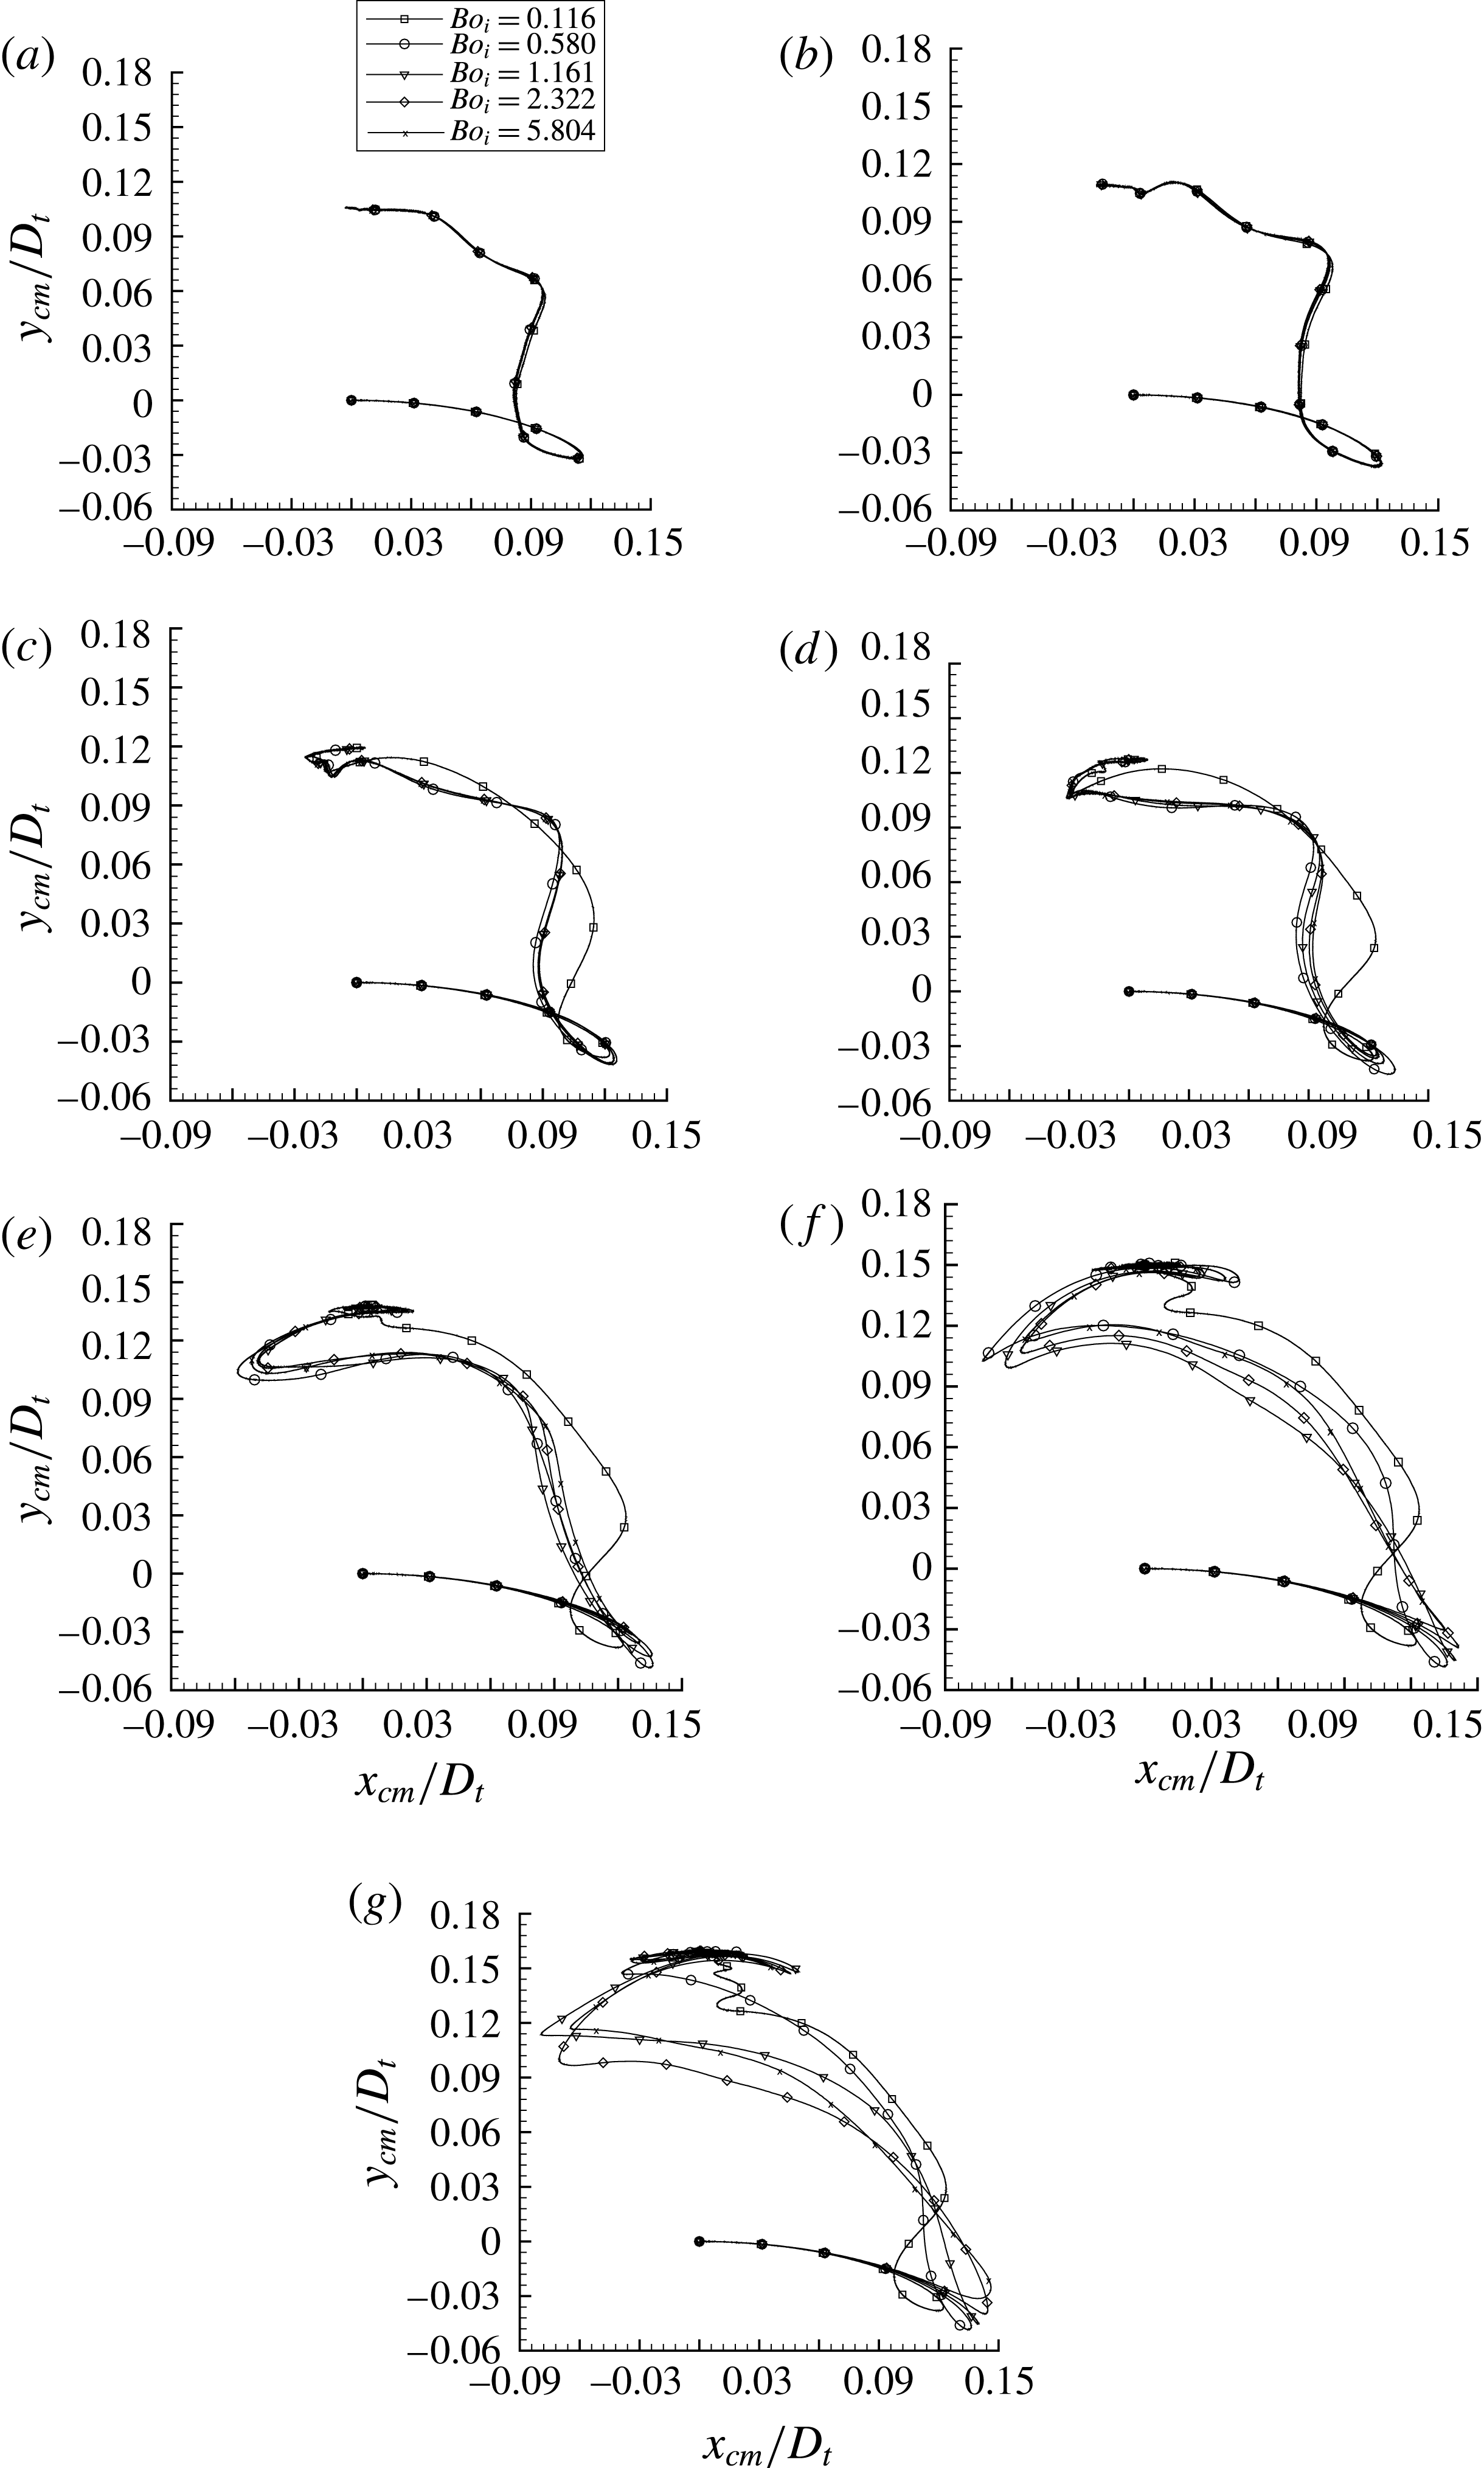
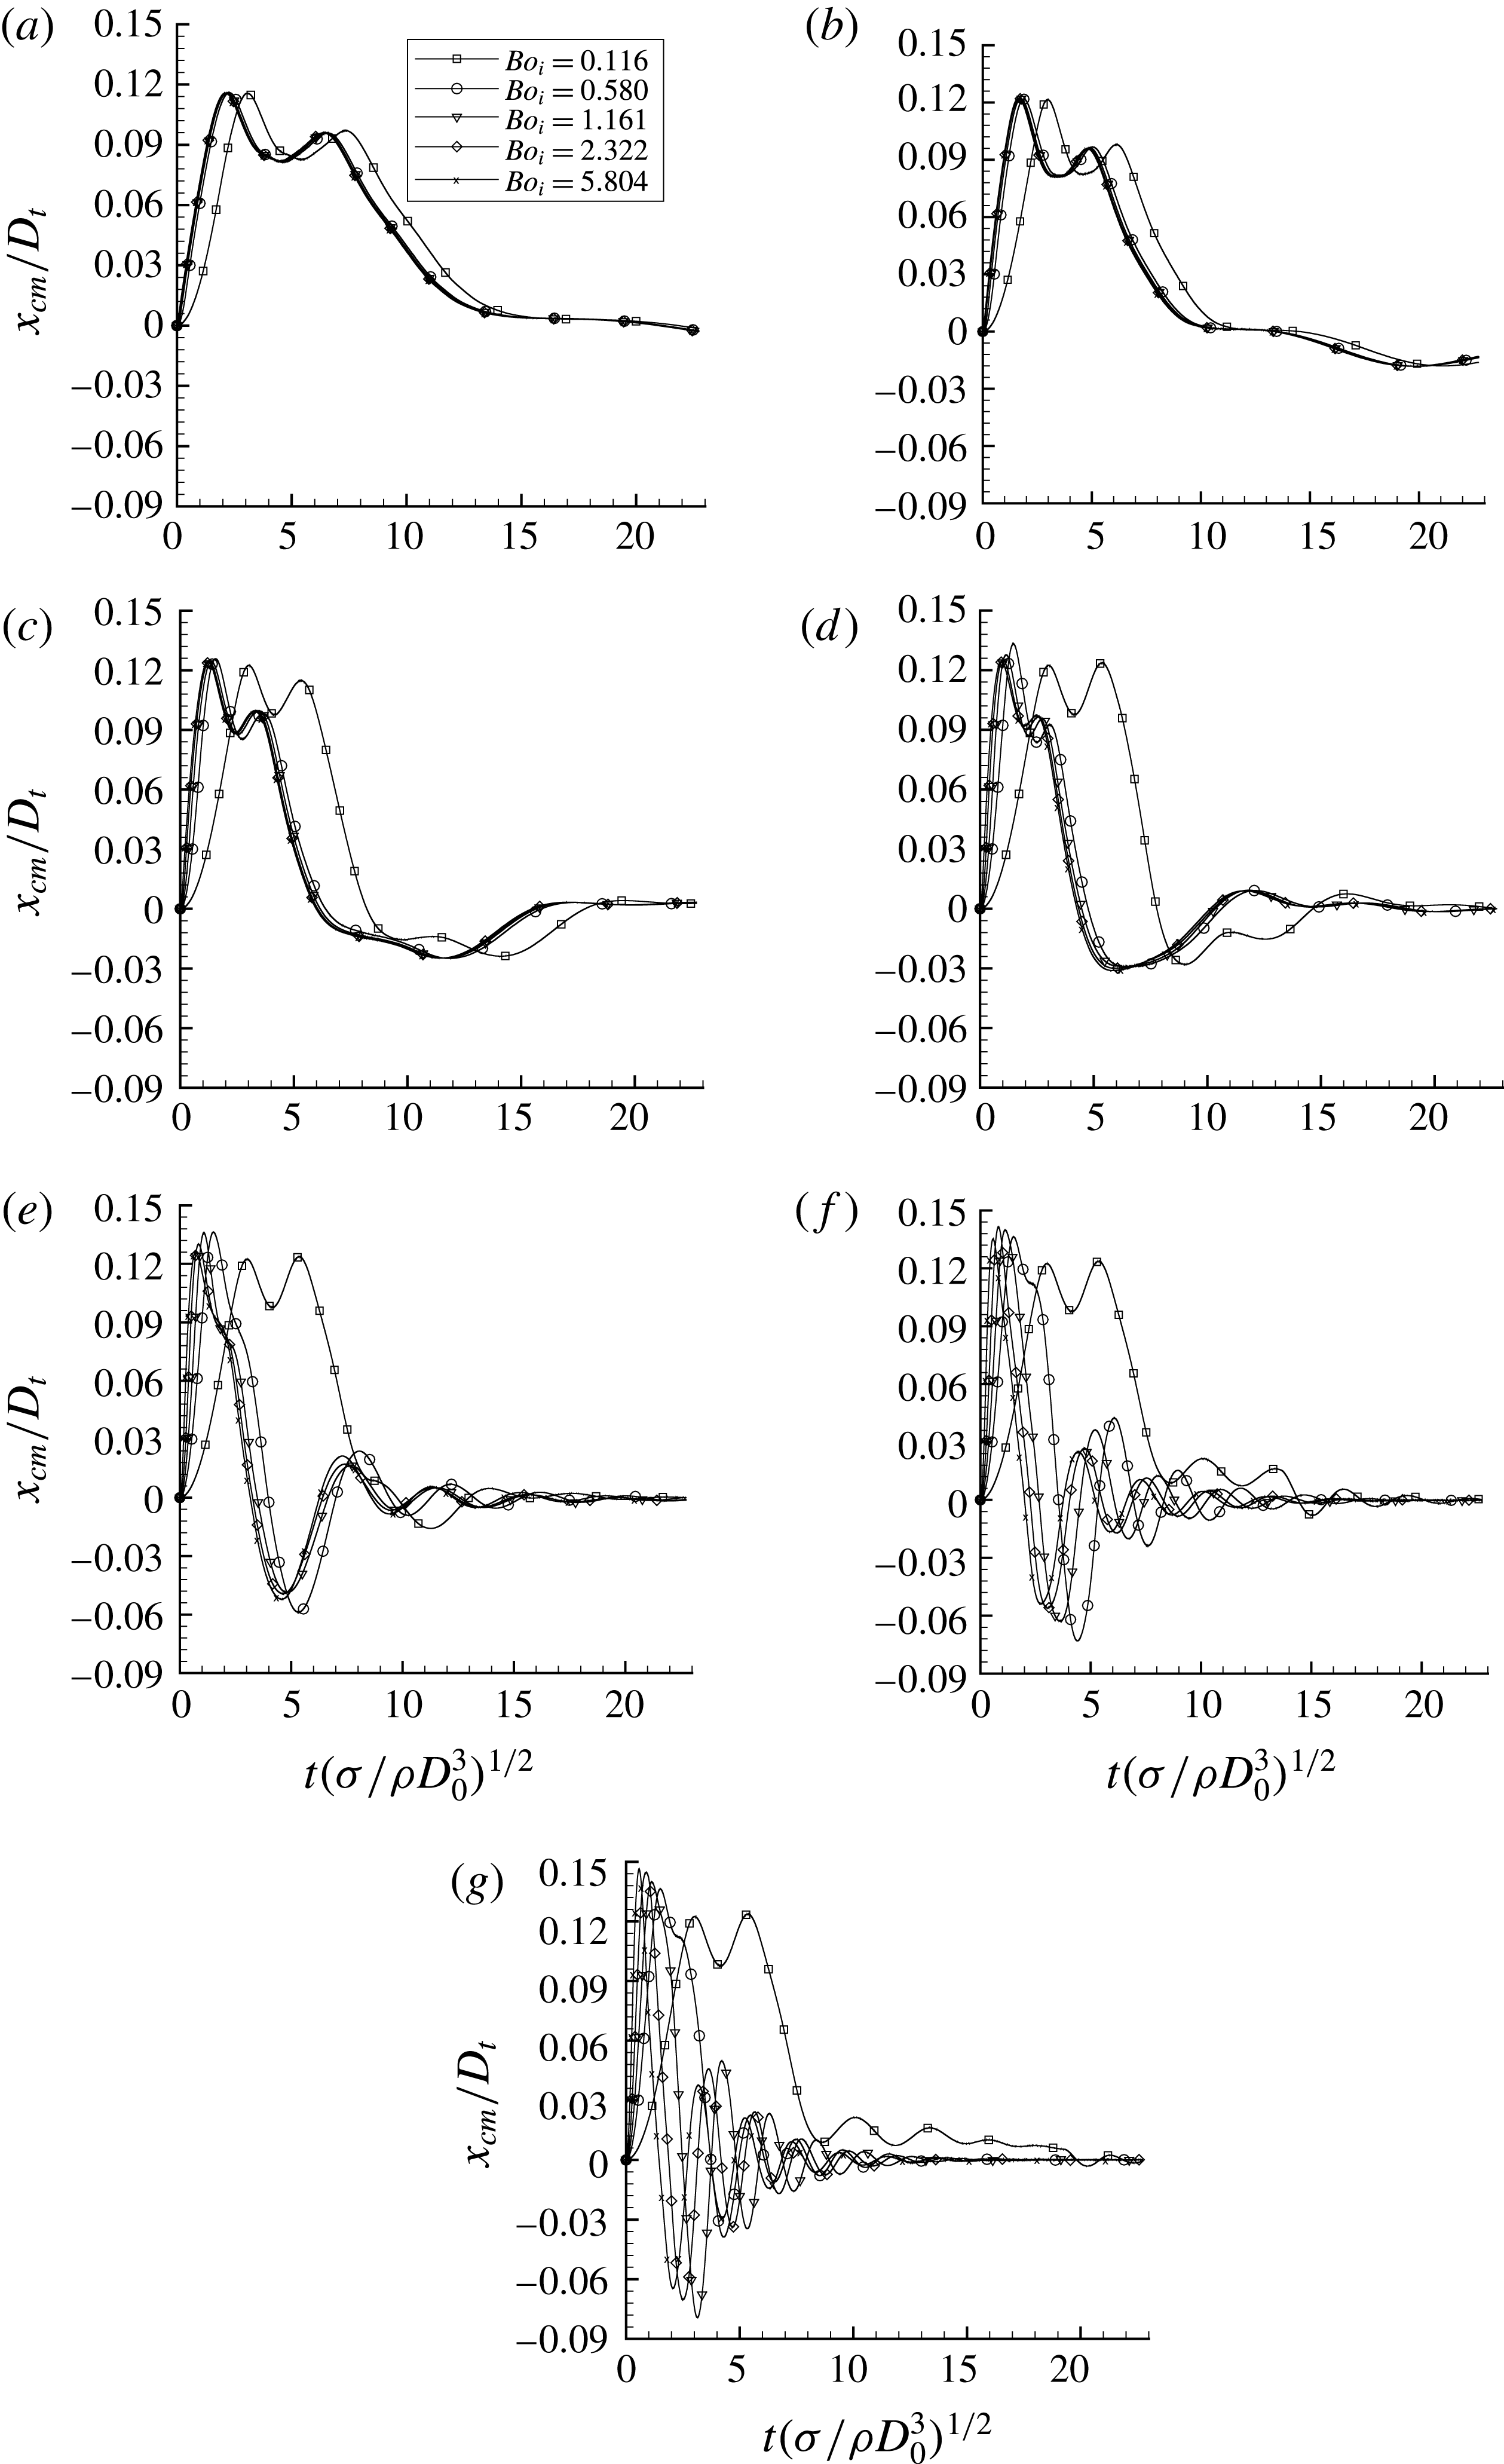
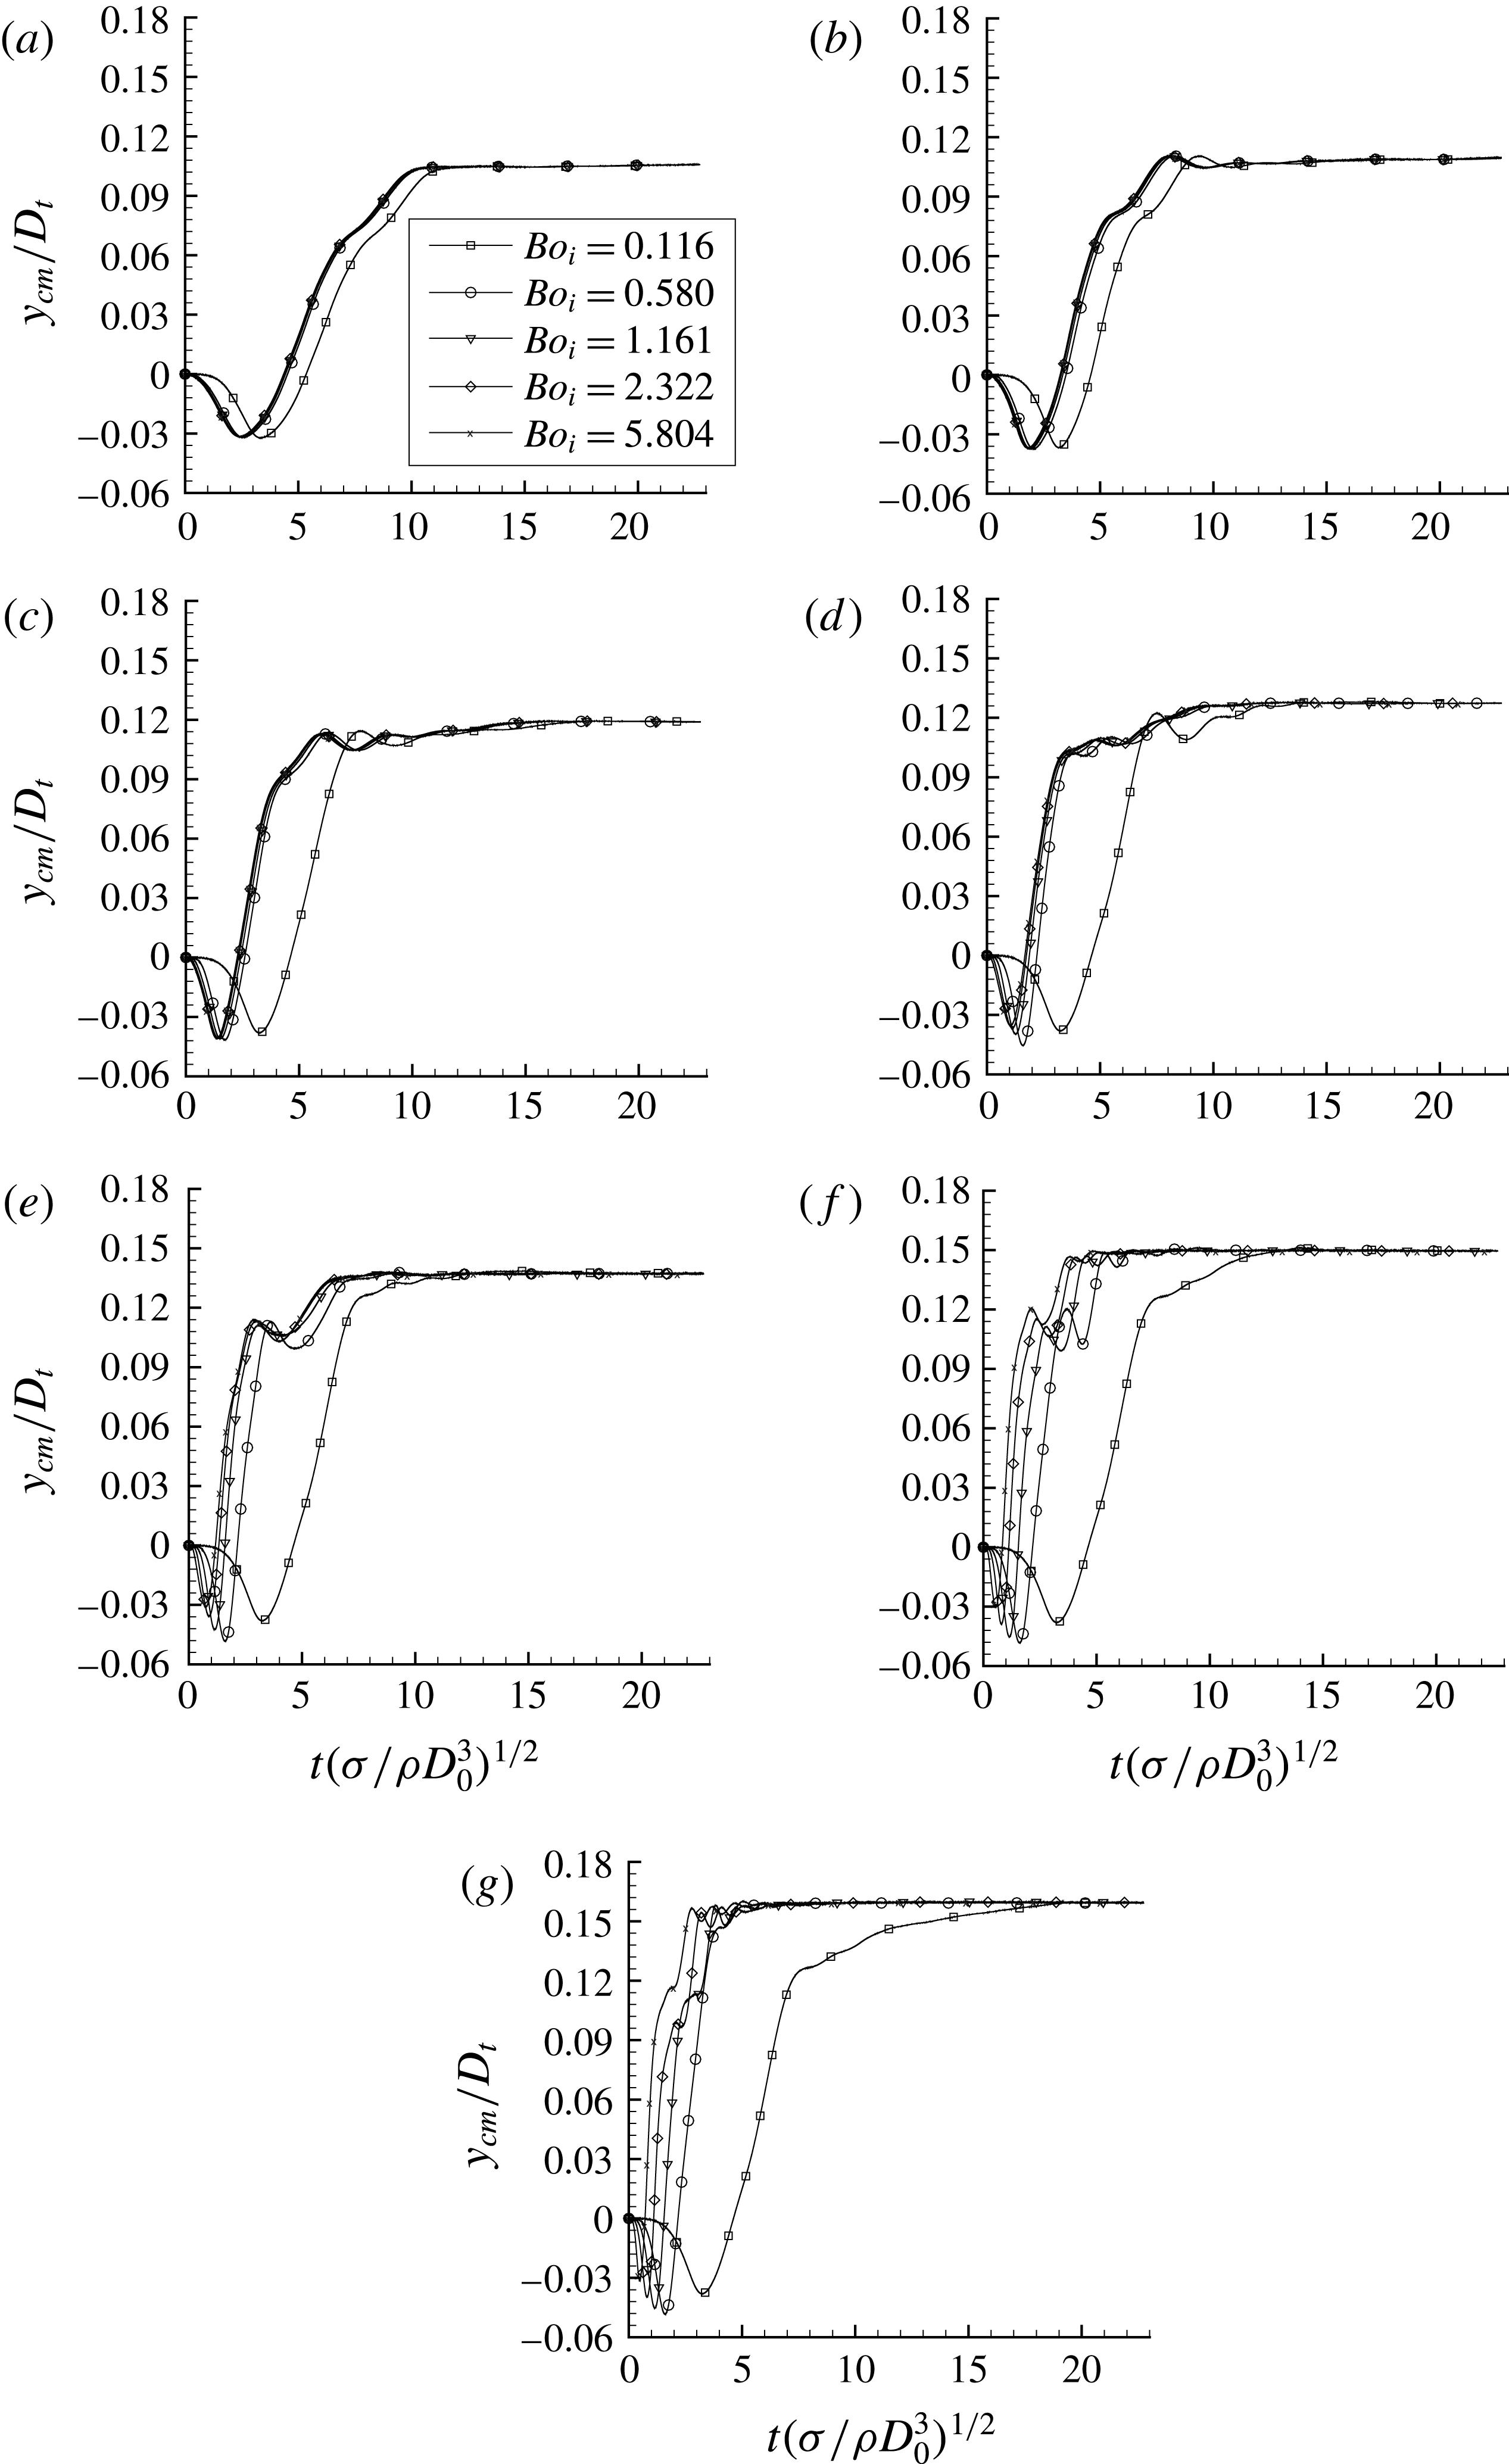
The trajectories are presented in figure 9. The evolution of each coordinate of the centre of mass throughout time is given in the Appendix.
Trajectories of the centre of mass of the fluids in the
 $xy$
-plane with
 $\unicode[STIX]{x1D70F}_{fill}=50\,\%$
, for different
 $Bo_{i}$
and
 $Bo_{c}=[0.058;0.116;0.290;0.580;1.16;2.90;5.80]$
from (a–g).

At early flow times,
 $Bo_{i}$
dominates the flow, regardless of the final value of the
 $Bo_{c}$
. As predicted by (5.1), the centre of mass moves along the opposite direction to the acceleration as
 $L\gg x$
,
 $$\begin{eqnarray}\boldsymbol{a}_{\boldsymbol{i}}\simeq -\frac{\unicode[STIX]{x1D70E}}{\unicode[STIX]{x1D70C}_{l}D_{0}^{2}L}Bo_{i}(L+y)\boldsymbol{e}_{\boldsymbol{x}}.\end{eqnarray}$$
In the case where the rotational acceleration and the rotational velocity are small, the acceleration is stopped before the bubble reaches the tank wall. The rest of the flow entirely relies on
 $Bo_{c}$
. This can be observed in figure 9(a,b), where for a given
 $Bo_{c}$
, there is no distinction between the different values of
 $Bo_{i}$
. After the end of the acceleration phase, the rest of the trajectory can be predicted by
 $$\begin{eqnarray}\boldsymbol{a}_{\boldsymbol{i}}=-\frac{\unicode[STIX]{x1D70E}}{\unicode[STIX]{x1D70C}_{l}D_{0}^{2}L}Bo_{c}(x\boldsymbol{e}_{\boldsymbol{x}}+(L+y)\boldsymbol{e}_{\boldsymbol{y}}).\end{eqnarray}$$
The deformation of the bubble during the first contact is described in § 6.2. Then the bubble stays close to the tank wall due to the
 $x\boldsymbol{e}_{\boldsymbol{x}}$
term, to finally reach its final equilibrium value (where
 $x_{cm}(t_{eq})=0$
, and
 $y_{cm}(t_{eq})$
is discussed in § 5.5).
In figure 9(c), the trajectories are similar, except for the lowest value of
 $Bo_{i}$
. In this case, the final value of
 $Bo_{c}$
is not reached before the bubble touches the tank wall. After the bounce, the terms corresponding to the angular acceleration are still not equal to zero and the centrifugal acceleration is more important in the direction
 $-\boldsymbol{e}_{\boldsymbol{x}}$
. The bubble tends to move faster to the tank wall in this direction. The parameter
 $\unicode[STIX]{x1D6FE}=Bo_{i}/Bo_{c}$
is defined to determine if the angular acceleration phase is ended before the bubble first spreads on the wall. We report that the bubble is not subjected to any
 $Bo_{i}$
contribution after the spreading of the bubble against the tank wall for
 $\unicode[STIX]{x1D6FE}>\unicode[STIX]{x1D6FE}_{lim}=2L/D_{t}$
. This limiting value
 $\unicode[STIX]{x1D6FE}_{lim}$
is obtained geometrically considering the simplified motion of the centre of mass at early flow time. This result predicts that all trajectories are similar if
 $\unicode[STIX]{x1D6FE}>\unicode[STIX]{x1D6FE}_{lim}$
. Actually, if the acceleration phase ends before the bubble reaches the tank wall, the angular velocity during the spreading is constant and identical for a given
 $Bo_{c}$
. This means that the resulting trajectory of the bubble remains similar. Yet, another phenomenon can disrupt the accuracy of this predictive parameter: when the acceleration is stopped, a capillary wave on the bubble interface is observed. This is discussed in § 6.1 on the early motion of the bubble.
In figure 9(d–g), it is shown, for a given
 $Bo_{c}$
, that the trajectories evolve depending on the
 $Bo_{i}$
. For higher values of
 $Bo_{c}$
, more potential energy is transmitted through the centrifugal acceleration to the system. As a result, for
 $Bo_{c}>0.58$
, the centre of mass of the fluids goes beyond the equilibrium point in the
 $x$
-direction. Indeed, the formulation of the inertial acceleration at this time of the flow is given by (5.3). If the centre of mass goes beyond
 $x=0$
, the inertial acceleration tends to correct it by forcing the centre of mass in the opposite direction (if
 $x_{cm}<0$
,
 $\boldsymbol{a}_{\boldsymbol{i}}\boldsymbol{\cdot }\boldsymbol{e}_{\boldsymbol{x}}>0$
, and if
 $x_{cm}>0$
,
 $\boldsymbol{a}_{\boldsymbol{i}}\boldsymbol{\cdot }\boldsymbol{e}_{\boldsymbol{x}}<0$
). This correction of the inertial acceleration is the source of an oscillatory phenomenon, discussed in § 5.4.
5.4 Oscillations of the centre of mass of the fluids upon reaching equilibrium state
Figure 9 exhibits that for high
 $Bo_{c}$
and for all the values of
 $Bo_{i}$
, an oscillatory motion appears around the
 $x$
-axis before the system stabilises. Upon reaching its equilibrium state, when the bubble goes beyond
 $x=0$
, the inertial acceleration corrects the trajectory: if
 $x_{cm}<0$
,
 $\boldsymbol{a}_{\boldsymbol{i}}\boldsymbol{\cdot }\boldsymbol{e}_{\boldsymbol{x}}>0$
and if
 $x_{cm}>0$
,
 $\boldsymbol{a}_{\boldsymbol{i}}\boldsymbol{\cdot }\boldsymbol{e}_{\boldsymbol{x}}<0$
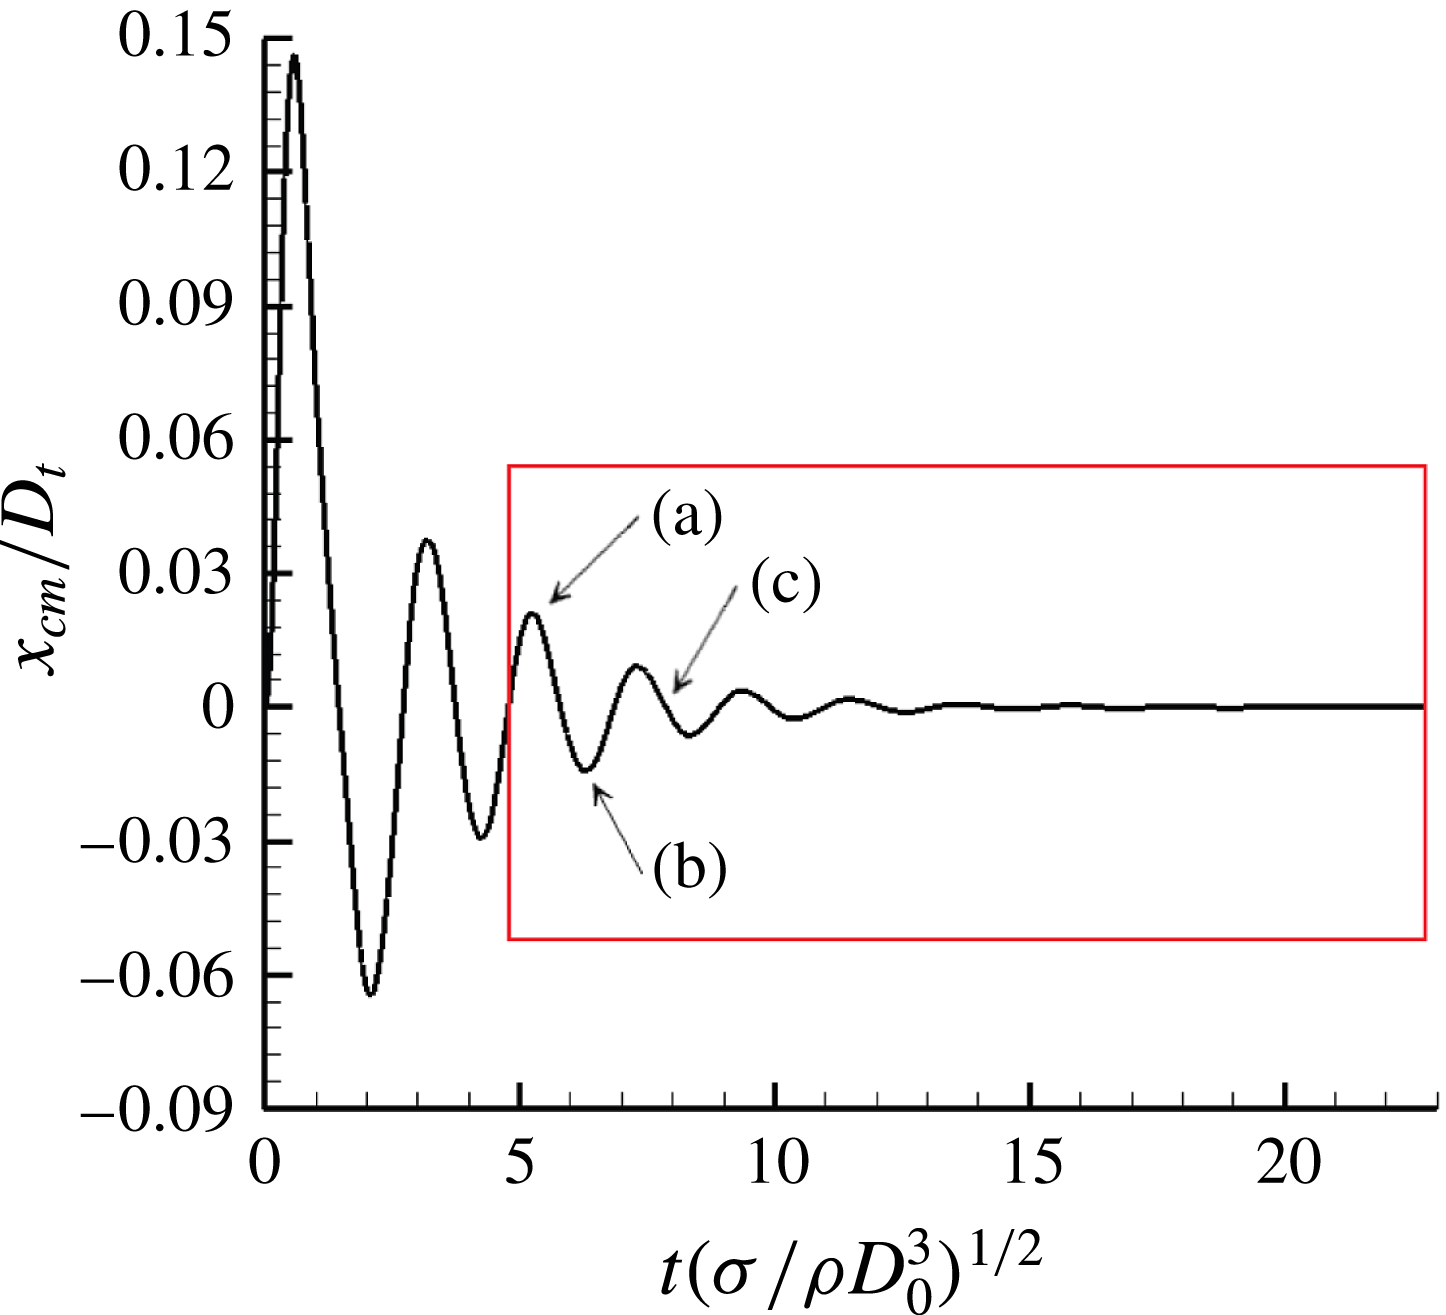
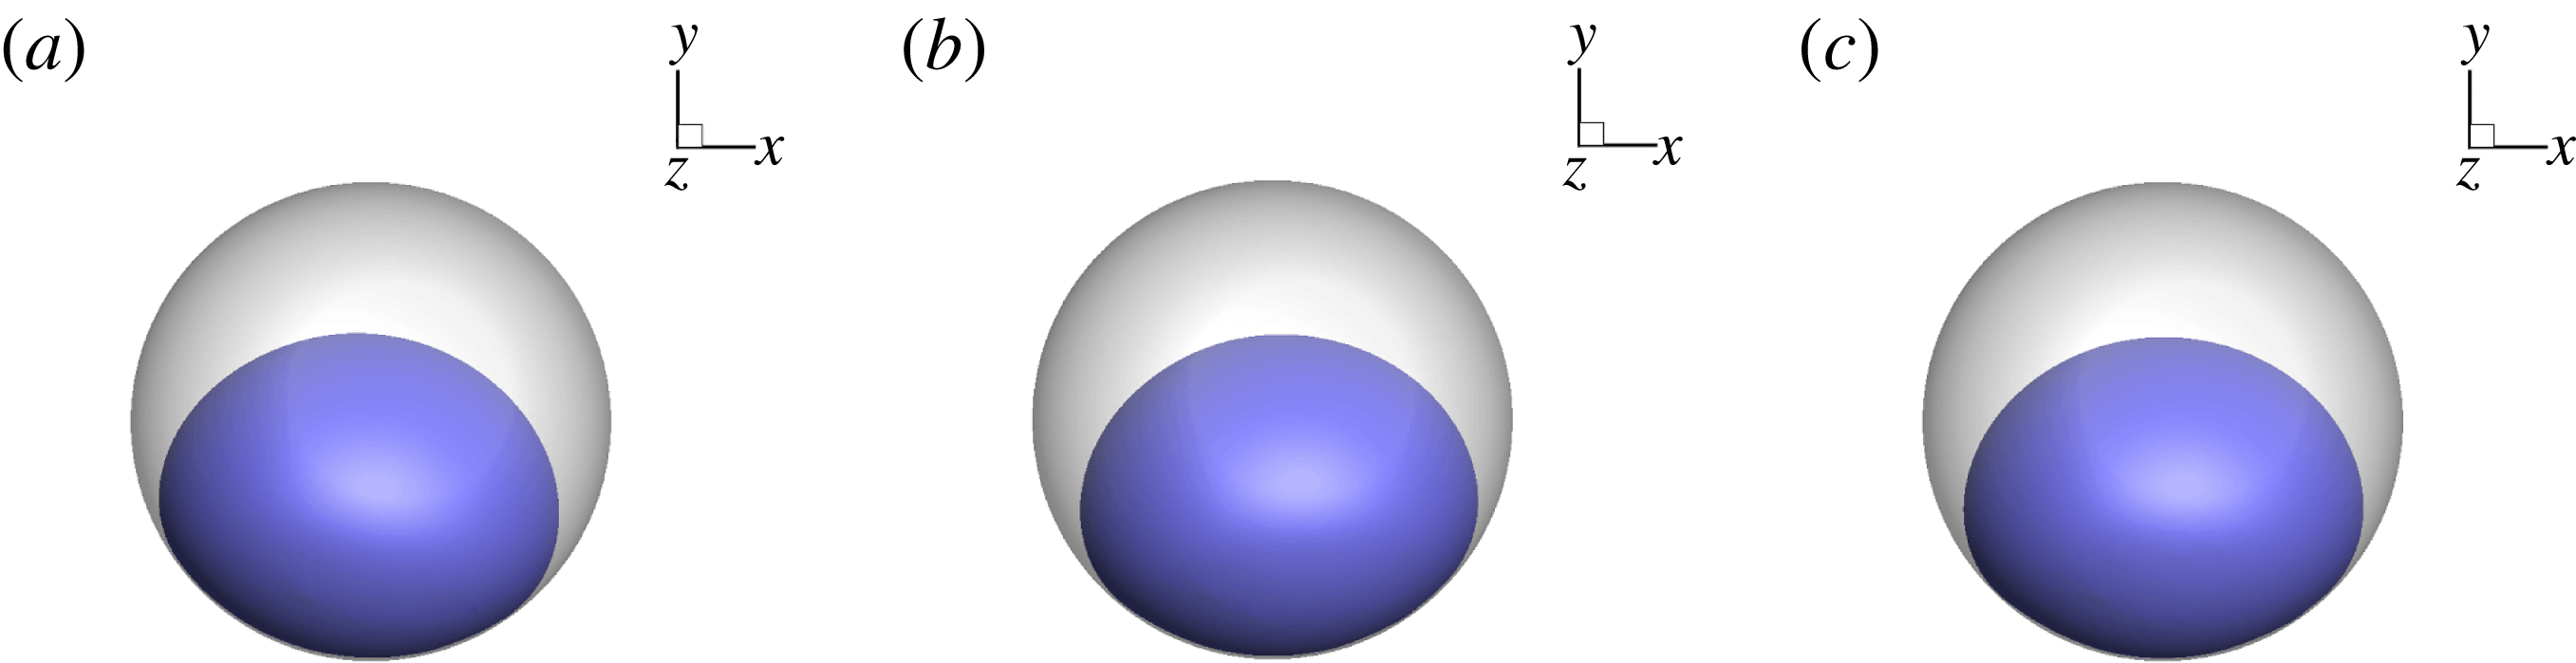
. This results in an oscillatory motion of the centre of mass, as observed in figure 10. Features of the bubble inside the tank at three different times are shown in figure 11.
Position of the centre of mass of the fluids in the
 $x$
-direction for
 $Bo_{c}=5.8$
and
 $Bo_{i}=5.8$
. The oscillation phase is circled in red.

Bubble position in the tank at three different times of the oscillation phase defined in figure 10.

The oscillatory phenomenon can be approached by the analytical model of a one-dimensional mass–spring system with a damping term described by
 $$\begin{eqnarray}\frac{\unicode[STIX]{x2202}^{2}x}{\unicode[STIX]{x2202}t^{2}}+2\unicode[STIX]{x1D709}\unicode[STIX]{x1D714}_{0}\frac{\unicode[STIX]{x2202}x}{\unicode[STIX]{x2202}t}+\unicode[STIX]{x1D714}_{0}^{2}x=0,\end{eqnarray}$$
with
 $\unicode[STIX]{x1D714}_{0}$
the natural pulsation of the mass–spring system, and
 $\unicode[STIX]{x1D709}$
a damping coefficient. The solution of this equation is
 $$\begin{eqnarray}x(t)=A_{0}\exp (-\unicode[STIX]{x1D709}\unicode[STIX]{x1D714}_{0}t)\sin (\unicode[STIX]{x1D714}t+\unicode[STIX]{x1D6F7}),\end{eqnarray}$$
with
 $\unicode[STIX]{x1D714}=\sqrt{1-\unicode[STIX]{x1D709}^{2}}\unicode[STIX]{x1D714}_{0}$
,
 $A_{0}$
the initial value of the amplitude of the oscillation, and
 $\unicode[STIX]{x1D6F7}$
the phase. Only the results for high
 $Bo_{c}$
are presented because periods are very long and are not entirely captured in the simulations with
 $Bo_{c}<1$
. Moreover, the study is limited to cases for
 $Bo_{i}>1$
because the observed oscillations are not related to the angular acceleration phase.
The parameters
 $\unicode[STIX]{x1D709}$
and
 $\unicode[STIX]{x1D714}_{0}$
are deduced from the fitting of our numerical results with (5.5) using a nonlinear least squares method and are reported in table 5. An example of the oscillation phase is circled in red in figure 10. The oscillations produced during manoeuvres with other Bond numbers are shown in figure 19(e–g) of the Appendix. It corresponds to the trajectory of the centre of mass of the fluids at the final stage of the manoeuvre when it oscillates around an equilibrium state. The two first periods of oscillations are not considered in the comparison between the theoretical model and the numerical results, because it corresponds to the early time of the manoeuvre when the bubble motion, the bouncing and the capillary waves participate in the motion.
Table 5 shows that when
 $Bo_{c}$
increases, the natural pulsation and the damping ratio also increase. Indeed, when the centrifugal acceleration is important, the bubble spreads on the wall with a high magnitude and is maintained against the wall. We observe that
 $Bo_{i}$
does not affect
 $\unicode[STIX]{x1D714}_{0}$
. In the same way, the damping ratio stays relatively close to the same value regardless of
 $Bo_{i}$
. This value depends essentially on the
 $Bo_{c}$
.
5.5 Equilibrium position of the centre of mass
As the equilibrium state is reached, the resulting position of the centre of mass of the fluids corresponds to
 $x_{cm}=0$
and differs in the
 $y$
-direction for different
 $Bo_{c}$
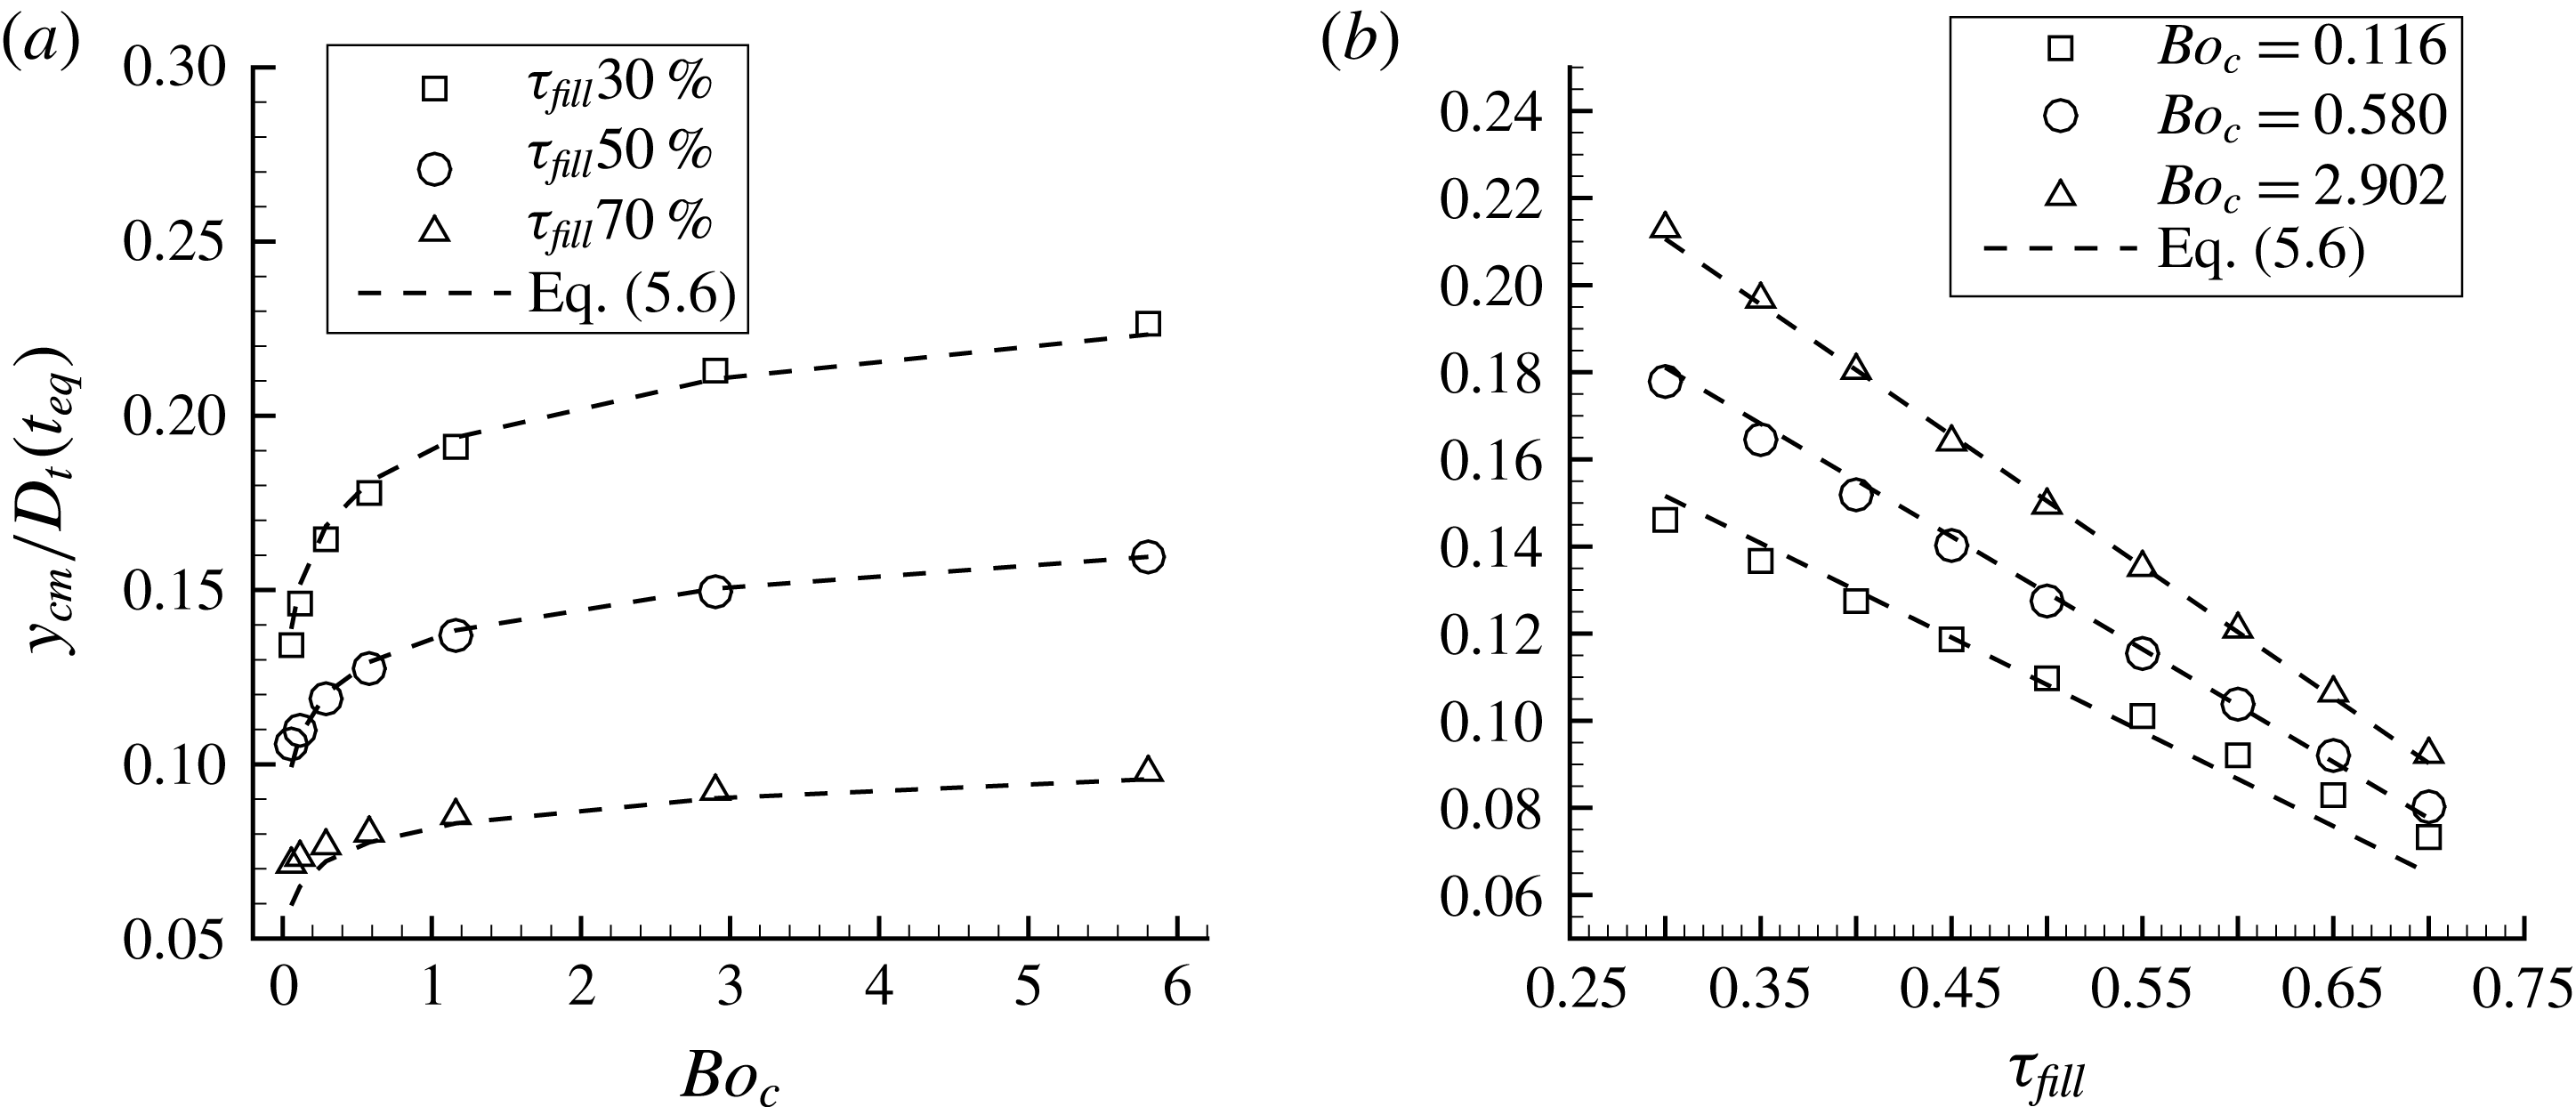
and filling ratios, as illustrated by the markers in figure 12 and plots of the Appendix. The impulsional Bond number
 $Bo_{i}$
become irrelevant in the steady state.
Position of the centre of mass of the fluids in the
 $y$
-direction for different
 $Bo_{c}$
and filling ratios.

Characteristics of the oscillatory phenomenon.

The
 $y$
-position of the centre of mass increases with the angular velocity until it approaches an asymptotic value because of the tank wall. The evolution of
 $y$
-position with the Bond number has been fitted with several functions: polynomial, exponential and logarithmic functions. We show that the best candidate is the logarithmic law. Indeed, at low Bond number, the evolution of the centre of mass is highly impacted by the Bond number because the inertial effects are lower than the surface tension effects. At higher Bond numbers, we are close to a saturation phenomenon due to the tank geometry and this leads to a weaker effect of the Bond number on the bubble shape. It is more complicated to spread an already deformed bubble. This saturation phenomenon is well depicted by the logarithmic function. On the contrary, the linear dependency on the filling ratio is clear in figure 12. It reveals that for each Bond number, the amount of liquid affects proportionally the position of the centre of mass. The position of the centre of mass in the
 $y$
-direction is denoted by
 $y_{cm}$
and estimated by
 $$\begin{eqnarray}\frac{y_{cm}}{D_{t}}(t_{eq})=C_{1}(1-\unicode[STIX]{x1D70F}_{fill})\ln (C_{2}Bo_{c}+1),\end{eqnarray}$$
where
 $\unicode[STIX]{x1D70F}_{fill}=V_{liq}/V_{tank}$
is the filling ratio of the tank,
 $C_{1}$
and
 $C_{2}$
correspond to constants obtained with a least squares method:
 $C_{1}=2.62\times 10^{-2}$
and
 $C_{2}=3.35\times 10^{4}$
in our cases. The law is plotted with dashed lines in figure 12 and gives a good approximation of the numerical results.
5.6 Force generated on the tank wall at the equilibrium state
The theoretical force
 $\boldsymbol{F}_{\boldsymbol{t}\boldsymbol{h}}(t_{eq})$
corresponds to the reaction to the centrifugal acceleration at the equilibrium state,
 $$\begin{eqnarray}\boldsymbol{F}_{\boldsymbol{t}\boldsymbol{h}}(t_{eq})=-\int _{V_{t}}\unicode[STIX]{x1D70C}\boldsymbol{a}_{\boldsymbol{i}}(t_{eq})\,\text{d}V\simeq \unicode[STIX]{x1D70C}_{l}\unicode[STIX]{x1D6FA}^{2}(L+y_{cm}(t_{eq}))V_{l}\boldsymbol{e}_{\boldsymbol{y}},\end{eqnarray}$$
with
 $\boldsymbol{a}_{\boldsymbol{i}}$
the sum of all the external accelerations,
 $V_{l}$
the volume of liquid inside the tank by neglecting
 $\unicode[STIX]{x1D70C}_{g}$
against
 $\unicode[STIX]{x1D70C}_{l}$
. The volume of liquid is deduced from the filling ratio and the tank diameter as
 $V_{l}=\unicode[STIX]{x1D70F}_{fill}V_{t}=\unicode[STIX]{x1D70F}_{fill}(\unicode[STIX]{x03C0}/6)D_{t}^{3}$
.
We can write the dimensionless force with the parameters
 $Bo_{c}$
and
 $\unicode[STIX]{x1D70F}_{fill}$
,
 $$\begin{eqnarray}\frac{\boldsymbol{F}_{\boldsymbol{t}\boldsymbol{h}}}{\unicode[STIX]{x1D70E}D_{t}}(t_{eq})\simeq \frac{\unicode[STIX]{x03C0}}{6}Bo_{c}\left(1+\frac{y_{cm}(t_{eq})}{L}\right)\frac{\unicode[STIX]{x1D70F}_{fill}}{(1-\unicode[STIX]{x1D70F}_{fill})^{2/3}}\boldsymbol{e}_{\boldsymbol{y}},\end{eqnarray}$$
with
 $D_{0}=D_{t}(1-\unicode[STIX]{x1D70F}_{fill})^{1/3}$
.
Section 5.5 exhibits that the final position of the centre of mass of the fluids
 $y_{cm}(t_{eq})$
depends on
 $Bo_{c}$
and
 $\unicode[STIX]{x1D70F}_{fill}$
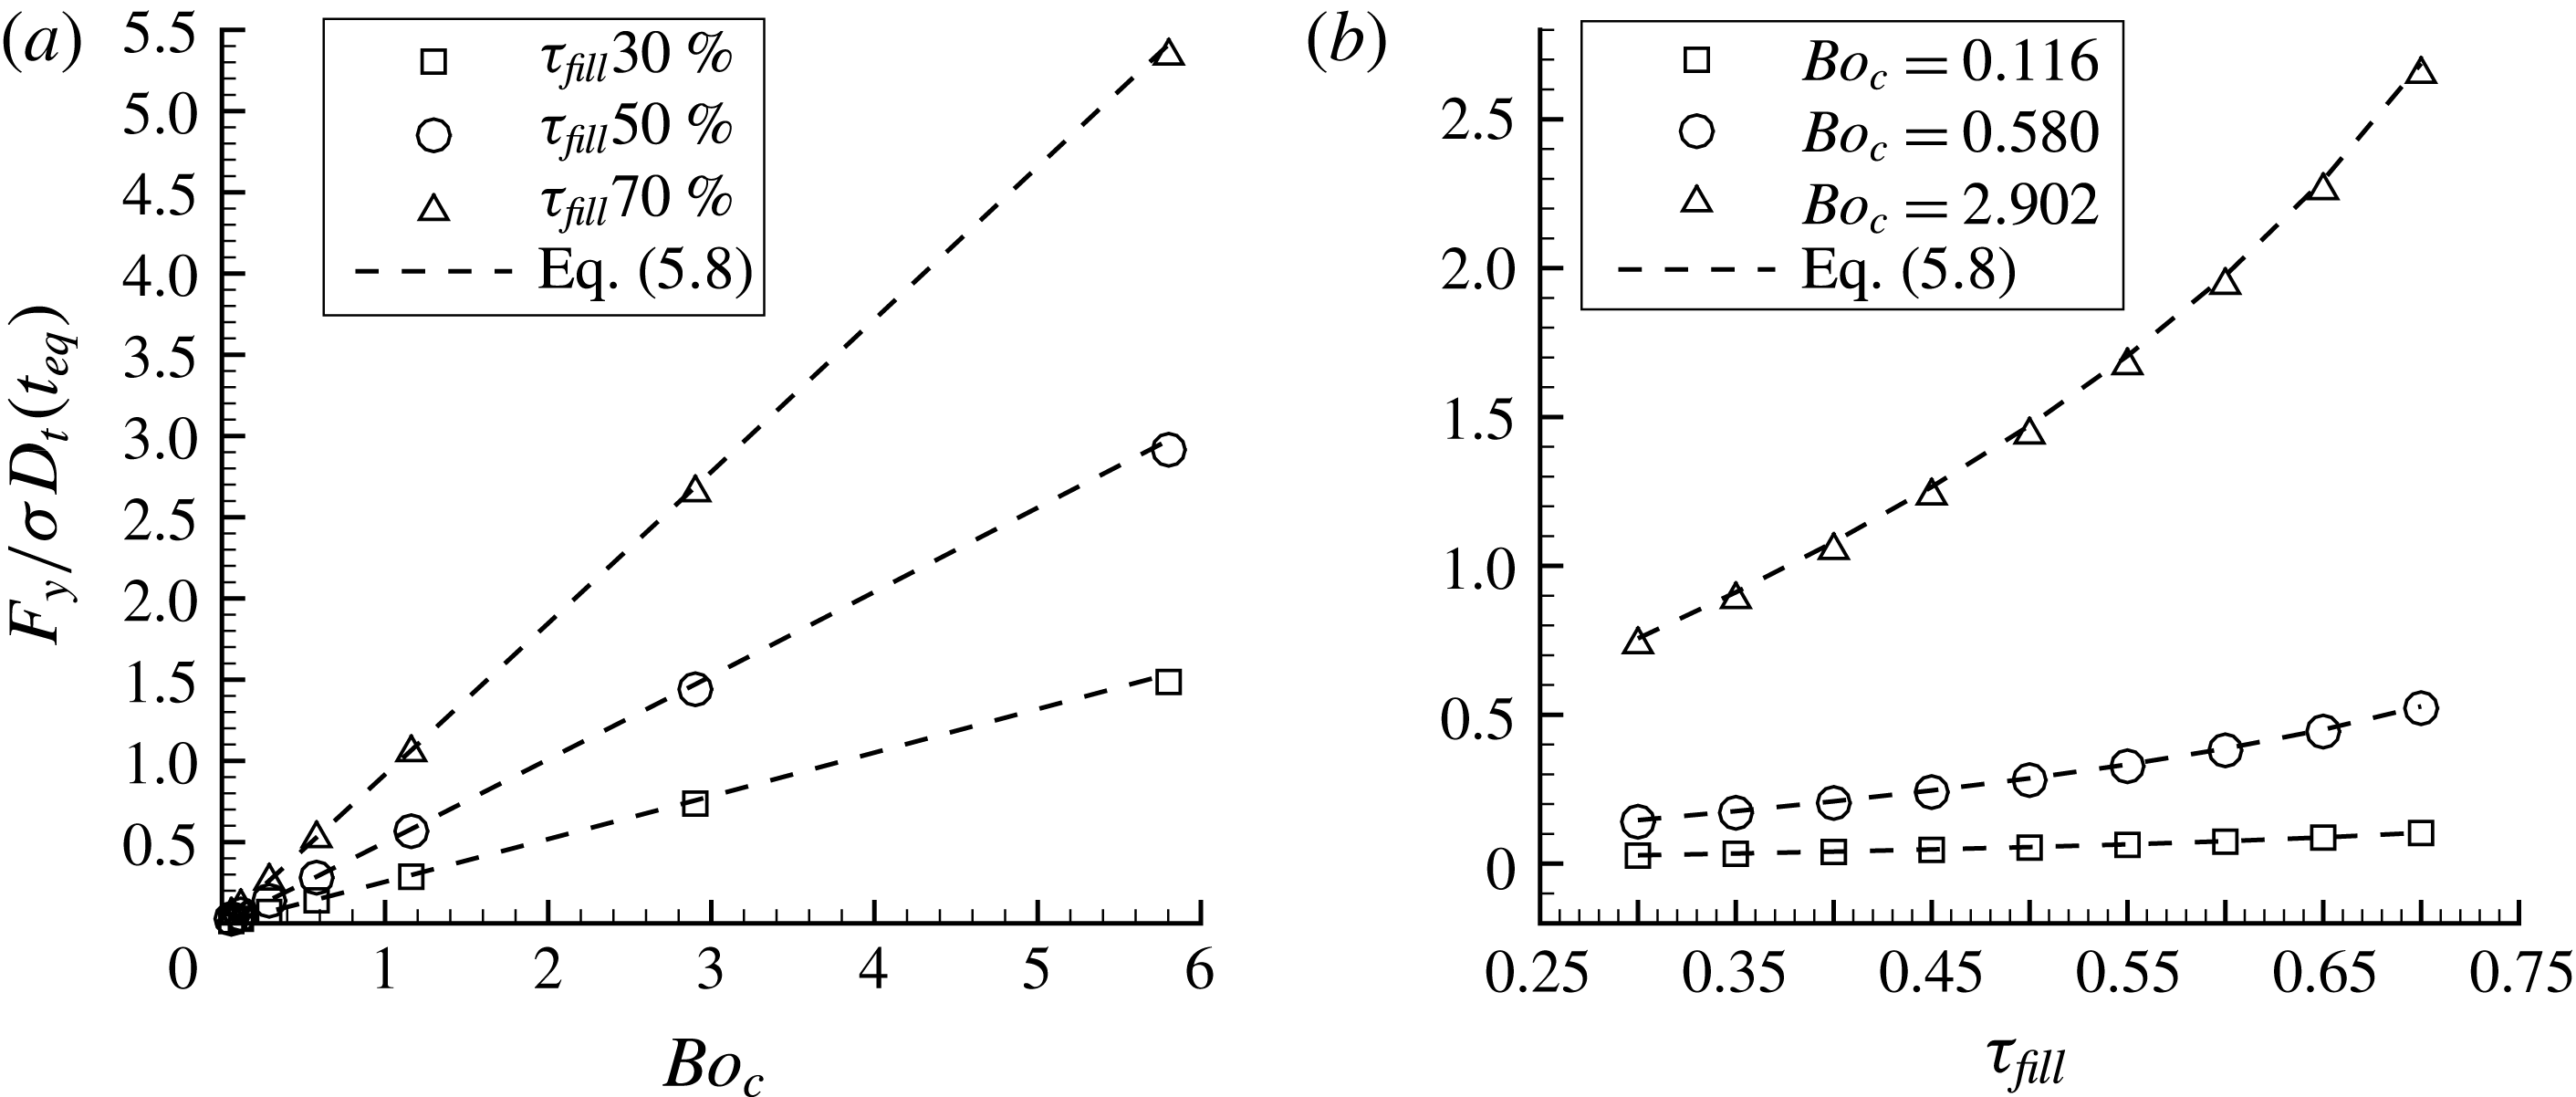
. We must consider the data in figure 12 or the approximation of (5.6) to obtain the force generated on the tank wall. In our numerical simulations, the integration of the pressure inside the tank (see (4.1)), allows deducing the value of the force in the
 $y$
-direction at the equilibrium state. This computed force and the theoretical force of (5.8) are plotted, respectively with symbols and dashed lines, in figure 13.
Evolution of the
 $y$
-direction generated force, for different
 $Bo_{c}$
and filling ratios.

We observe that the force evolves linearly with the Bond number and as a power law with the filling ratio. Indeed, the centrifugal force depends directly on the square of the angular velocity and the mass of the fluid inside the tank. Finally, the approximations given by (5.6) and (5.8) give really close results with the computed force.
6 Evolution of the bubble shape
This section is focused on the bubble shape, from the initial sphere located at the centre of the tank until its equilibrium shape spread against the tank wall. First, the capillary wave, observed for some configurations, is described through the variation of the bubble surface. Then, the bubble behaviour is analysed during the first contact with the tank wall for several pairs of Bond number. Finally, the description of the equilibrium shape of the bubble, as its spreading diameter and its thickness, is done for different values of
 $Bo_{c}$
and
 $\unicode[STIX]{x1D70F}_{fill}$
.
Similarly than § 5, the two first subsections consider a filling ratio of 50 % and the Bond numbers summarised in tables 1 and 2. The last subsection does not deal with
 $Bo_{i}$
and investigates the influence of the filling ratios listed in table 4.
6.1 Capillary wave
During the transient regime, different phenomena can be observed, such as a capillary wave on the liquid–gas interface when the angular acceleration
 $\dot{\unicode[STIX]{x1D6FA}}$
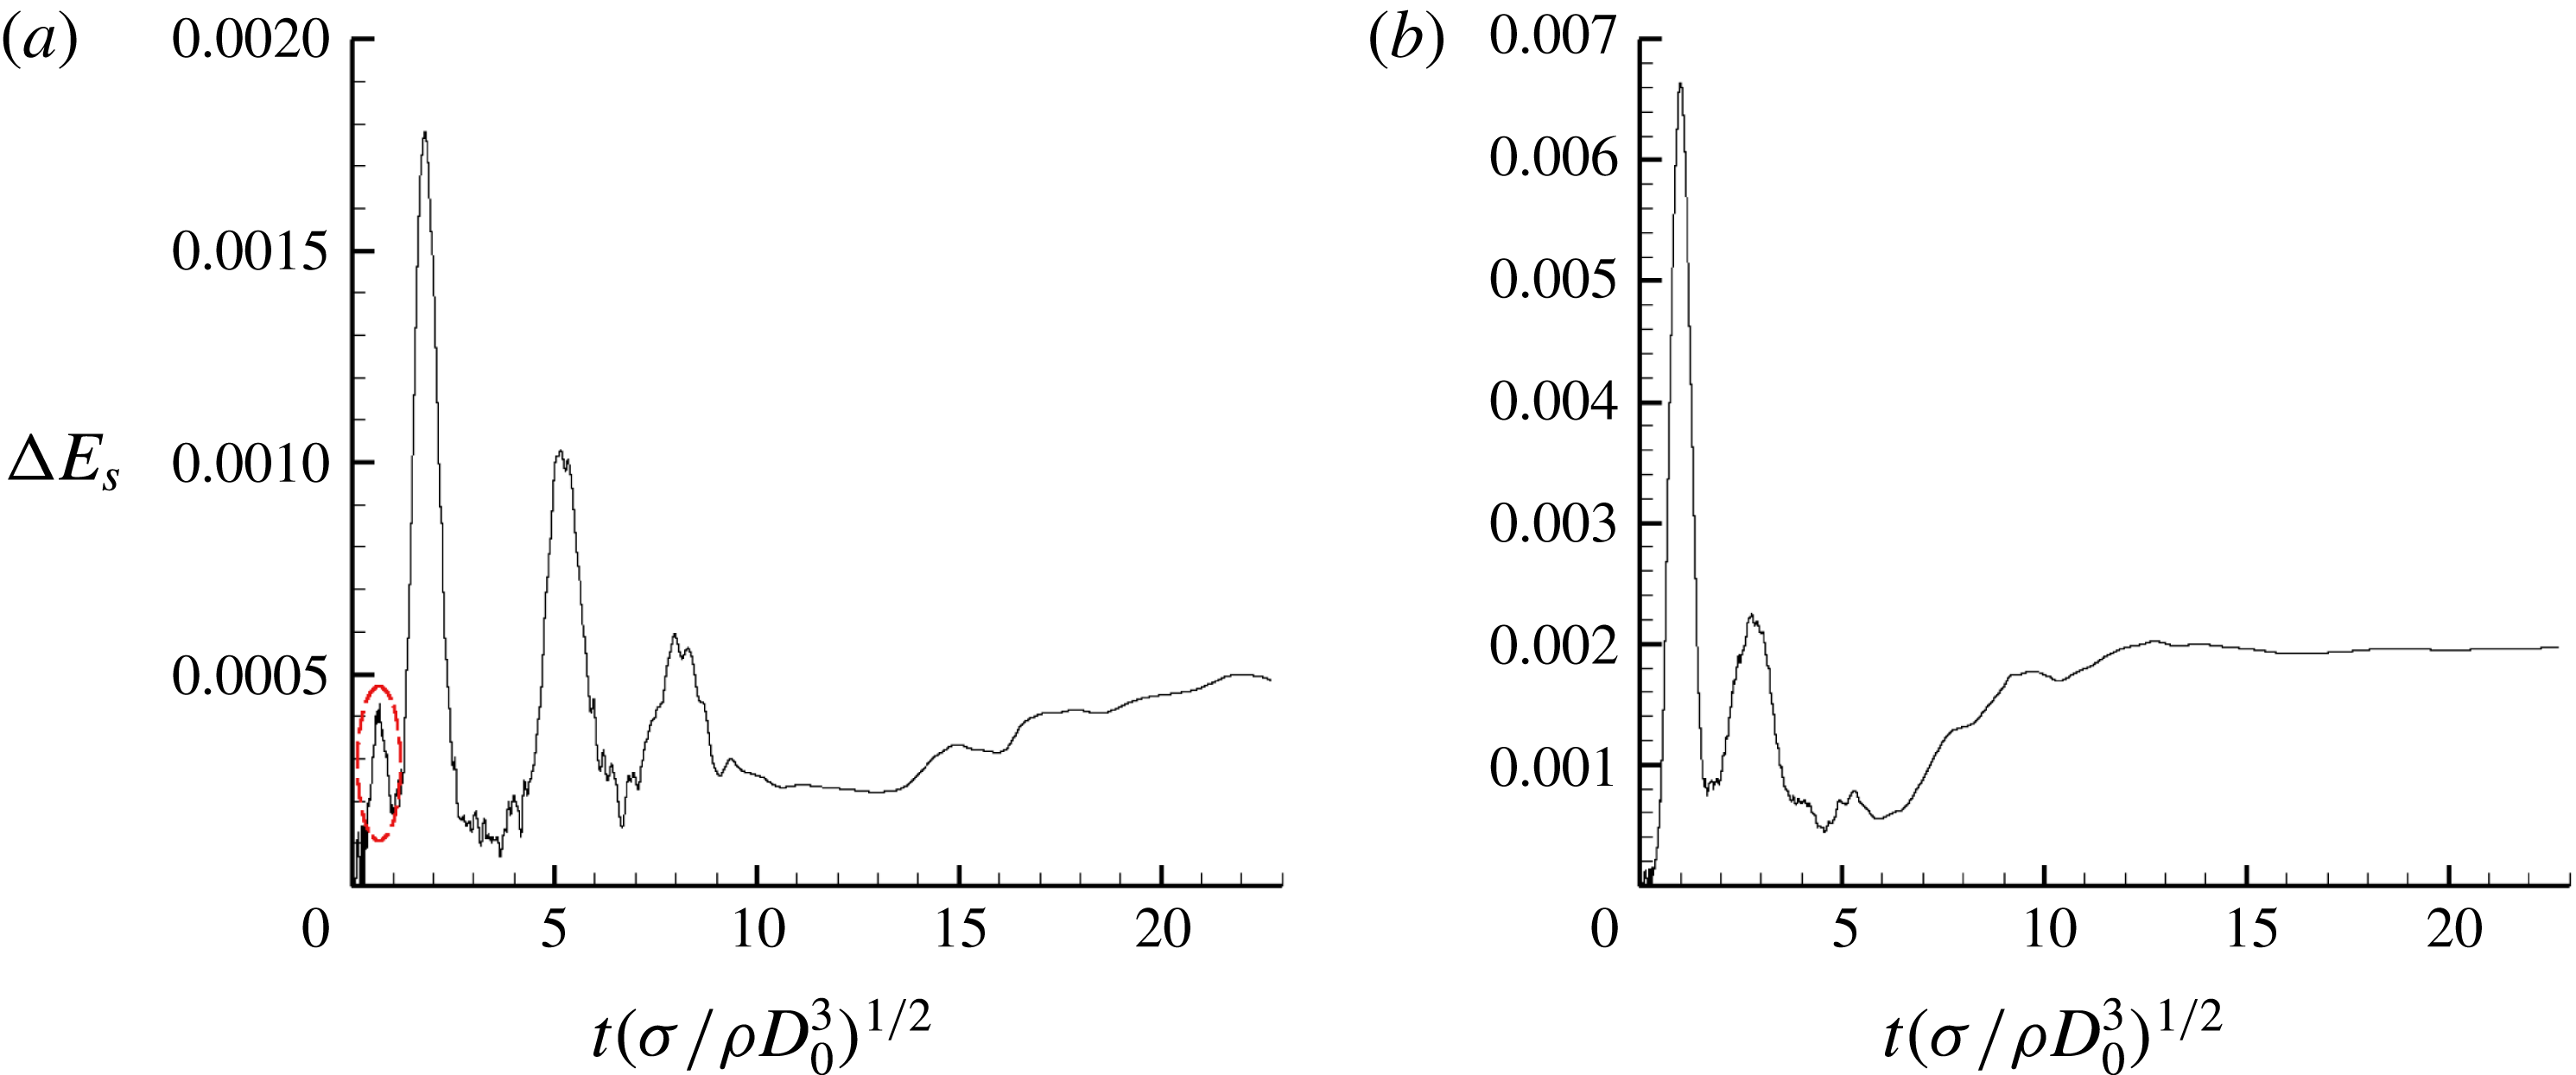
stops, or when the bubble reaches the tank wall and spreads on it. The deformation of the bubble is analysed by considering the temporal evolution of the dimensionless surface energy variation
 $\unicode[STIX]{x0394}E_{s}(t)$
defined by
 $$\begin{eqnarray}\unicode[STIX]{x0394}E_{s}(t)=\frac{E_{s}(t)-E_{s}(t_{0})}{E_{s}(t_{0})}.\end{eqnarray}$$
For low values of
 $Bo_{c}$
and
 $Bo_{i}$
, a first variation of the surface energy is observed before the bubble reaches the tank wall, as depicted in figure 14(a), whereas it does not appear for higher
 $Bo_{c}$
values, as in figure 14(b). This variation is generated by
 $Bo_{i}$
evolving from its original value to zero as the final centrifugal velocity is reached. This time is denoted by
 $t_{cw}$
thereafter. The frequency of this capillary wave is equal to the Rayleigh frequency
 $f_{R}$
, defined by
 $$\begin{eqnarray}f_{R}=\sqrt{\frac{\unicode[STIX]{x1D70E}}{\unicode[STIX]{x1D70C}_{l}D_{0}^{3}}}.\end{eqnarray}$$
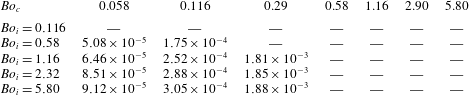
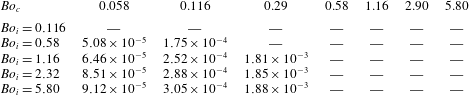
Table 6 contains the amplitude of the variation of the surface energy due to capillary waves for different
 $Bo_{c}$
and
 $Bo_{i}$
, when measurable. From these data, we can conclude that
 $Bo_{c}$
has a great influence on the amplitude of the capillary wave. Moreover, increasing
 $Bo_{i}$
tends to approach
 $\unicode[STIX]{x0394}E_{s}(t_{cw})$
to an asymptotic value depending on
 $Bo_{c}$
. For the lower value of
 $Bo_{i}$
, the amplitude is too low to be measurable. This phenomenon also occurs for higher values of
 $Bo_{c}$
, probably with a stronger amplitude, but as the bubble has already reached the tank wall it cannot be accurately measured when
 $\unicode[STIX]{x1D6FE}<\unicode[STIX]{x1D6FE}_{lim}$
.
Evolution of the surface energy of the interface of the bubble for
 $Bo_{i}=1.16$
, (a)
 $Bo_{c}=0.116$
with the capillary deformation circled in red and (b)
 $Bo_{c}=0.58$
.

Variation of the dimensionless surface energy at the capillary wave
 $\unicode[STIX]{x0394}E_{s}(t_{cw})$
when measurable, and — otherwise.
6.2 First bounce of the bubble
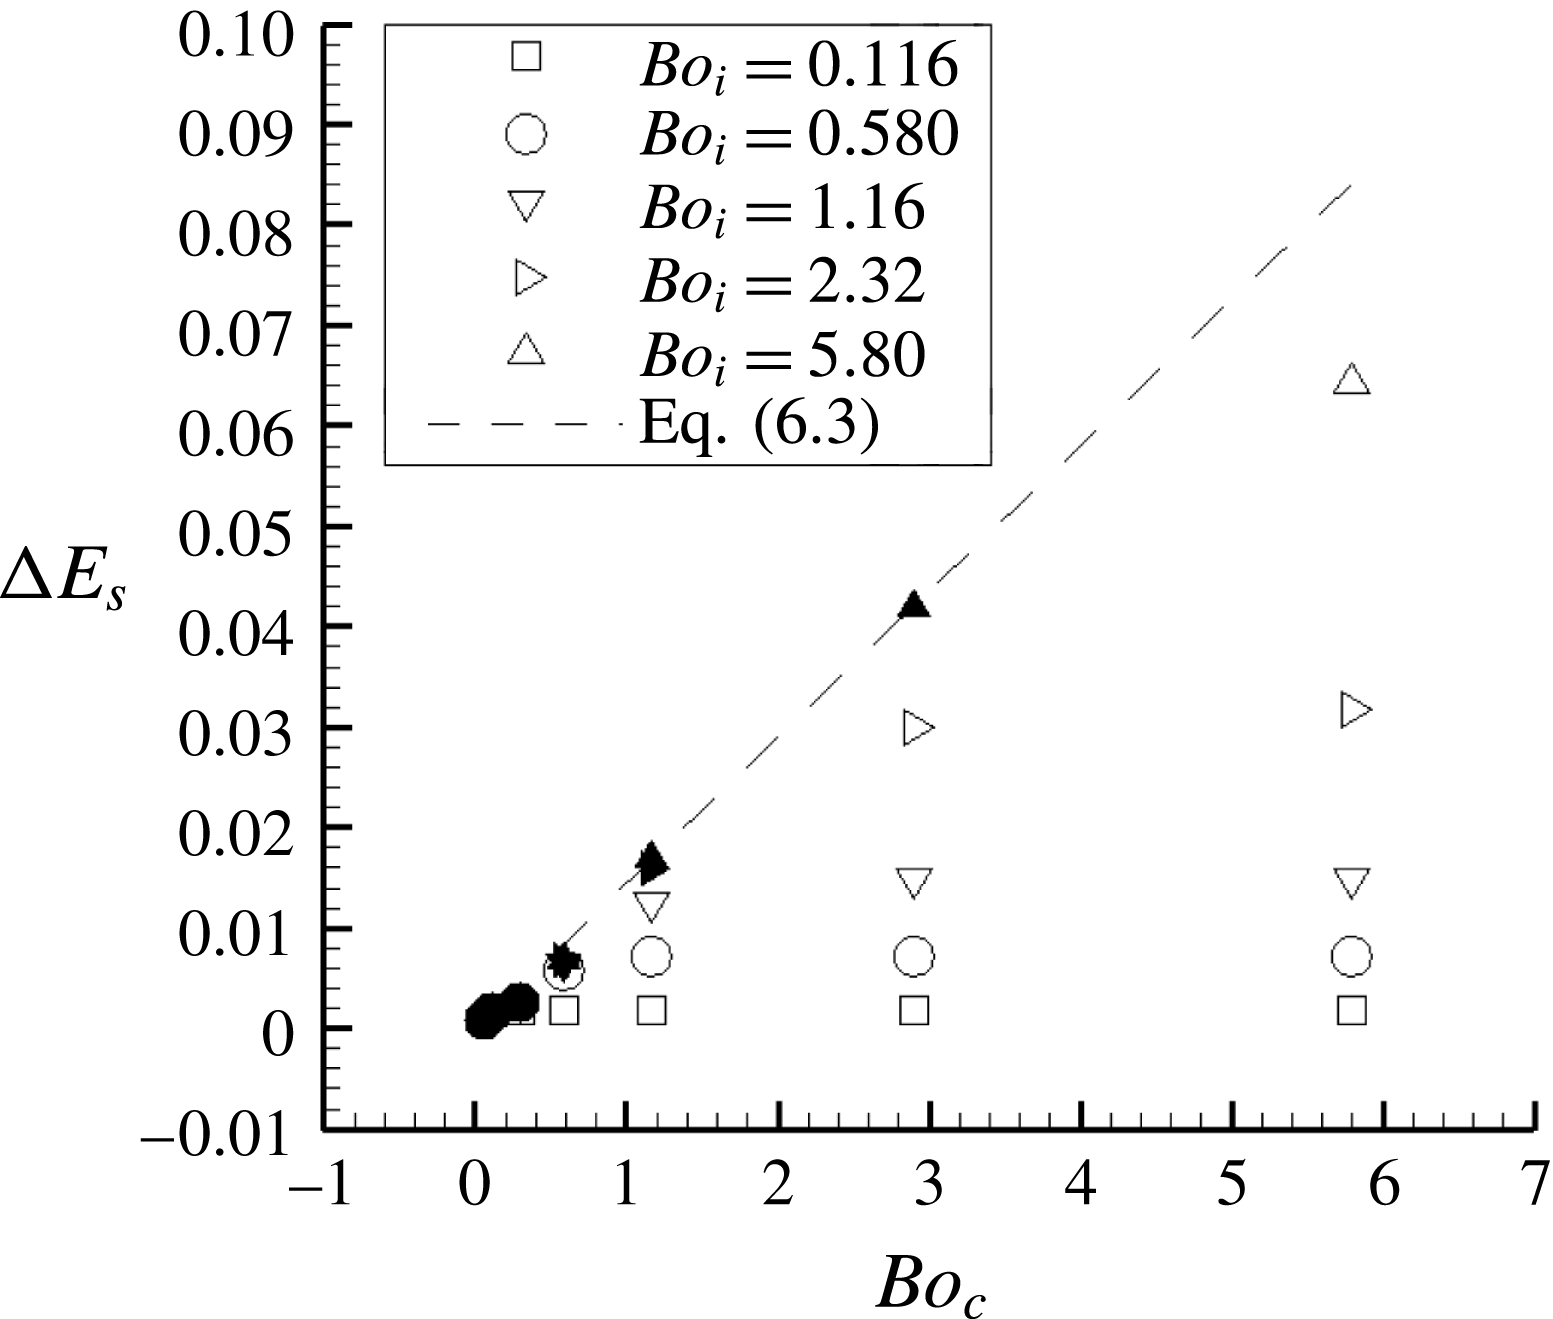
When the bubble reaches the tank wall, its deformation leads to a sharp increase of the variation of the dimensionless surface energy of the bubble. The highest peaks in figure 14 correspond to several spreadings of the bubble on the tank wall. The first spreading on the wall has the greatest magnitude and, for all cases, the maximum of the surface energy variation at that time are presented in figure 15.
The dimensionless surface energy variation follows a linear evolution in cases for which the acceleration phase ends before the bubble reaches the tank wall for the first time. These configurations correspond to
 $\unicode[STIX]{x1D6FE}>\unicode[STIX]{x1D6FE}_{lim}$
and it can be approximated by
 $$\begin{eqnarray}\unicode[STIX]{x0394}E_{s}(t_{b})=0.0145Bo_{c},\end{eqnarray}$$
with
 $t_{b}$
is the time of the bouncing defined as
 $\max (E_{s}(t))=E_{s}(t_{b})$
.
In the same way as for the trajectories,
 $Bo_{i}$
does not seem to influence the spreading of the bubble on the tank wall when
 $\unicode[STIX]{x1D6FE}>\unicode[STIX]{x1D6FE}_{lim}$
. The constant velocity phase remains similar for a given
 $Bo_{c}$
which leads to a similar deformation on the wall. In the case where
 $\unicode[STIX]{x1D6FE}\leqslant \unicode[STIX]{x1D6FE}_{lim}$
, figure 15 shows that the maximum of the dimensionless surface energy variation reaches a limiting value for each
 $Bo_{i}$
. Indeed, for a given centrifugal acceleration, the same angular velocity is reached during the spreading of the bubble and thus the same amount of momentum is introduced into the system. This explains that
 $Bo_{c}$
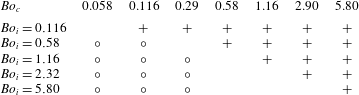
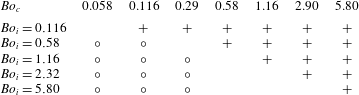
does not influence the spreading as long as the acceleration phase is in progress. A summary of the phenomena observed at early flow time is proposed in table 7.
Maximum variation of the surface energy of the bubble interface at the first bounce. Filled markers correspond to
 $\unicode[STIX]{x1D6FE}>\unicode[STIX]{x1D6FE}_{lim}$
and empty markers to
 $\unicode[STIX]{x1D6FE}\leqslant \unicode[STIX]{x1D6FE}_{lim}$
.

Summary of early flow time phenomena:
 $\circ$
for configurations when the capillary wave is clearly observed,
 $+$
for
 $\unicode[STIX]{x1D6FE}<\unicode[STIX]{x1D6FE}_{lim}$
.
6.3 Shape of the bubble at the equilibrium state
In this section, the final shape of the bubble is described and analysed, with the spreading diameter
 $D_{b}$
and the thickness of the bubble
 $y_{b}$
. Depending on the centrifugal Bond number
 $Bo_{c}$
and the filling ratio
 $\unicode[STIX]{x1D70F}_{fill}$
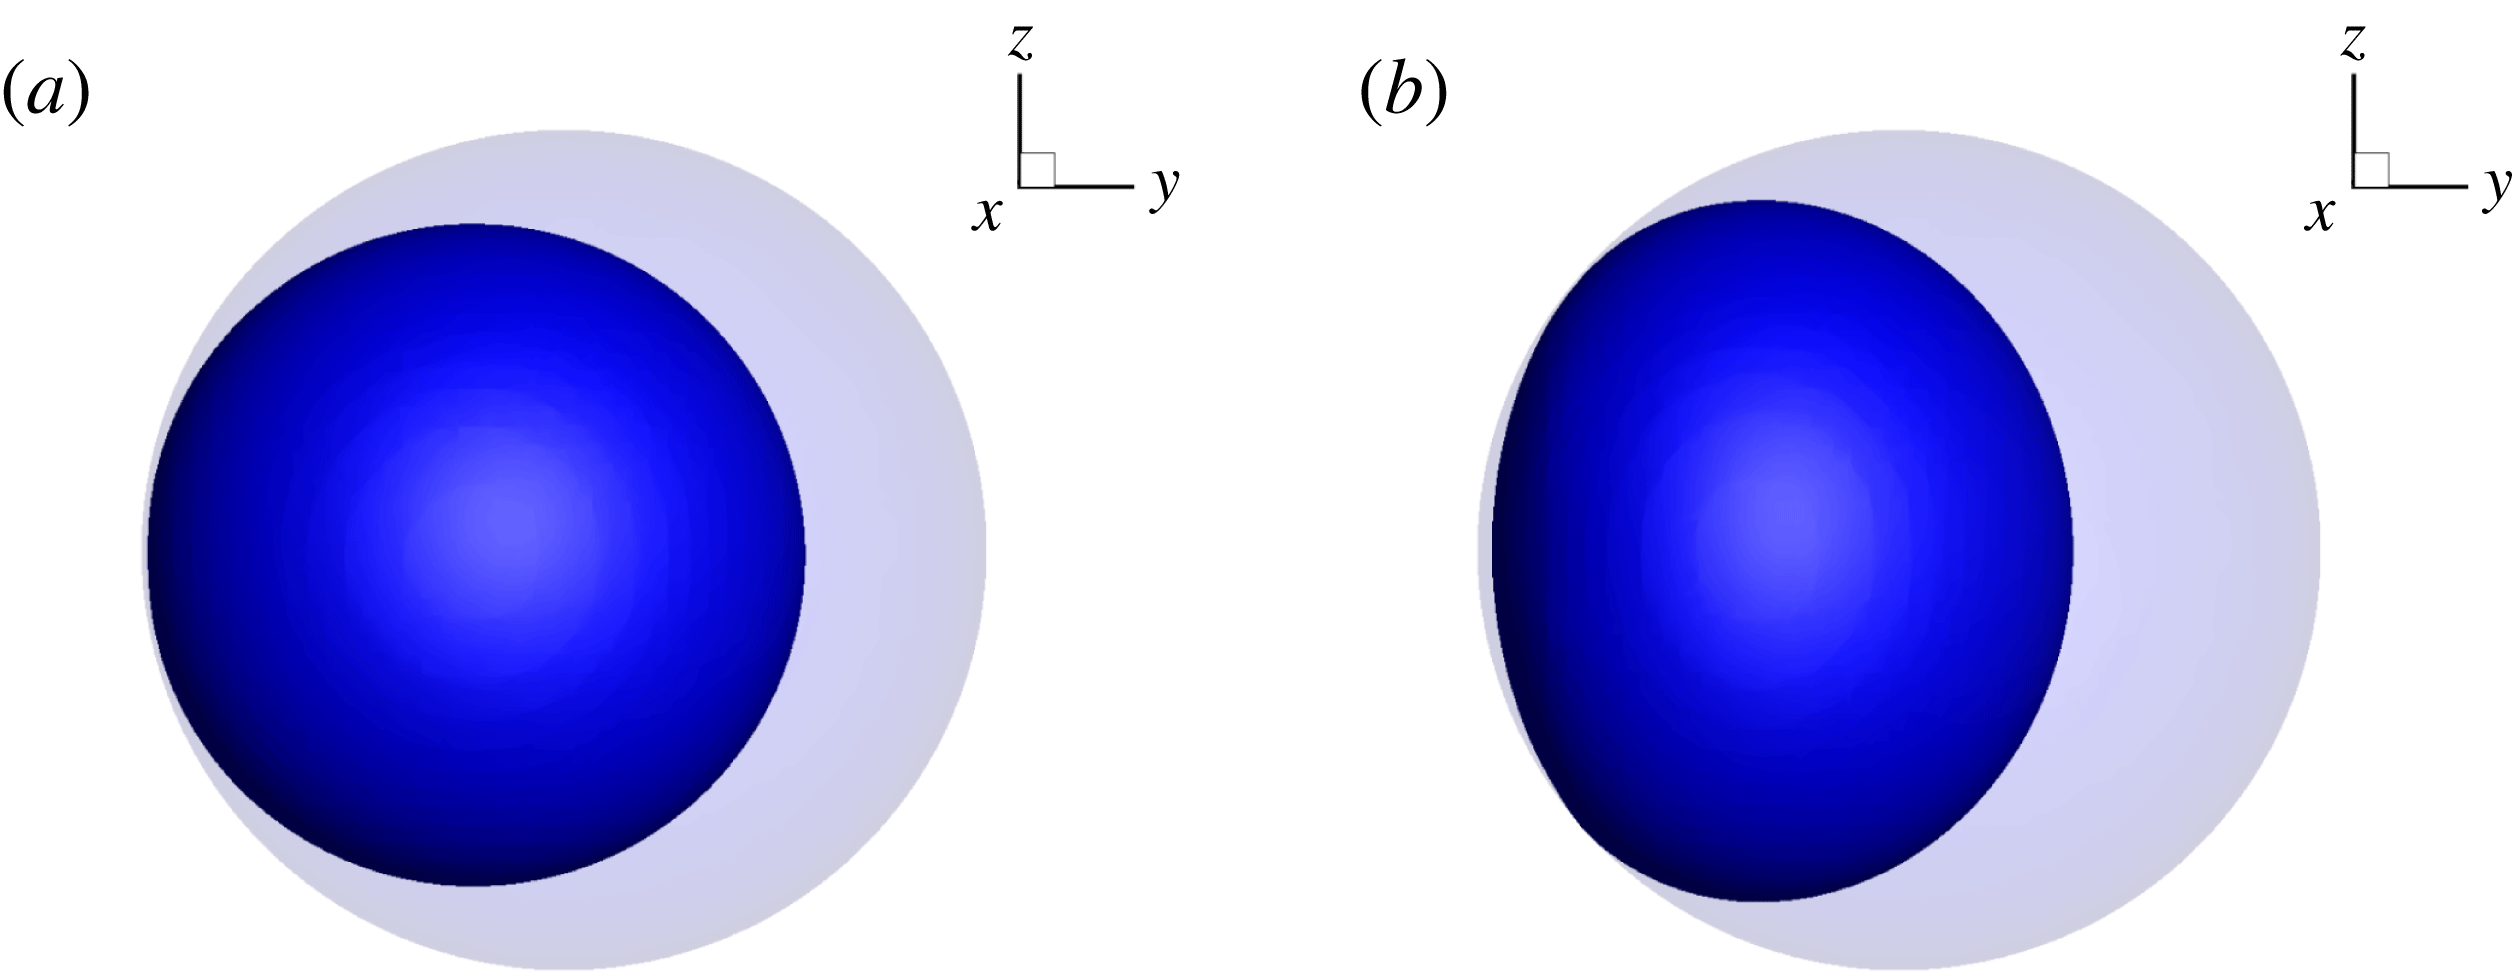
, the shape of the bubble can change, as observed in figure 16. We note that the third parameter
 $Bo_{i}$
has no influence in the equilibrium state. An increase of
 $Bo_{c}$
leads to an important spreading of the bubble on the tank wall and a shrinking of its thickness. Because of the variation of the filling ratio in our numerical simulations, these parameters are divided by the initial diameter of the bubble to become dimensionless
 $D_{0}=D_{t}(1-\unicode[STIX]{x1D70F}_{fill})^{1/3}$
.
Final shape of the bubble for (a)
 $Bo_{c}=0.116$
and (b)
 $Bo_{c}=5.8$
, with
 $\unicode[STIX]{x1D70F}_{fill}=50\,\%$
.

Evolution of the thickness of the bubble, for different
 $Bo_{c}$
and filling ratios.

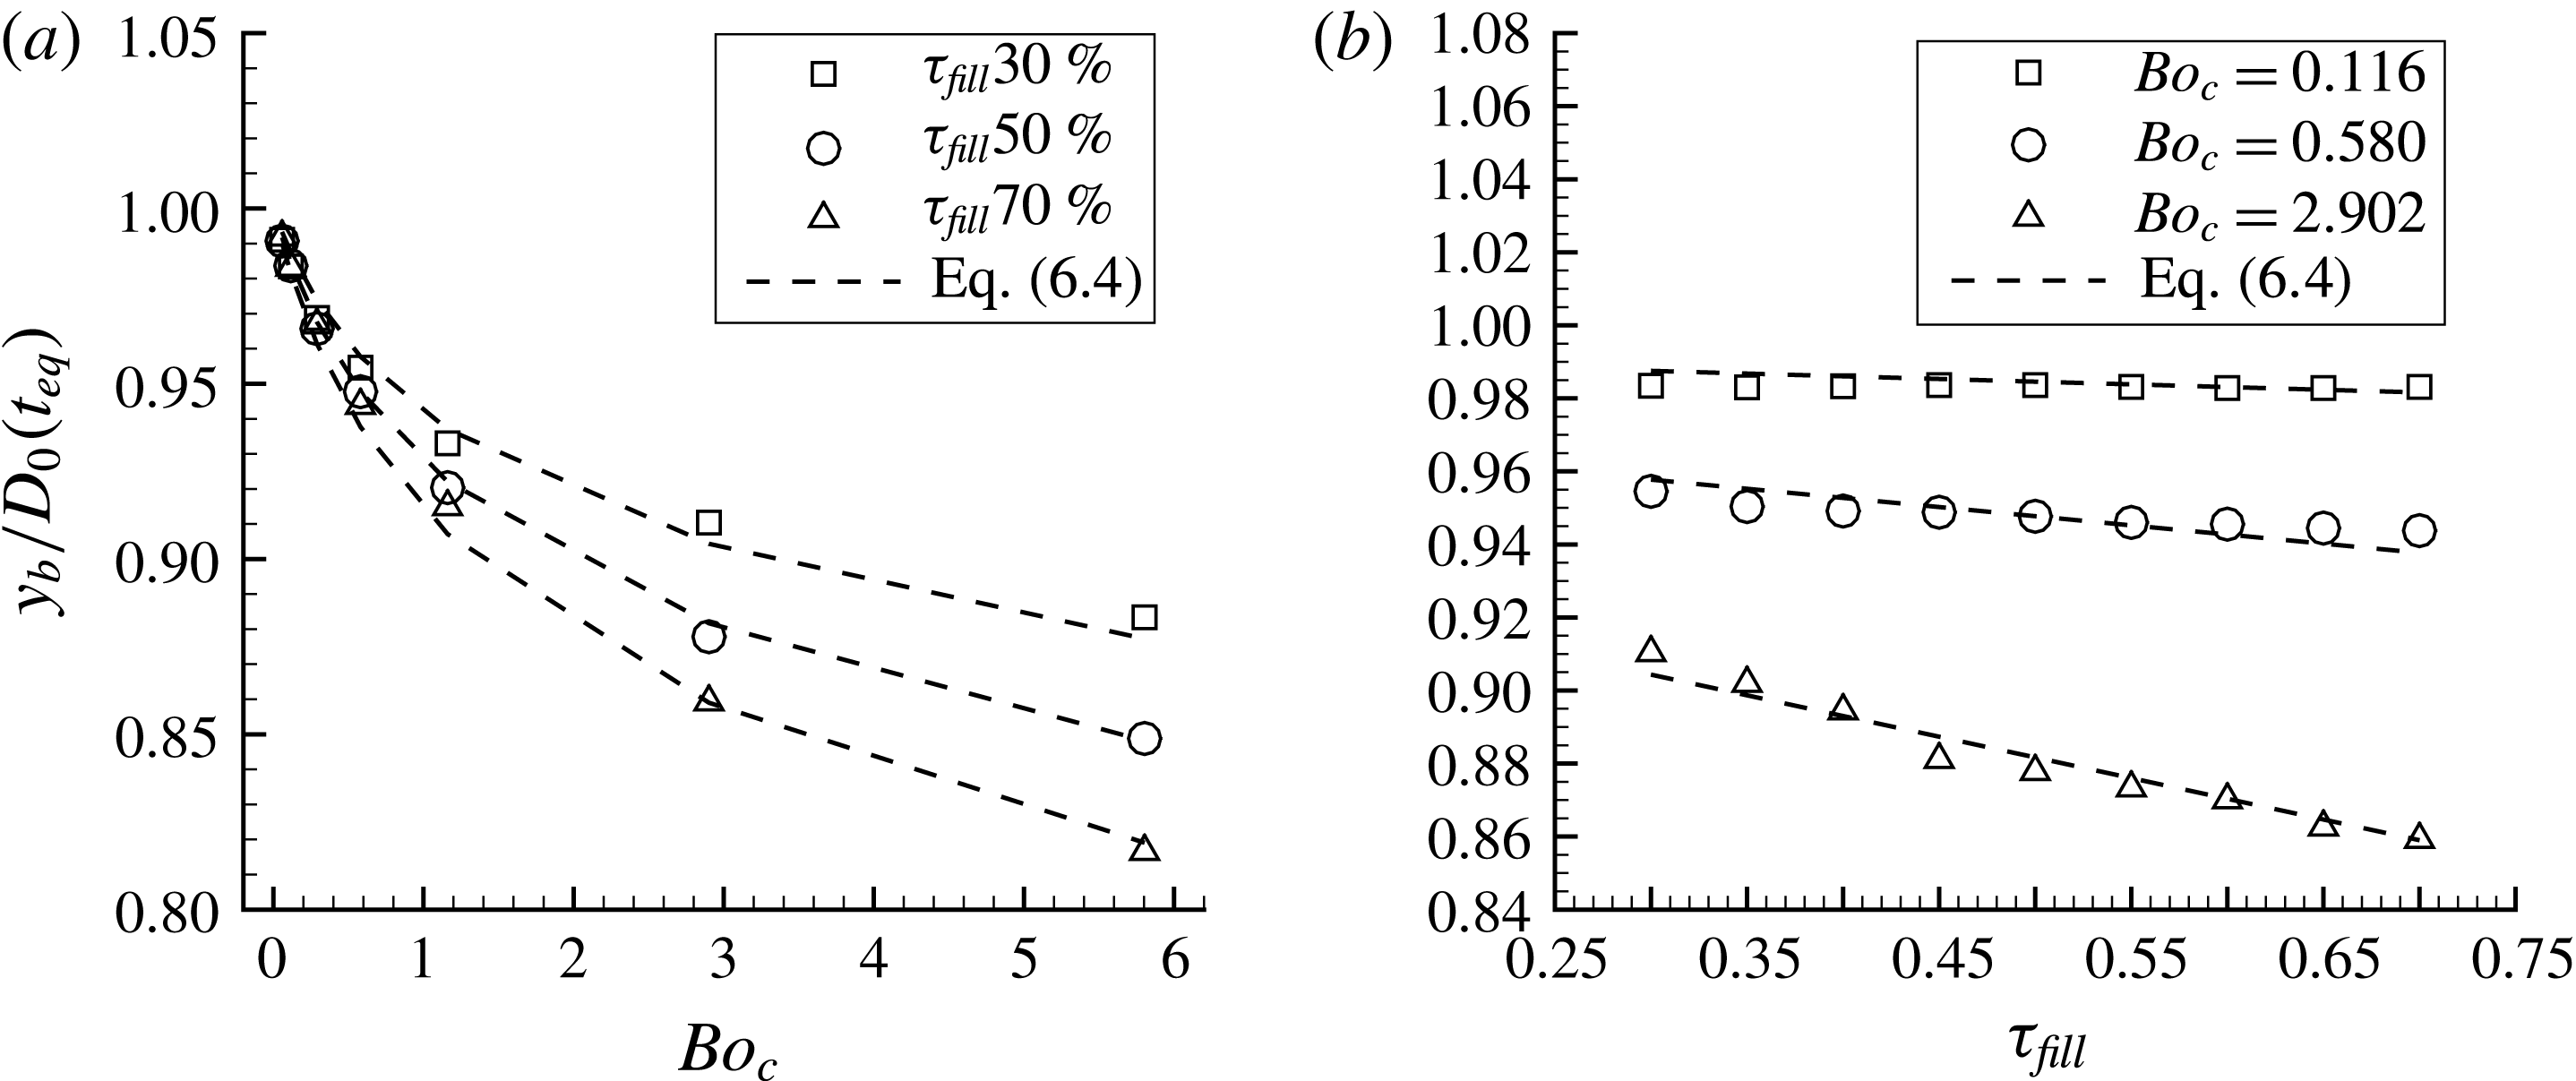
The dimensionless thickness of the bubble is represented with symbols in figure 17 for different values of the filling ratio and the Bond number. First, for
 $Bo_{c}<0.58$
, the thickness decreases with the Bond number linearly and is not modified by the filling ratio. This corresponds to the first regime when the surface tension is dominant and the deformation of the bubble is small. For
 $Bo_{c}>0.58$
, the thickness of the bubble keeps decreasing with the Bond number but with a slower magnitude. This case, where the inertial effects must be considered, corresponds to the second regime. As already seen in § 5.5, the thickness evolution has been approached with several functions and the logarithmic function has given the best to fit the data. The same saturation effect, like the position of the centre of mass, limits the influence of the Bond number on the bubble shape. The thickness tends toward an asymptotic value for high
 $Bo_{c}$
because of the size of the tank. This limit depends on the filling ratio as we can see on the left plot of figure 17. Indeed, when
 $\unicode[STIX]{x1D70F}_{fill}<0.5$
, the bubble equilibrium thickness approaches its initial value. For
 $\unicode[STIX]{x1D70F}_{fill}>0.5$
, the bubble is small compared to the tank and spreads with a higher magnitude on the wall. For each Bond number, the thickness of the bubble evolves linearly with the filling ratio. The dimensionless bubble thickness is approached by
 $$\begin{eqnarray}\frac{y_{b}}{D_{0}}(t_{eq})=1+(C_{3}+C_{4}\unicode[STIX]{x1D70F}_{fill})\ln (C_{5}Bo_{c}+1),\end{eqnarray}$$
with
 $C_{3}=-2.73\times 10^{-2}$
,
 $C_{4}=-5.02\times 10^{-2}$
and
 $C_{5}=2.95$
in our simulations.
This equation allows us to predict the behaviour of the bubble thickness with the Bond number and filling ratio for the two regimes. Equation (6.4) is plotted with dashed lines in figure 17.
Evolution of the thickness of the bubble, for different
 $Bo_{c}$
and filling ratios.

The
 $x$
-coordinate of the centre of mass of the fluids throughout time with
 $\unicode[STIX]{x1D70F}_{fill}=50\,\%$
, for different
 $Bo_{i}$
and
 $Bo_{c}=[0.058;0.116;0.290;0.580;1.16;2.90;5.80]$
from (a–g).

Figure 18 presents the evolution of the dimensionless spreading diameter of the bubble against the tank, for different filling ratios and different
 $Bo_{c}$
. As for the bubble thickness, the variation of the spreading diameter
 $D_{b}/D_{0}$
can be divided into two regimes depending on the Bond number. When
 $Bo_{c}<1.16$
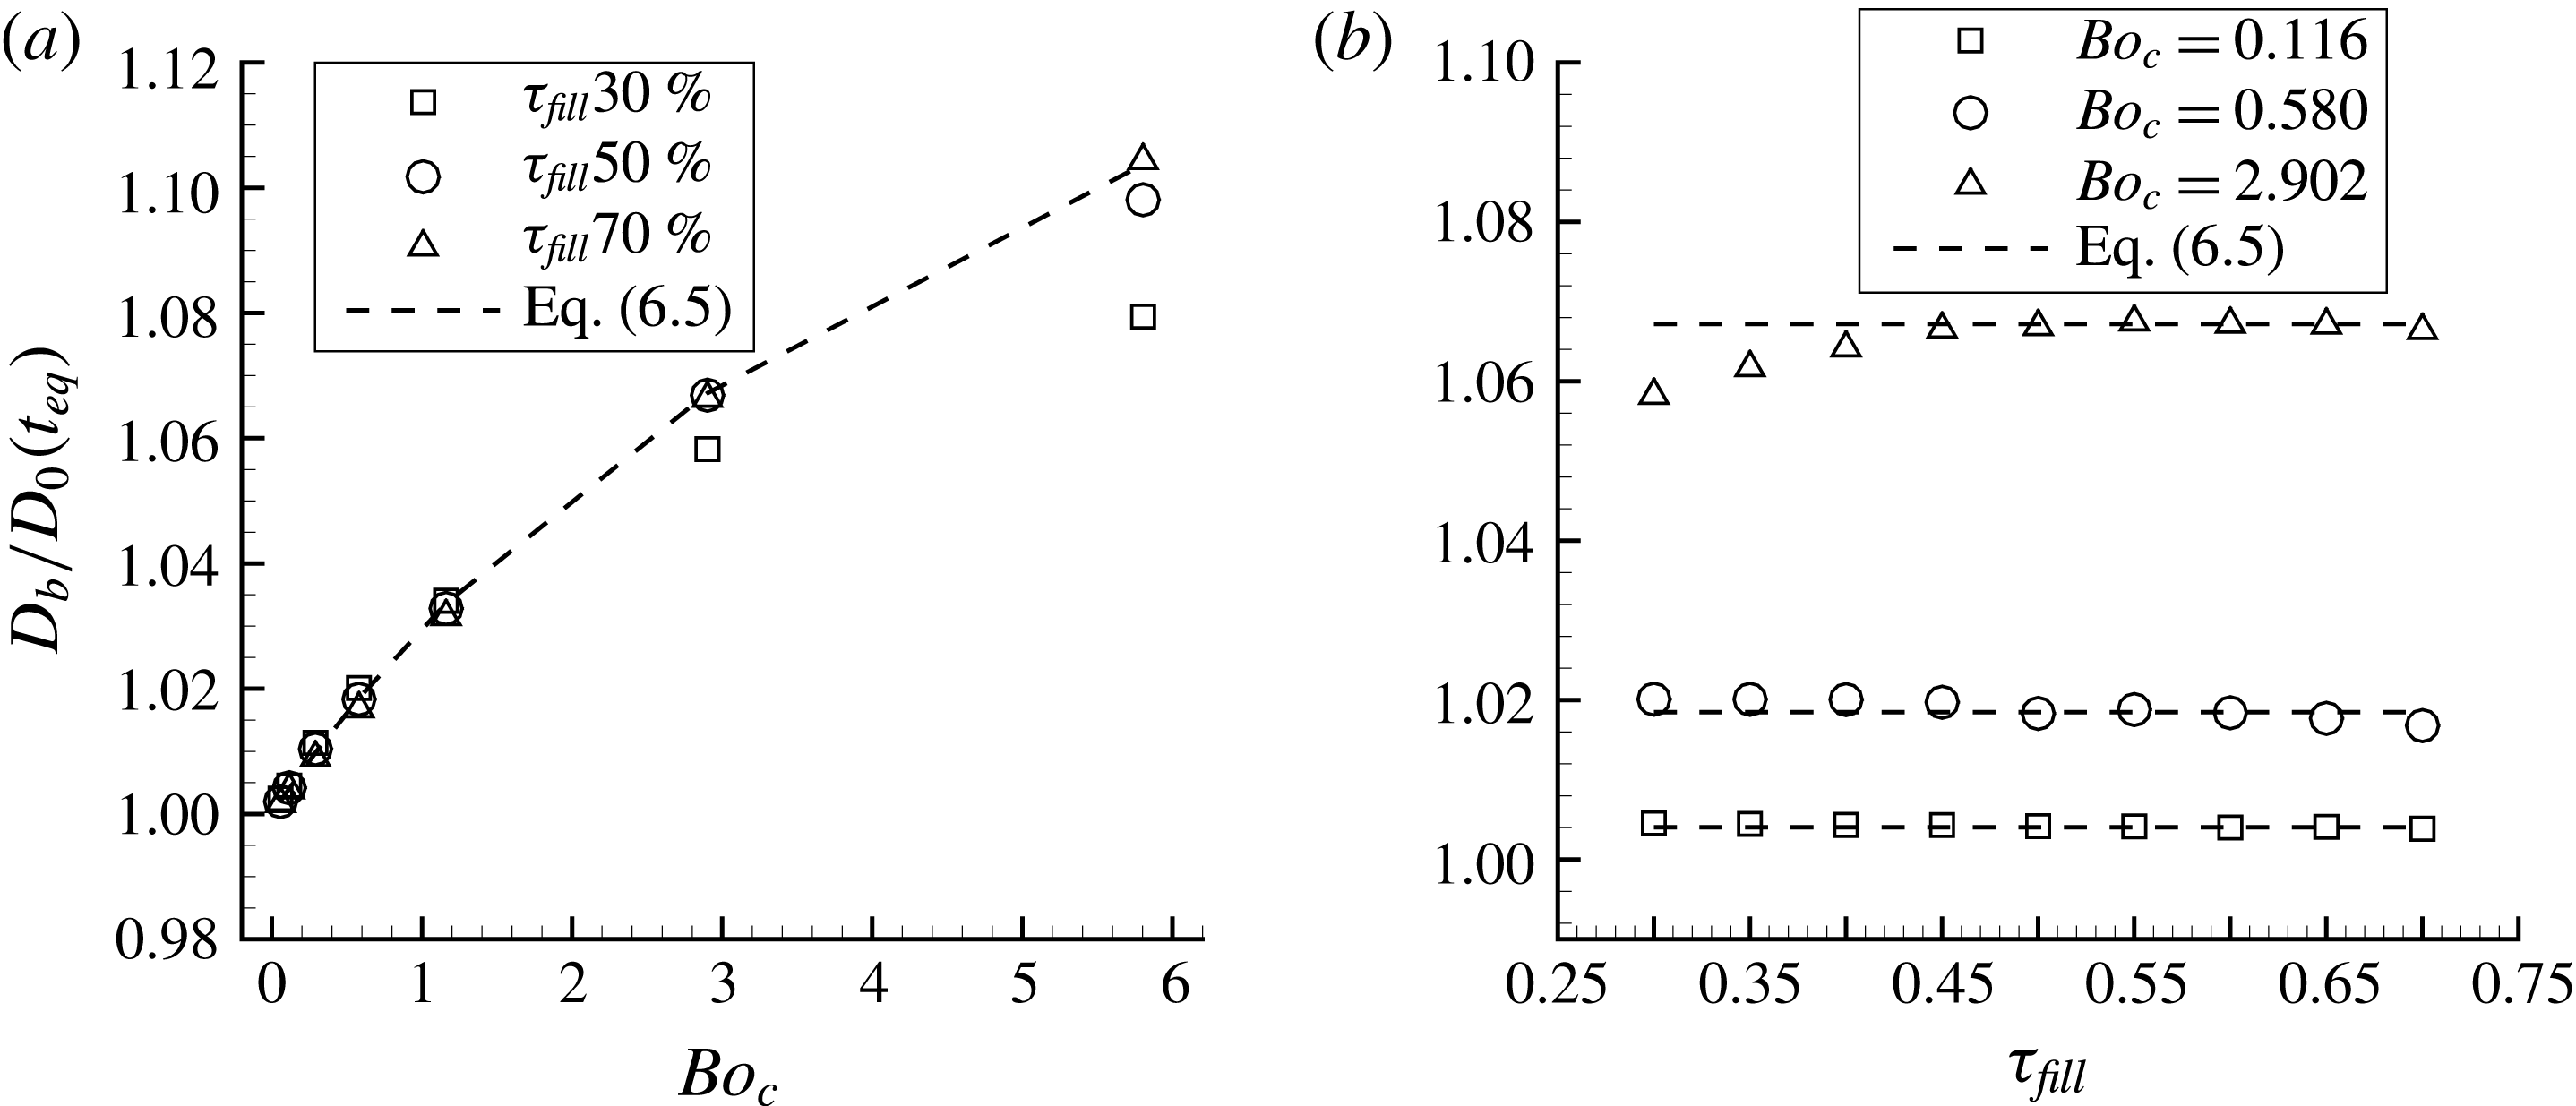
, the spreading diameter evolves linearly with the Bond number and remains independent from the filling ratio. For higher Bond numbers, the spreading diameter increases with a slower magnitude and we assume that it will reach an asymptotic value depending on the tank diameter and the filling ratio. This dependency on the Bond number, like that of the bubble thickness, is well predicted by the logarithmic function. The same low impact of the filling ratio is noticeable for
 $Bo_{c}=2.902$
but a local increase of the spreading diameter is observed for
 $\unicode[STIX]{x1D70F}_{fill}<0.5$
. As for the bubble thickness, the limiting value is closer to the initial spreading diameter for a low filling ratio. By considering the regime independent of the filling ratio, the spreading diameter can be approached by
 $$\begin{eqnarray}\frac{D_{b}}{D_{0}}(t_{eq})=1+C_{6}\ln (C_{7}Bo_{c}+1),\end{eqnarray}$$
with
 $C_{6}=8.25\times 10^{-2}$
and
 $C_{7}=4.34\times 10^{-1}$
in our simulations and is depicted with dashed lines in figure 18.
7 Summary
We have discussed the motion and deformation of a bubble in a spherical tank rotating around a fixed axis in microgravity conditions. Based on three-dimensional direct numerical simulations, our analysis is focused on low Bond number configurations for which theoretical models are not available due to the prominence of nonlinear surface tension effects. Very few experiments exist to predict the fluids behaviour because of the long time required in microgravity conditions. Direct numerical simulation is one of the promising ways to understand the fluid behaviour during low Bond number manoeuvres. Because of the low inertial accelerations we enforce on the tank, the gas compressibility has been neglected. We considered the perfectly wetting condition in our model because of the properties of the typical propellants used in the space industry. This assumption is reasonable for low inertial manoeuvres for which the Bond numbers stay lower than a critical value. Further experiments are required to determine this value. Nevertheless, the comparison with experimental data showed that considering the no contact line assumption predicts well the fluids’ behaviour for higher values of the Bond numbers. Our numerical model have been validated through a detailed spatial convergence study. The data from the Fluidics experiment, carried out in the International Space Station, have been presented in a high Bond number case and compared to our results. The experiment is a low rate centrifuge which applies a rotation around the motor axis of a spherical tank containing a safe substitute of propellant and helium gas. Sensors measure the force and torque exerted by the fluids on the tank wall in microgravity conditions. We showed that the space convergence is still valid in the Fluidics experiment cases. The comparison of the force and torque showed that we predict well the different phases of the manoeuvre. The centrifugal force exerted during the constant angular velocity phase is obtained with an error lower than 4 % for two different tanks. The torque peaks corresponding to the acceleration and deceleration phases are similar in both cases. The oscillations of the bubble around its equilibrium position have been investigated through the torque evolution. The magnitude and the frequency of the torque oscillations measured in the ISS comply with our numerical simulations and the same damping of the oscillations throughout time is observed. This shows that the simulations predict well the phenomena observed in space and validates the assumptions made. The evolution of the centre of mass has been investigated through a parametric study on two dimensionless Bond numbers respectively based on the angular velocity and the angular acceleration. We showed that the trajectory of the centre of mass is quite different depending on the final angular velocity. For low values of
 $Bo_{c}$
, the bubble goes toward the tank wall, bounces and follows the tank wall until it reaches its final position. We observed in this case that the trajectory does not depend on the angular acceleration. We defined a criterion
 $\unicode[STIX]{x1D6FE}=Bo_{i}/Bo_{c}>\unicode[STIX]{x1D6FE}_{lim}=2L/D_{t}$
which quantifies that there is no influence of
 $Bo_{i}$
on the trajectory of the centre of mass. For higher values of
 $Bo_{c}$
, the spreading and bouncing of the bubble against the tank wall is more important. Several bounces against the tank wall may happen and we observed a clear influence of the second Bond number
 $Bo_{i}$
. In this case, the bubble oscillates around its equilibrium position before reaching it. We approached the oscillations phase with the solution of a one-dimensional mass–spring system with a damping term. We obtained the natural pulsation of the oscillation and the damping coefficient for different values of the Bond numbers. We showed that the natural pulsation and the damping of the oscillations increase with
 $Bo_{c}$
. The equilibrium position of the centre of mass was investigated with
 $Bo_{c}$
and the filling ratio
 $\unicode[STIX]{x1D70F}_{fill}$
. Its position corresponds to
 $x=0$
and the value
 $y$
depends linearly on the filling ratio and follows a logarithmic law with the Bond number. Indeed, the amount of liquid affects linearly the position of the centre of mass and increasing the angular velocity tends to spread the bubble against the tank wall with a higher magnitude. As a consequence, spreading an already deformed bubble against a tank wall is more complicated. This saturation phenomenon is well predicted by a logarithmic law. We deduced the force generated on the tank wall from the position of the centre of mass. It evolves linearly with the Bond number and follows a power law with the filling ratio. In a last part, we were interested in the shape of the bubble throughout time. We observed at early flow time capillary waves for specific cases. This happens when the angular acceleration stops because the final angular velocity is reached. We observed a variation of the surface energy before the bubble reaches the tank wall for the first time in the case of low values of
 $Bo_{c}$
and
 $Bo_{i}$
. The amplitude of the variation increases greatly with
 $Bo_{c}$
and raising
 $Bo_{i}$
leads the amplitude to reach an asymptotic value. We also focused on the first spreading of the bubble because it corresponds to the higher deformation of the bubble throughout time. The surface variation increases with
 $Bo_{c}$
and we observed that this evolution follows a linear evolution with
 $Bo_{c}$
in the case
 $\unicode[STIX]{x1D6FE}>\unicode[STIX]{x1D6FE}_{lim}$
. For the other cases, the surface energy variation reaches a limiting value for each
 $Bo_{i}$
. The equilibrium shape of the bubble was investigated through its thickness and spreading diameter. We divided the range of
 $Bo_{c}$
in two regimes, the first one where the surface tension dominates and the deformation of the bubble is quite small and the second one where the inertial effects become more important. In the first regime, the bubble thickness decreases linearly with the Bond number and does not vary with the filling ratio. We observed the opposite effect on the spreading diameter which increases linearly with the Bond number and stays constant with the filling ratio. During the second regime, the bubble thickness decreases with a lower magnitude because the spreading becomes more important and the bubble comes closer to its asymptotic shape. This evolution is well predicted by a logarithmic law for both the influence of the spreading diameter and the bubble thickness with the Bond number.
The
 $x$
-coordinate of the centre of mass of the fluids throughout time with
 $\unicode[STIX]{x1D70F}_{fill}=50\,\%$
, for different
 $Bo_{i}$
and
 $Bo_{c}=[0.058;0.116;0.290;0.580;1.16;2.90;5.80]$
from (a–g).

Acknowledgements
The authors thank Airbus Defence and Space and CNES (French national space agency) for their funding. The authors gratefully acknowledge the French National Agency (ANR) for financial support of the postdoctoral study of M.L. for the development of a massively parallel version of the Black-Box multigrid method to solve linear systems in the frame of the COALA project ANR-15-CE06-0013. The authors gratefully acknowledge the CNRS (Centre National pour la Recherche Scientifique) for funding compensation of teaching hours to S.T. during the year 2017-2018. Some of the computational time was provided by the scientific group CALMIP (project no. P17035), the contribution of which is greatly appreciated.
Supplementary movie
Supplementary movie is available at https://doi.org/10.1017/jfm.2018.389.
Appendix
This appendix contains the evolution of the
 $x$
-coordinate (figure 19) and
 $y$
-coordinate (figure 20) of the centre of mass of the fluids throughout time, for different values of
 $Bo_{i}$
and
 $Bo_{c}$
, and for a filling ratio of
 $50\,\%$
.
In figures 19 and 20, we observe distinctly that for the lower values of
 $Bo_{c}$
and
 $Bo_{i}$
, the coordinates of the centre of mass and their evolution through time are identical (see § 5.3). By increasing the centrifugal Bond number, the differences between the trajectories become more important. In figure 19(e–g), the oscillations of the centre of mass around the
 $x$
-axis are clearly visible for the higher values of
 $Bo_{i}$
. As in § 5.4, we observe that the time period of one oscillation decreases with
 $Bo_{c}$
and does not seem to vary with
 $Bo_{i}$
for its three higher values. Moreover, the oscillations disappear sooner in time with a higher value of
 $Bo_{c}$
. This is shown in § 5.4 with the computation of the damping ratio. Finally, we notice that the final position of the centre of mass does not depend on
 $Bo_{i}$
. In the plots of figure 19, the final
 $x$
-coordinate approaches zero and figure 19 shows that the final
 $y$
-coordinate increases with
 $Bo_{c}$
. The summary of the final position for different
 $Bo_{c}$
and
 $\unicode[STIX]{x1D70F}_{fill}$
are presented in § 5.5.