




No CrossRef data available.
Article contents
The epidemiological consequences of optimisation of the individual host immune response
Published online by Cambridge University Press: 29 May 2003
Abstract
We present a simple unscaled, quantitative framework that addresses the optimum use of resources throughout a host's lifetime based on continuous exposure to parasites (rather than evolutionary, genetically explicit trade-offs). The principal assumptions are that a host's investment of resources in growth increases its survival and reproduction, and that increasing parasite burden reduces survival. The host reproductive value is maximised for a given combination of rates of parasite exposure, host resource acquisition and pathogenicity, which results in an optimum parasite burden (for the host). Generally, results indicate that the optimum resource allocation is to tolerate some parasite infection. The lower the resource acquisition, the lower the proportion of resources that should be devoted to immunity, i.e. the higher the optimum parasite burden. Increases in pathogenicity result in reduced optimum parasite burdens, whereas increases in exposure result in increasing optimum parasite burdens. Simultaneous variation in resource acquisition, pathogenicity and exposure within a community of hosts results in overdispersed parasite burdens, with the degree of heterogeneity decreasing as mean burden increases. The relationships between host condition and parasite burden are complicated, and could potentially confound data analysis. Finally, the value of this approach for explaining epidemiological patterns, immunological processes and the possibilities for further work are discussed.
Information
- Type
- Research Article
- Information
- Copyright
- © 2002 Cambridge University Press
INTRODUCTION
Evolutionary success is built on reproduction and survival – all other physiological mechanisms are designed to increase these and, therefore, fitness. The immune system is no exception. A simplistic view is that, by definition, parasitic infection reduces fitness of the host, and that an immune response nullifies or reduces this effect by killing parasites. However, immunity and immune responses occur at a cost of resources (such as energy and protein), and resources are limited, so there will be a trade-off between mounting an immunological response and reduction in fitness (Behnke, Barnard & Wakelin, 1992; Sheldon & Velhurst, 1996; Lochmiller & Deerenberg, 2000; Read & Allen, 2000). There is an increasing number of experimental examples placing the immune response within an ecological, epidemiological and evolutionary context (e.g. Boots & Begon, 1993; Gustafsson et al. 1994; Kraaijeveld & Godfray, 1997; Fellowes, Kraaijeveld & Godfray, 1998; Moret & Schmid-Hempel, 2000). If immunity is constrained by resource acquisition, then a complex relationship between, for example, nutrition and immunity to parasites is to be expected (e.g. Coop & Kyriazakis, 1999). Generally, reduced nutritional intake (or acquisition) will reduce resilience to infection and/or disease, although the effect may be subtle and depend on sub-optimal nutrition rather than malnutrition (Michael & Bundy, 1992a, b; Petkevicius et al. 1995). Similarly, as behaviour is a determinant of fitness, there is an intimate link between immunity and behaviour (Barnard et al. 1997).
An enduring subject in parasite epidemiology is the heterogeneity observed in parasite burdens, and understanding the roles of variation in exposure and immune competence (Quinnell, Medley & Keymer, 1990; Bundy & Medley, 1992; Hudson & Dobson, 1995). The distribution of parasites in a population of hosts is a dynamic entity (Anderson & Medley, 1985), with the controlling mechanisms predominately operating at the level of individual hosts. Longitudinal observations demonstrate that individual hosts have a tendency to reacquire relatively similar parasite burdens following expulsion chemotherapy, i.e. hosts appear to be predisposed to high or low burdens (e.g. Keymer & Pagel, 1990; Chan, Bundy & Kan, 1994a). Genetic influences appear to be important, but not over-riding (Chan, Bundy & Kan, 1994b; Williams-Blangero et al. 1999).
Host response to parasitic infection is recognized to depend on the pattern of exposure (e.g. Roepstorff et al. 1997). In recent experiments using Ascaris suum in pigs subject to a continuous, ‘natural’ exposure, Boes et al. (1998) showed that, in addition to predisposition, continued exposure results in a decrease in heterogeneity caused by a reduction in burdens of those heavily infected individuals and an increase in prevalence as pigs with zero burdens acquire small numbers. Further, the distribution of A. suum in litters of piglets shows reduced heterogeneity if sows are exposed (Boes et al. 1999). The results of cross-suckling strongly suggest that the reduction in heterogeneity is due to immunomodulation, i.e. piglets suckling from infected sows show the same response to challenge infection regardless of the infection status of their natural mother. Taken together, these experiments provide evidence that exposure to infection can increase parasite burden, and that this increased parasitism can be mediated by the immune response, i.e. the immune system is ‘allowing’ more parasites. Note that this effect of immunomodulation can only be seen in groups of hosts – the mean and individual burdens are not necessarily altered by exposure, but the variation within a group is reduced. Further insight into the interaction between heterogeneity and exposure is given by analysis of observational data that demonstrates that the degree of heterogeneity is decreased within a community / group of hosts as parasite prevalence increases (Guyatt et al. 1990, 1994; Lwambo, Bundy & Medley, 1992; Medley et al. 1993; Coates, Roepstorff & Medley, unpublished).
Thus, one should not expect, ceteris paribus, that increasing parasite challenge will lead to increased immune effectiveness either within individuals, or within populations. Epidemiological patterns of infection and disease observed at the population level are a manifestation of effects occurring within individual hosts that might be very different from an average effect. For example, the relationship between some measure of health (e.g. anaemia) and parasite burden, is complicated by the fact that individuals are controlling both anaemia and parasite burdens in order to maximise other variables, e.g. survival.
The interaction between resource acquisition, parasites, immunity and fitness is a quantitative problem that can be addressed through application of mathematical models. Previous theoretical work has largely concentrated on consideration of co-evolution of hosts and parasites, i.e. the dynamics of genetically controlled traits of susceptibility/resistance and pathogenicity (e.g. Antonovics & Thrall, 1994; Bowers, Boots & Begon, 1994; Kaitala, Heino & Getz, 1997). The results generally show that genetically controlled susceptibility to infection (and morbidity and mortality) can be maintained in a population if the fitness cost of resistance is great compared to the disease cost of susceptibility. Taking a game theory approach, van Baalen (1998) showed that the optimum resource allocation to immunity in a homogeneous population of hosts is determined by parasite characteristics such as virulence.
Here, we consider the problem from the viewpoint of an individual host, addressing physiological, rather than evolutionary (genetic), processes. The host is followed through age: how should it optimally distribute resources between reproduction, survival and immunity to maximise fitness? A similar framework has been used to consider both development of acquired immune response (Woolhouse, 1992) and development of disease and optimal age for infection control (Medley & Bundy, 1996). Initially, we simply illustrate the point that constrained resources can compromise immunity. The model is then used to demonstrate that this approach can potentially explain numerous ecological and immunological observations.
MODEL FRAMEWORK
The model is based on an individual host considered over age, a. Exposure to the parasite (measured as the rate of infection) is assumed not to depend directly on the parasite burden within the host. Resources can be used either to control the parasite burden (immunity) or for investment in growth or reproduction. The current parasite burden, (previous) investment and immunological response determine survival of the host. Age and (previous) investment determine reproductive output. Here the term ‘immunity’ is used to refer to host processes that constrain the parasite population, are adaptive and elicited by exposure to the parasite.
Resources are acquired at a constant rate, R, and are then partitioned between three competing requirements: growth, reproduction and immunity, designated fg, fr and fi respectively, so that fg+fr+fi = R. The growth component is used to increase the size of the individual, g(a). Note that size is being used as a proxy for investment, i.e. using resources now to increase future survival and reproduction. We assume a standard growth rate equation:

giving a nominal maximum size of unity, and using an initial size of 0.01. The parasite population, p(a), is modelled as an immigration–death process (Bundy & Medley, 1992), where immigration (establishment) is reduced according to the resources devoted to immunity:

The rates of establishment and death of the parasite population are Λ and μ, respectively. The exponential function is chosen arbitrarily such that for fi = 1 the establishment rate of parasites is reduced to 95% of its unconstrained level. We set μ = 1 so that the maximum parasite burden when the rate of infection is constant is equal to Λ.
Resources are partitioned by first removing that component required for immunity:

This function increases as the parasite population increases up to a maximum, αR. The parameter α is important as it denotes the maximum proportion of resources a host will devote to controlling the (current) parasite population as opposed to investing in growth and reproduction. The resources remaining after immunity are used either for growth or reproduction, and for convenience, we choose an age of sexual maturity, w = 10, below which all resources are devoted to growth, and above it to reproduction:

We assume that the host death rate a particular age, v(a), is determined by two components, namely size, relative to the maximum size at each age, g0(a), and the current parasite burden, p(a):

where β determines the pathogenicity of the parasite (β = 0 implies that the current parasite burden causes no mortality), and σ is a scaling parameter set to 0.001. Maximum size is calculated from Eqn. 1 with fg = R. The probability of survival of the host to a particular age, s(a), is determined from the differential equation:

Relative reproductive output at each age, m(a), is determined as the resources available for reproduction scaled by size (past investment):

The reproductive value at birth, V, provides a measure of the expected reproductive output at all future ages, weighted by probability of survival to that age:

where L is the maximum life expectancy and set to 30. This system of equations is solved numerically using standard methods (MatLab, Mathworks Inc).
We are particularly interested in the value of immunity investment, αmax, that maximises reproductive value given values of the controlling parameters. The three parameters we consider as controlling are nutritional (resource) input (R), pathogenicity (β) and rate of infection (Λ). We treat these parameters singly, and also consider their interaction, using Monte Carlo simulation to create a community of hosts.
RESULTS
The effect of varying the proportion of resources devoted to immunity (α) and subsequent age-dependent outcomes are illustrated in Fig. 1. These results demonstrate that the reproductive value, V, is maximised when the proportion of resources devoted to immunity is 20% (αmax = 0.195, solid lines). Devoting less (dotted lines) results in a faster growth rate and larger final size (enhancing survival and reproduction) and a higher parasite burden (reducing survival) with a net effect of lower survival. Increasing α (dashed lines) produces a smaller final size (reducing survival and reproduction) and lower parasite burden with consequent higher survival. The reproductive value is, however, lower because of the effect on reproduction, i.e. reproductive output is compromised by using resources to control parasite burden. Note that it is relative values of the reproductive value that are important, rather than absolute value, so that values below unity have no special meaning.

Fig. 1. Example output from the model (eqns 1–8). (a) The relationship between reproductive value (V) and maximum immunity resource (α). The three marked values coincide with lines in other panels. (b) The size (g) as a function of age for the three values of α (○: α = 0, dotted line; x: α = 0.195, solid line; *: α = 0.8, dashed line). Note that nil investment in immunity (dotted line) results in maximal growth. (c) The parasite burden over age for the same values of α. The equilibrium parasite burden is reduced by increased resource allocation to immunity. (d) The survivorship curves over age for the same values of α. Other parameter values are R = 1, Λ = 50, β = 1.
The effect of resource acquisition is demonstrated in Fig. 2. As resource intake is varied, so is the optimal proportion used to control parasite burden. Note that resource acquisition, R, should be interpreted widely, so that it refers not only to direct nutritional uptake, but the host's ability to acquire and utilise resources. Low levels of resource acquisition reduce αmax, i.e. the less that is available, the lower the optimum proportion that should be devoted to immunity. At the lowest level shown (R = 0.1), αmax = 0 and unrestricted parasite burden is the optimum for the host. Optimal immune allocation increases rapidly for 0.5<R<1, and optimal parasite burden falls. For R>1.5 the parasite burden can be effectively controlled by reducing the proportion of the (increasing) resources available devoted to immunity.

Fig. 2. The relationship between the resource acquisition (R) and maximum immunity resource (α). (a) The reproductive value, V, as a function of α for R = 0.1, 0.5, 1 and 2 (lines from bottom to top). Note logarithmic scale. The maximum in each case is indicated by x. (b) The value of α that maximises the reproductive value: αmax; the points are those in (a). (c) The equilibrium, optimum parasite load (popt) as a function of R. The points are those in (a) and (b). Other parameters are as Fig. 1.
The effects of variation in pathogenicity, β, and parasite exposure, or infection rate, Λ, are given in Fig. 3. When parasites have no influence on survival (pathogenicity is very low), there is nothing to be gained by controlling them, and the optimum burden is determined by epidemiology alone. As pathogenicity increases so the influence of parasites on survival becomes greater, and the optimum resources devoted to immunity increases (Fig. 3a) and the optimum parasite burden decreases (Fig. 3b). Note again that pathogenicity should be interpreted broadly. It represents the reduction in survival due to parasite infection and will be influenced by both host and parasite factors. Similarly, increasing exposure results in increasing resources devoted to immunity (Fig. 3c). But increasing exposure also increases parasite burden, so that although increasing exposure implies increasing immunity, the net effect remains increasing parasite burden (Fig. 3d, solid line). Consequently, the net effect of immunity is the increasing proportionate reduction of parasite burden below the unconstrained value (as measured by the distance between the lines in Fig. 3d drawn in Fig. 3e). These results demonstrate that pathogenicity and exposure are roughly equivalent in terms of optimising the strength of the immune response (compare Fig. 3a with Fig. 3c). The two parameters, Λ and β, are almost linear with regard to the optimisation of host response, apart from the non-linear effect of parasite-induced immune response (eqns 2 and 3). Clearly, either doubling the number of parasites or doubling the effect of a single parasite will have a similar consequence on optimisation of host survival and reproduction. However, increasing Λ results in increase in optimal parasite burdens (from the host's viewpoint), although the proportionate reduction is similar to the effect of pathogenicity (compare Fig. 3b with Fig. 3e).

Fig. 3. The relationships between the pathogenicity (β), the rate of infection (Λ) and maximum immunity resource (α). (a) The value of α that maximises the reproductive value, αmax, as a function of β. (b) The equilibrium optimum parasite load (popt) as a function of β. (c) The value of α that maximises the reproductive value, αmax, as a function of Λ. (d) The optimum equilibrium parasite load (popt) as a function of Λ (solid line). The dotted indicates the parasite burden expected with no immunity. (e) As (d), but the parasite burden is plotted as a proportion of the maximum equilibrium, Λ. Other parameters are as Fig. 1.
Fig. 4 shows the effect of simultaneous variation in resource acquisition, pathogenicity and rate of infection in terms of optimum, equilibrium parasite burdens. In all cases, increasing resource acquisition (left to right) results in reduced parasite loads. Increasing pathogenicity (top to bottom) similarly decreases optimum parasite burdens. The optimum parasite burden at extreme rates of infection is relatively little changed by pathogenicity (the effect on survival is already great).

Fig. 4. The interaction between resource acquisition (R), pathogenicity (β) and the rate of infection (Λ). Each graph shows the equilibrium, optimum parasite burden (popt) as a function of the rate of infection, Λ. The three columns are drawn for R = 0.5, 1 and 2 (left to right), and the three rows are for β = 0.5, 1 and 2 (top to bottom). Note that the vertical axis is different for each graph.
In Fig. 5 we address heterogeneity in parasite burden. These results are simulations of 200 hosts, each of which has a random combination of the parameters R, Λ and β (resource, exposure and pathogenicity respectively). For each host, the optimum parasite burden is calculated and the frequency distribution drawn (Fig. 5a). The result is an overdispersed distribution, mirroring that observed in natural infections, to which a negative binomial distribution provides an empirical description (k = 0.68). Further, the degree of heterogeneity (as measured inversely by the overdispersion parameter of the negative binomial) appears to decrease as the mean parasite burden increases (Fig. 5b) (although no formal statistics can be calculated).

Fig. 5. The distribution and heterogeneity of parasite burdens between 200 different hosts. Each host is assigned a random value for each of three parameters chosen from a uniform distribution: 0.4[les ]R[les ]2.4, 0[les ]Λ[les ]500 and 0[les ]β[les ]10. The optimised solution (αmax) is found for each individual. The parasite burden and size are taken at age ω. (a) The frequency distribution of the parasite burden. (b) The 200 hosts are divided into 5 equal size groups based on rate of infection, and the mean and overdispersion parameter, k, calculated by maximum likelihood for each group: note k varies inversely with the degree of heterogeneity. The line is found by linear regression. (c) The correlation between size and parasite burden. Note logarithmic axis. The hosts are divided into three equal sized groups based on R: R<1.1 (open circles), 1.1<R<1.8 (closed circles), and R>1.8 (open squares). (d) The relationship between size and pathogenic effect of parasite burden (disease). Note logarithmic axis.
The relationship between host size, g, and parasite burden, p, is complex (Fig. 5c). Generally, hosts with reduced nutrition (open circles) are smaller but have a wide range of parasite burdens. As resource acquisition increases (filled circles–open squares), size generally increases and parasite burden decreases but there is considerable overlap between these groups. In the low resource group, there is a positive trend in the relationship between size and parasites: larger individuals have a higher burden. As the resource acquisition increases this relationship becomes increasingly negative, so that for the larger individuals, the largest have the smallest burdens.
The total pathogenic effect of infection (or ‘disease’) is the product of the parasite burden and the pathogenicity of an individual parasite, βp. Since size and disease have the largest impact on reproductive value, the optimisation attempts to find the most profitable relationship between these two variables (Fig. 5d). This relationship is not causal: it represents the optimum an individual can achieve given the circumstances. So that, remembering that size is a proxy measure for condition or investment for future reproduction and survival, it would be erroneous to conclude, for example, that disease causes small size.
DISCUSSION
This is, to the best of my knowledge, the first quantitative description of the immunological and epidemiological effects of resource partitioning between immunity, growth and reproduction from an individual host perspective. The first conclusion is that hosts' attempts to maximise their resource use under conditions of continuous infection will generally result in co-existence with parasite infection. ‘Failure’ to control parasites does not mean immunological failure or parasite evasion of immunity – a non-zero parasite burden can be an optimal strategy for the host (Fig. 1) (Behnke et al. 1992).
Variation in resource acquisition results in a change in this parasite burden (Fig. 2). With this model and parameters, the effect of resource acquisition on parasite burdens is highly non-linear and produces a threshold effect – malnourished hosts have high burdens and little immunity, well nourished hosts have low burdens, and there is a switch between the two over a short range of R. Perhaps of greatest significance is that individuals on very low nutritional planes should put increasingly less resources into immunity. This would be further extenuated if resource acquisition was positively related to size, or inversely related to parasite burden. In this case, even small initial differences might have very large consequences. Resource acquisition is highly predictive of reproductive value. Fig. 3 demonstrates that although optimisation in the face of varying pathogenicity and rate of infection have similar immunological effects, they have very different epidemiological consequences, i.e. opposite effects on absolute parasite burden.
The epidemiological (population) consequences of hosts specific optimisation are interesting. Each host will have a different optimal response, largely because they have different resources bases, and different ‘views’ of the parasite (e.g. what is pathogenic to one host might be benign to another), and will be exposed to different numbers of different parasite strains. These differences will be multi-dimensional and include genetic, environmental and chance components. The results suggestion that we can interpret heterogeneity in parasite burden in terms of individual hosts finding their own optimum immune response, and therefore their own optimum parasite burden. Changes in the epidemiology of infection can result in ‘shuffling’ of the hosts' parasite burdens, rather than necessarily changing the mean parasite burden. Consequently, continued exposure might be expected to have as great an effect on the variability of parasite burden between hosts as on average burdens. The observation that individual hosts are predisposed to relative parasite burdens is consistent with this view – individuals' optima are relatively constant within a group of hosts. Epidemiological investigations frequently involve comparisons between communities. However, it is within the individual host that infection and immunity occur, so that community or population level phenomena are the manifestation of processes and effects operating within individual hosts. The framework presented here has potential for investigating the community-level manifestations of individual host processes. When variation in controlling parameters (resource acquisition, exposure and pathogenicity) is included, the distribution of parasite burdens (each being the host's own, personal optimum) is overdispersed (Fig. 5). In principle this is because the combination of conditions that optimise a high burden is relatively rare. Further, the variation takes the same form as that observed – i.e. it decreases as the mean increases. In field data, the relationship between parasite burden and condition (e.g. size) is frequently difficult to demonstrate. As each host is optimising its own circumstances to reduce the impact of parasites, this impact can be unclear from observational data. In well-nourished individuals, this relationship may be positive, i.e. hosts in better condition have more parasites.
The model presented is clearly simplified in many respects. In particular, physiology, immunity, life history and parasite infection present a complex, non-linear interaction of processes that have not been fully addressed. For example, the age of sexual maturity (w) should itself be dependent on size (g), and size may have a non-linear effect on reproductive success (Hurd, 2001) and resource acquisition. Further, we only consider host adaptation to parasite infection. Parasites themselves are subject inter alia to the trade-off between transmission and reduced survival in hosts, considerably complicating the interaction (van Baalen, 1998; Hurd, 2001). One of the major hurdles to overcome in experimental testing of hypotheses is the nature of this interaction. For example, pathology (= reduced survival) must be viewed in an evolutionary context, which is itself the context for epidemiology and hence pathology. Competition experiments have proved useful in evolutionary (i.e. strictly genetic) investigations (e.g. Kraaijeveld & Godfray, 1997), but demonstrating that hosts have obtained a constrained optimum within their lifetime is potentially more difficult to confirm experimentally.
The immune response to infection is complicated. In part, this complexity in mechanism derives from complexity in function, which is not only to control infection and disease, but to do so in the most cost-effective manner. For example, the commitment to Th1 or Th2 response should be viewed not only in terms of its effect on host protection (Jankovic, Liu & Gause, 2001), but also its consequent effect on physiology, its physiological cost and other aspects of immunity (Yazdanbakhsh, van den Biggelaar & Maizels, 2001; Matarese et al. 2002). Another complication is that multiple parasite infections of a single host are the norm (Graham, 2001). Not surprisingly, there is substantial evidence for a close interaction between immunity and physiology (for example of the interaction between immunity and CNS, see Anisman, Zalcman & Zacharko, 1993), as well as environmentally mediated effects (e.g. Nelson & Demas, 1996). Our results do not depend on the immune response being able to distinguish protective from non-protective responses. A parasite that is able to subvert host immune resources to non-protective antigens (which reduces the immune effectiveness) will presumably increase the optimum burden (from the hosts' viewpoint). This could be included in the model in eqn 3 (which implicitly assumes that all resources devoted to immunity have a linear impact on parasite establishment). The outcome here is related to the resources devoted to immunity and it would clearly be in the host's interest to ensure that these resources are used effectively. In addition to the direct costs of mounting an immune response, most such responses result in some form of immunopathology (Garside et al. 2000), where again hosts are having to compromise between killing parasites and self-damage as a consequence. Model simulations including immunopathology (by making survival dependent on both immune function and parasites in eqn 5) do indeed suggest that optimum investment in immunity is reduced and parasite burden increased (results not shown).
Throughout, we have only considered a constant (lifetime) investment in immunity. However, hosts are likely to adjust apportionment of resources in real time, i.e. optimising at each age (though the returns are determined over the host's lifetime). Age-related strategies will be a result of both host optimisation and age-related exposure. Environmental influences (including infection) during early life can have pervasive effects at later ages (e.g. Metcalfe & Monaghan, 2001). Consequently, the immunological response will be highly age-dependent, and will greatly influence the age-related epidemiology of pathogens. Likewise, ‘immaturity’ of the immune response in young individuals may be shown to be an adaptive approach to resource allocation: an optimum strategy might be to permit higher parasite burdens (and risk morbidity and mortality) in return for being in a better state to reproduce later. Hosts might be expected to differentiate between infecting parasites (in terms of, say, pathogenicity) in determining the level of immune response to each. For example, it would make evolutionary sense to react quickly to a multiplying virus that would kill if uncontrolled which, given constraints, will likely imply reduction of immunity directed against parasites that are less dangerous. This requires mechanisms (within the immune system) that are capable of detecting changes in abundance and spatial distribution of parasites within the host, and determining morbid consequences of each parasite population. Suppression of subsets of the immune response through activation of others need not be directly due to the parasites themselves but an effect of host resource allocation (Moret & Schmid-Hempel, 2000). Consequently, elimination of one pathogen may enhance the immune response to others (Bundy, Sher & Michael, 2000).
One consequence of acknowledging that hosts must optimise resource allocation is that individual hosts have to find their own optimal parasite burden. Depending on the speed with which this optimisation occurs, this would result in changes in the distribution of parasite burdens with age, which would also be exacerbated by changes in the optimum with age (Pacala & Dobson, 1988). Aspects of the immune system are transferred from mother to offspring (Carlier & Truyens, 1995). Could not mechanisms exist to pass information about, say, the pathogenicity of specific infections? The neonate that received ‘immunological wisdom’ from its mother would be in a much better position to juggle resource allocation between growth and immunity than one that was ignorant. Such direct maternal effects will confound analyses based solely on the assumption of genetic transfer of information.
In summary, the general, quantitative framework presented is a step towards further understanding of the interaction between immunity and epidemiology. The model makes the undesirable assumption that the immune system is optimising in order to understand the potential epidemiological consequences (Parker & Maynard Smith, 1990). It is to be hoped that future work will develop better understanding of the constraints and context within which the immune system functions.
ACKNOWLEDGEMENTS
I thank Jaap Boes, Shana Coates, Peter Nansen, Jan Roger and Lisa White and for useful discussions and comments.
References
ANDERSON, R. M. & MEDLEY, G. F. (1985). Community control of helminth infections of man by mass and selective chemotherapy. Parasitology 90, 629–660.CrossRefGoogle Scholar
ANISMAN, H., ZALCMAN, S. & ZACHARKO, R. M. (1993). The impact of stressors on immune and central neurotransmitter activity: bidirectional communication. Reviews in the Neurosciences 4, 147–180.CrossRefGoogle Scholar
ANTONOVICS, J. & THRALL, P. H. (1994). The cost of resistance and the maintenance of genetic polymorphism in the host-pathogen systems. Proceedings of the Royal Society of London, Series B 257, 105–110.CrossRefGoogle Scholar
BARNARD, C. J., BEHNKE, J. M., GAGE, A. R., BROWN, H. & SMITHURST, P. R. (1997). Immunity costs and behavioural modulation in male laboratory mice (Mus musculus) exposed to the odours of females. Physiology and Behavior 62, 857–866.CrossRefGoogle Scholar
BEHNKE, J. M., BARNARD, C. J. & WAKELIN, D. (1992). Understanding chronic nematode infections: evolutionary considerations, current hypotheses and the way forward. International Journal for Parasitology 22, 861–907.CrossRefGoogle Scholar
BOES, J., COATES, S., MEDLEY, G. F., VARADY, M., ERIKSEN, L., ROEPSTORFF, A. & NANSEN, P. (1999). The role of material immunity in experimental Ascaris suum infections in young piglets. Parasitology 119, 509–520.CrossRefGoogle Scholar
BOES, J., MEDLEY, G. F., ERIKSEN, L., ROEPSTORFF, A. & NANSEN, P. (1998). Distribution of Ascaris suum in experimentally and naturally infected pigs and comparison with Ascaris lumbricoides infections in humans. Parasitology 117, 589–596.CrossRefGoogle Scholar
BOOTS, M. & BEGON, M. (1993). Trade-offs with resistance to a granulosis virus in the Indian meal moth, examined by a laboratory evolution experiment. Functional Ecology 7, 528–534.CrossRefGoogle Scholar
BOWERS, R. G., BOOTS, M. & BEGON, M. (1994). Life-history trade-offs and the evolution of pathogen resistance: competition between host strains. Proceedings of the Royal Society of London, Series B 257, 247–253.CrossRefGoogle Scholar
BUNDY, D. A. P. & MEDLEY, G. F. (1992). Immuno-epidemiology of human geohelminthiasis: ecological and immunological determinants of worm burden. Parasitology 104, S105–S119.CrossRefGoogle Scholar
BUNDY, D. A. P., SHER, A. & MICHAEL, E. (2000). Good worms or bad worms: do worm infections affect the epidemiological patterns of other diseases? Parasitology Today 16, 273–274.Google Scholar
CARLIER, Y. & TRUYENS, C. (1995). Influence of maternal infection on offspring resistance towards parasites. Parasitology Today 11, 94–99.CrossRefGoogle Scholar
CHAN, L., BUNDY, D. A. P. & KAN, S. P. (1994a). Aggregation and predisposition to Ascaris lumbricoides and Trichuris trichiura at the familial level. Transactions of the Royal Society of Tropical Medicine and Hygiene 88, 46–48.Google Scholar
CHAN, L., BUNDY, D. A. P. & KAN, S. P. (1994b). Genetic relatedness as a determinant of predisposition to Ascaris lumbricoides and Trichuris trichiura infection. Parasitology 108, 77–80.Google Scholar
COOP, R. L. & KYRIAZAKIS, I. (1999). Nutrition-parasite interaction. Veterinary Parasitology 84, 187–204.CrossRefGoogle Scholar
FELLOWES, M. D. E., KRAAIJEVELD, A. R. & GODFRAY, H. C. J. (1998). Trade-off associated with selection for increased ability to resist parasitoid attack in Drosophila melanogaster. Proceedings of the Royal Society of London, Series B 265, 1553–1558.CrossRefGoogle Scholar
GARSIDE, P., KENNEDY, M. W., WAKELIN, D. & LAWRENCE, C. E. (2000). Immunopathology of intestinal helminth infection. Parasite Immunology 22, 605–612.CrossRefGoogle Scholar
GRAHAM, A. L. (2001). Use of an optimality model to solve the immunological puzzle of concomitant infection. Parasitology 122, S61–S64.CrossRefGoogle Scholar
GUSTAFSSON, L., NORDLING, D., ANDERSSON, M. S., SHELDON, B. C. & QVARNSTROM, A. (1994). Infectious diseases, reproductive effort and the cost of reproduction in birds. Philosophical Transactions of the Royal Society of London, Series B 346, 323–331.CrossRefGoogle Scholar
GUYATT, H. L., BUNDY, D. A. P., MEDLEY, G. F. & GRENFELL, B. T. (1990). The relationship between the frequency distribution of Ascaris lumbricoides and the prevalence and intensity of infection in human communities. Parasitology 101, 139–143.CrossRefGoogle Scholar
GUYATT, H. L., SMITH, T., GRYSEELS, B., LENGELER, C., MSHINDA, H., SIZIYA, S., SALANAVE, B., MOHOME, N., MAKWALA, J., NGIMBI, K. P. & TANNER, M. (1994). Aggregation in schistosomiasis: comparison of the relationships between prevalence and intensity in different endemic areas. Parasitology 109, 45–55.CrossRefGoogle Scholar
HUDSON, P. J. & DOBSON, A. P. (1995). Macroparasites: observed patterns in naturally fluctuating animal populations. In Ecology of Infectious Diseases in Natural Populations (ed. Grenfell, B. T. & Dobson, A. P.). Cambridge, Cambridge University Press.CrossRef
HURD, H. (2001). Host fecundity reduction: a strategy for damage limitation? Trends in Parasitology 17, 363–368.Google Scholar
JANKOVIC, D., LIU, Z. & GAUSE, W. C. (2001). Th1- and Th2-cell commitment during infectious disease: asymmetry in divergent pathways. Trends in Immunology 22, 450–457.CrossRefGoogle Scholar
KAITALA, V., HEINO, M. & GETZ, W. M. (1997). Host-parasite dynamics and the evolution of host immunity and parasite fecundity strategies. Bulletin of Mathematical Biology 59, 427–450.CrossRefGoogle Scholar
keymer, a. e. & pagel, m. (1990). Predisposition to hookworm infection. In Hookworm Infection: Current Status and New Directions (ed. Schad, G. A. & Warren, K. S.). London, Taylor and Francis.
KEYMER, A. E. & PAGEL, M. (1990). Predisposition to hookworm infection. In Hookworm Infection: Current Status and New Directions (ed. Schad, G. A. & Warren, K. S.). London, Taylor and Francis.
LOCHMILLER, R. L. & DEERENBERG, C. (2000). Trade-offs in evolutionary immunology: just what are the costs of immunity? Oikos 88, 87–98.Google Scholar
LWAMBO, N. J. S., BUNDY, D. A. P. & MEDLEY, G. F. H. (1992). A new approach to morbidity risk assessment in hookworm endemic communities. Epidemiology and Infection 108, 469–481.CrossRefGoogle Scholar
MATARESE, G., LA CAVA, A., SANNA, V., LORD, G. M., LECHLER, R. I., FONTANA, S. & ZAPPACOSTA, S. (2002). Balancing susceptibility to infection and autoimmunity: a role for leptin? Trends in Immunology 23, 182–187.Google Scholar
MEDLEY, G. F. & BUNDY, D. A. P. (1996). Dynamic modelling of epidemiological patterns of schistosomiasis morbidity. American Journal of Tropical Medicine and Hygiene 55, 149–158.CrossRefGoogle Scholar
MEDLEY, G. F., SINDEN, R. E., FLECK, S., BILLINGSLEY, P. F., TIRAWANCHAI, N. & RODRIGUEZ, M. H. (1993). Heterogeneity in patterns of malarial oocyst infections in the mosquito vector. Parasitology 106, 441–449.CrossRefGoogle Scholar
METCALFE, N. B. & MONAHAN, P. (2001). Compensation of a bad start: grow now, pay later? Trends in Ecology and Evolution 16, 254–260.Google Scholar
MICHAEL, E. & BUNDY, D. A. P. (1992a). Nutrition, immunity and helminth infection: effects of dietary protein in the dynamics of the primary antibody response to Trichuris muris (Nematoda) in CBA/Ca mice. Parasite Immunology 14, 169–183.Google Scholar
MICHAEL, E. & BUNDY, D. A. P. (1992b). Protein content of CBA/Ca mouse diet: relationship with host antibody responses and the population dynamics of Trichuris muris (Nematoda) in repeated infection. Parasitology 105, 139–150.Google Scholar
MORET, Y. & SCHMID-HEMPEL, P. (2000). Survival for immunity: the price of immune system activation for bumblebee workers. Science 290, 1166–1168.CrossRefGoogle Scholar
NELSON, R. J. & DEMAS, G. E. (1996). Seasonal changes in immune function. The Quarterly Review of Biology 71, 511–548.CrossRefGoogle Scholar
PACALA, S. W. & DOBSON, A. P. (1988). The relation between the number of parasites/host and host age: population dynamic causes and maximum likelihood estimation. Parasitology 96, 197–210.CrossRefGoogle Scholar
PARKER, G. A. & MAYNARD SMITH, J. (1990). Optimality theory in evolutionary biology. Nature 348, 27–33.CrossRefGoogle Scholar
PETKEVICIUS, S., BJORN, H., ROEPSTORFF, A., NANSEN, P., BACH KNUDSEN, K. E., BARNES, E. H. & JENSEN, K. (1995). The effect of two types of diet on populations of Ascaris suum and Oesophagostomum dentatum in experimentally infected pigs. Parasitology 111, 395–402.CrossRefGoogle Scholar
QUINNELL, R. J., MEDLEY, G. F. & KEYMER, A. E. (1990). The regulation of gastro-intestinal helminth populations. Proceedings of the Royal Society of London, Series B 330, 191–201.CrossRefGoogle Scholar
READ, A. F. & ALLEN, E. A. (2000). The economics of immunity. Science 290, 1104–1105.CrossRefGoogle Scholar
ROEPSTORFF, A., ERIKSEN, L., SLOTVED, H. C. & NANSEN, P. (1997). Experimental Ascaris suum infection in the pig: worm population kinetics following single inoculations with three doses of infective eggs. Parasitology 115, 443–452.CrossRefGoogle Scholar
SHELDON, B. C. & VERHULST, S. (1996). Ecological immunology: costly parasite defences and trade-offs in evolutionary ecology. Trends in Ecology and Evolution 11, 317–321.CrossRefGoogle Scholar
VAN BAALEN, M. (1998). Coevolution of recovery ability and virulence. Proceedings of the Royal Society of London, Series B 265, 317–325.CrossRefGoogle Scholar
WILLIAMS-BLANGERO, S., SUBEDI, J., UPADHAYAY, R. P., MANRAL, D. B., RAI, D. R., JHA, B., ROBINSON, E. S. & BLANGERO, J. (1999). Genetic analysis of susceptibility to infection with Ascaris lumbricoides. American Journal of Tropical Medicine & Hygiene 60, 921–926.CrossRefGoogle Scholar
WOOLHOUSE, M. E. J. (1992). A theoretical framework for the immunoepidemiology of helminth infection. Parasite Immunology 14, 563–578.CrossRefGoogle Scholar
YAZDANBAKHSH, M., VAN DEN BIGGELAAR, A. & MAIZELS, R. M. (2001). Th2 responses without atopy: immunoregulation in chronic helminth infections and reduced allergic disease. Trends in Immunology 22, 372–377.CrossRefGoogle Scholar

Fig. 1. Example output from the model (eqns 1–8). (a) The relationship between reproductive value (V) and maximum immunity resource (α). The three marked values coincide with lines in other panels. (b) The size (g) as a function of age for the three values of α (○: α = 0, dotted line; x: α = 0.195, solid line; *: α = 0.8, dashed line). Note that nil investment in immunity (dotted line) results in maximal growth. (c) The parasite burden over age for the same values of α. The equilibrium parasite burden is reduced by increased resource allocation to immunity. (d) The survivorship curves over age for the same values of α. Other parameter values are R = 1, Λ = 50, β = 1.
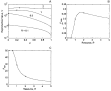
Fig. 2. The relationship between the resource acquisition (R) and maximum immunity resource (α). (a) The reproductive value, V, as a function of α for R = 0.1, 0.5, 1 and 2 (lines from bottom to top). Note logarithmic scale. The maximum in each case is indicated by x. (b) The value of α that maximises the reproductive value: αmax; the points are those in (a). (c) The equilibrium, optimum parasite load (popt) as a function of R. The points are those in (a) and (b). Other parameters are as Fig. 1.
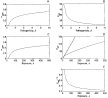
Fig. 3. The relationships between the pathogenicity (β), the rate of infection (Λ) and maximum immunity resource (α). (a) The value of α that maximises the reproductive value, αmax, as a function of β. (b) The equilibrium optimum parasite load (popt) as a function of β. (c) The value of α that maximises the reproductive value, αmax, as a function of Λ. (d) The optimum equilibrium parasite load (popt) as a function of Λ (solid line). The dotted indicates the parasite burden expected with no immunity. (e) As (d), but the parasite burden is plotted as a proportion of the maximum equilibrium, Λ. Other parameters are as Fig. 1.
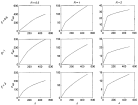
Fig. 4. The interaction between resource acquisition (R), pathogenicity (β) and the rate of infection (Λ). Each graph shows the equilibrium, optimum parasite burden (popt) as a function of the rate of infection, Λ. The three columns are drawn for R = 0.5, 1 and 2 (left to right), and the three rows are for β = 0.5, 1 and 2 (top to bottom). Note that the vertical axis is different for each graph.
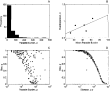
Fig. 5. The distribution and heterogeneity of parasite burdens between 200 different hosts. Each host is assigned a random value for each of three parameters chosen from a uniform distribution: 0.4[les ]R[les ]2.4, 0[les ]Λ[les ]500 and 0[les ]β[les ]10. The optimised solution (αmax) is found for each individual. The parasite burden and size are taken at age ω. (a) The frequency distribution of the parasite burden. (b) The 200 hosts are divided into 5 equal size groups based on rate of infection, and the mean and overdispersion parameter, k, calculated by maximum likelihood for each group: note k varies inversely with the degree of heterogeneity. The line is found by linear regression. (c) The correlation between size and parasite burden. Note logarithmic axis. The hosts are divided into three equal sized groups based on R: R<1.1 (open circles), 1.11.8 (open squares). (d) The relationship between size and pathogenic effect of parasite burden (disease). Note logarithmic axis.
 You have
Access
- 41
- Cited by