1. Introduction
When a rippled interface separating different fluids is continually accelerated, such as by gravity or rarefaction waves, Rayleigh–Taylor (RT) instability (light fluid accelerates heavy one) or stability (heavy fluid accelerates light one) is triggered (Rayleigh Reference Rayleigh1883; Taylor Reference Taylor1950; Mikaelian Reference Mikaelian2009b ). In contrast, if the acceleration is impulsively applied to the interface, such as by a shock wave, Richtmyer–Meshkov (RM) instability occurs, regardless of the acceleration direction (Richtmyer Reference Richtmyer1960; Meshkov Reference Meshkov1969). The primary mechanism of the interfacial instability or stability is baroclinic vorticity deposition, which results from the misalignment between the pressure and density gradients (Brouillette Reference Brouillette2002). In RT and RM instabilities, the baroclinic vorticity causes a continuous increase in perturbation amplitude, with light bubbles penetrating into the heavy fluid and heavy spikes penetrating into the light fluid, ultimately resulting in turbulent mixing. Conversely, in RT stability, the baroclinic vorticity induces continuous phase inversion at the interface, leading to an oscillatory perturbation behaviour. These drivers of interfacial instability and stability have received increasing attention due to their critical role in inertial confinement fusion (ICF) and scramjet engines (Aglitskiy et al. Reference Aglitskiy2010; Zhou Reference Zhou2017a , Reference Zhoub ; Zhou et al. Reference Zhou, Clark, Clark, Glendinning, Skinner, Huntington, Hurricane, Dimits and Remington2019, Reference Zhou2021; Liang & Luo Reference Liang and Luo2023; Zhou, Sadler & Hurricane Reference Zhou, Sadler and Hurricane2025).
In ICF, the laser-driven incident shock travels inward through the material interfaces of the capsule, forming reflected rarefaction or shock waves at the inner interface or capsule centre. The interactions of these waves with the material interfaces lead to mixing between the ablator and fuel, severely reducing the fusion yield (Qiao & Lan Reference Qiao and Lan2021; Hurricane et al. Reference Hurricane, Patel, Betti, Froula, Regan, Slutz, Gomez and Sweeney2023). In contrast, in scramjet engines, shock and rarefaction waves generated due to geometric corners continuously interact with the interface between the fuel and oxidiser, leading to mixing enhancement, thereby improving the propulsion efficiency (Li, Kailasanath & Book Reference Li, Kailasanath and Book1991; Yang, Chang & Bao Reference Yang, Chang and Bao2014; Urzay Reference Urzay2018). As a result, it is important to manipulate the instability development driven by successive shock and rarefaction waves.
Previous studies have primarily focused on manipulating instability development using two successive shock waves. Mikaelian (Reference Mikaelian1985) first theoretically proposed a scheme to control the single-mode perturbation growth under two-shock impacts, and assumed that the linear superposition principle is applicable if the second shock strikes the interface during its linear growth regime. Based on this theoretical framework, if the vorticities deposited by both shock waves have the same sign, the perturbation growth is promoted. Conversely, if the vorticities deposited by the two shock waves have opposite signs, three scenarios arise: (i) if the absolute vorticity from the second shock is less than that from the first shock, the perturbation growth rate is reduced; (ii) if the absolute vorticity from the second shock exceeds that from the first shock, the perturbation amplitude first decreases to zero and then exhibits a reverse growth; (iii) if the vorticity from the second shock exactly cancels out that from the first shock, the perturbation growth stagnates, leading to freeze-out.
The manipulation of the perturbation growth was numerically achieved through a second shock again hitting the evolving interface by Charakhch’yan (Reference Charakhch’yan2000) and Mikaelian (Reference Mikaelian2010), in which the former used a second shock propagating in the opposite direction to the first shock, whereas the latter used a second shock propagating in the same direction as the first shock. Recently, Qiao & Lan (Reference Qiao and Lan2021) proposed a novel capsule design, which allows a reflected shock to first meet the ablation front to mitigate the hydrodynamic instabilities at the ablation front, and this idea was confirmed by two-dimensional (2-D) numerical simulations. However, the experiments related to the instability manipulation remain limited, primarily due to the challenges in generating a second shock with an appropriate intensity and precisely controlling the time interval between two successive shocks. Recently, using the soap-film technique, a weak reflected shock was created and the time interval of two-shock impacts was precisely controlled in shock-tube experiments, achieving manipulation of the instability growth for a single-mode light/heavy perturbation (Chen et al. Reference Chen, Xing, Wang, Zhai and Luo2023b ). A novel dual-driver shock tube was also constructed (Ferguson & Jacobs Reference Ferguson and Jacobs2024), where the time interval of two-shock impacts can be adjusted by controlling the delay between the firing of the two drivers. In the dual-driver shock-tube experiments, a random 3-D, multi-mode initial perturbation was created, and a nearly freeze-out state for the mixing layer was observed if the first and second shock waves arrived nearly simultaneously at the interface. Moreover, a specific shock tube was constructed (Wang et al. Reference Wang, Cao, Chen, Zhai and Luo2022) to generate the same-sided successive shock waves, enabling experimental control over single-mode heavy/light perturbation growth (Zhai et al. Reference Zhai, Chen, Xing, Li, Cao, Wang and Luo2025). Same-sided successive shocks have also been generated through stepped fliers (Schill et al. Reference Schill2024) and laser-driven techniques (Merritt et al. Reference Merritt2023), and the perturbation growth was also controlled, including re-inversion, freeze-out and continued growth.
In practice, successive rarefaction and shock waves are also widely present. For example, in ICF, the classic capsule contains shell material, deuterium–tritium (DT) ice and DT gas, which form two heavy/light interfaces. When the laser-driven incident shock propagates inwards and strikes the heavy/light interface, rarefaction waves will be generated and propagate outwards. As a result, the ablation front will be accelerated by the outward-propagating rarefaction waves generated from the interface between the shell material and DT ice, and the reflected shock from the capsule centre. Similarly, the interface between the shell material and DT ice will be accelerated by the outward-propagating rarefaction waves generated from the interface between the DT ice and DT gas, and the reflected shock from the capsule centre (Hurricane et al. Reference Hurricane, Patel, Betti, Froula, Regan, Slutz, Gomez and Sweeney2023). To sum up, in the ICF capsule, the interfaces will generally be accelerated by incident shock, reflected rarefaction waves and reflected shock, respectively, and manipulating the perturbation growth when the rarefaction waves are present is also crucial.
For the interface instability accelerated by successive rarefaction and shock waves, there are four scenarios according to the relative directions of the two waves, as shown in figure 1: (a) counter-directional shock and rarefaction waves, with the shock reaching the interface first; (b) counter-directional rarefaction and shock waves, with the rarefaction waves reaching the interface first; (c) co-directional shock and rarefaction waves, with the shock reaching the interface first; and (d) co-directional rarefaction and shock waves, with the rarefaction waves reaching the interface first. Mikaelian (Reference Mikaelian2009b ) numerically studied the instability evolution in the first two scenarios and found that, in the first scenario, after the rarefaction waves hit the interface, the instability evolution transitions from an RM state to an RT state. In the second scenario, after the shock hits the interface, the instability evolution does not transition to an RM state but remains in its original RT state. In other words, in the first two scenarios, the rarefaction-induced RT evolution dominates the flow, regardless of the order of these waves.
Four scenarios of successive shock/rarefaction waves hitting a single-mode interface. Counter-directional shock and rarefaction waves, with the shock reaching the interface first (a); counter-directional rarefaction and shock waves, with the rarefaction waves reaching the interface first (b); co-directional shock and rarefaction waves, with the shock reaching the interface first (c); and co-directional rarefaction and shock waves, with the rarefaction waves reaching the interface first (d). SW, shock wave; RW, rarefaction waves; SI, single-mode interface.

In shock-tube experiments, Chen et al. (Reference Chen, Wang, Zhai and Luo2023a ) generated narrow rarefaction waves through the reflection of a shock from a gaseous interface, and successfully manipulated perturbation growth in the first scenario. Due to the narrow width of the rarefaction waves, their interaction with the interface was considered instantaneous. In this context, the rarefaction-induced perturbation growth can be approximately described by the impulsive model (Richtmyer Reference Richtmyer1960; Vandenboomgaerde, Mũgler & Gauthier Reference Vandenboomgaerde, Mugler and Gauthier1998). However, when the width of the rarefaction waves is relatively large, the impulsive assumption becomes inapplicable, and the time-varying acceleration and density induced by the rarefaction waves should be taken into account (Morgan et al. Reference Morgan, Likhachev and Jacobs2016, Reference Morgan, Cabot, Greenough and Jacobs2018). This greatly complicates the theoretical modelling for manipulation driven by successive shock and rarefaction waves (Mikaelian Reference Mikaelian2009 Reference Mikaelian a , Reference Mikaelianb ). It is also an experimental challenge to generate both a shock wave and wide rarefaction waves simultaneously.
In addition, few studies have been conducted on the third and fourth scenarios, largely due to the challenges in experimentally generating such co-directional waves. In the context of ICF, the ablator/fuel interface is primarily accelerated in sequence by the inward-propagating incident shock, the outward-propagating rarefaction waves and the outward-propagating shock (Montgomery et al. Reference Montgomery2018; Qiao & Lan Reference Qiao and Lan2021). As a result, the first and fourth scenarios are involved in these wave–interface interactions. Since the influence of the incident shock can be substantially reduced in the first scenario (Mikaelian Reference Mikaelian2009b ; Chen et al. Reference Chen, Xing, Wang, Zhai and Luo2023a ), the instability development driven by co-directional rarefaction and shock waves in the fourth scenario becomes significant. Recently, Gao et al. (Reference Gao, Guo, Zhai and Luo2024) developed an analytical theory to describe the time-dependent acceleration and density induced by rarefaction waves, and constructed a rarefaction-shock tube capable of generating co-directional rarefaction and shock waves. These advancements in theory and experimental apparatus provide an opportunity for manipulating the perturbation growth in the fourth scenario, thereby motivating the current study.
In this work, the manipulation of a single-mode air/SF
 $_6$
perturbation growth driven by co-directional rarefaction and shock waves is investigated both theoretically and experimentally. The different possibilities of the perturbation growth are first theoretically analysed, and subsequently, a theoretical model is developed to predict these distinct growth behaviours. Based on the model, extensive experiments are specifically designed and conducted in the rarefaction-shock tube. By controlling the arrival time of the shock at the evolving interface, the perturbation growth is well manipulated.
2. Theoretical analyses
2.1. Overall manipulation strategy
Figure 2(a) shows the schematic of the variations in temporal evolution of the RT stable perturbation growth and vorticities deposited by co-directional rarefaction and shock waves for a single-mode light/heavy configuration. Accelerated by the rarefaction waves, the single-mode light/heavy interface exhibits RT stable evolution characterised by oscillatory amplitude growth. To facilitate manipulation, the oscillatory growth period is divided into four phases, with the division points corresponding to either amplitude peaks or zero crossings. If the shock strikes the developing interface during the first or third phases, the vorticity deposited by the shock has an opposite direction to that produced by the rarefaction waves, thus reducing the perturbation growth. Particularly, if the vorticity deposited by the shock completely offsets the vorticity deposited by the rarefaction waves, freeze-out of the perturbation growth can be achieved. In contrast, if the shock hits the interface during the second or fourth phases, the vorticities produced by both the shock and rarefaction waves have the same sign, thereby promoting the perturbation growth. As a result, by adjusting the shock arrival time, the relative magnitudes of vorticity deposited by the shock and rarefaction waves can be controlled, enabling manipulation of the perturbation growth.
(a) Schematic of the RT stable amplitude growth divided into four phases and the vorticity variations of the co-directional rarefaction and shock waves. Schematics of vorticity deposition and amplitude growth of the single-mode interface accelerated by co-directional rarefaction and shock waves, with the shock striking the interface in the first (b), second (c), third (d) and fourth (e) phases. SW and RW denote the shock and rarefaction waves, respectively. The red and blue curved arrows denote the vorticities deposited by the shock and rarefaction waves, respectively. In panels (c) and (e), only the case where the vorticity produced by the shock exceeds that produced by the rarefaction waves is illustrated. The red star marks the moment when a shock wave hits the interface.

Figure 2(b–e) illustrates the framework for manipulating perturbation growth driven by co-directional rarefaction and shock waves. The left column of figure 2(b–e) shows the schematics of vorticity deposition, with the red and blue curved arrows representing the vorticities deposited by shock and rarefaction waves, respectively, and arrow size indicating the vorticity magnitude. The right column shows the variation of the perturbation amplitude growth when the shock strikes the evolving interface in different phases. After the shock impact, the perturbation growth transitions from an RT stable state to an RM unstable state (Gao et al. Reference Gao, Guo, Zhai and Luo2024). This perturbation growth rate after the shock impact can be characterised by linearly superposing the rarefaction-induced RT growth rate and the shock-induced RM growth rate (Mikaelian Reference Mikaelian1985). When the shock sequentially strikes the interface during the four different phases of the RT stable growth, the following situations may occur.
-
(i) The shock strikes the evolving interface in the first phase, as depicted in figure 2(b). It is assumed that the perturbation amplitude in the first phase is positive. The vorticities deposited by the rarefaction and shock waves have opposite directions, and there are five different possibilities of the perturbation growth. If the absolute vorticity deposited by the shock is less than that deposited by the rarefaction waves, the perturbation growth after the shock impact has the same direction as the RT growth, but with a smaller rate. As a result, the perturbation growth is reduced relative to the RT growth. If the vorticities offset each other, the perturbation growth stagnates, and freeze-out is achieved. If the absolute vorticity deposited by the shock exceeds that deposited by the rarefaction waves, the perturbation growth after the shock impact reverses its direction. Depending upon the relative magnitudes of vorticity produced by the shock and rarefaction waves, the perturbation growth can either be reversely reduced or promoted. There is also a particular situation that the perturbation growth rates before and after the shock impact are the same in magnitude but have the opposite signs.
-
(ii) The shock strikes the evolving interface in the second phase, as depicted in figure 2(c). In this phase, the perturbation has inverted, and the vorticities deposited by the rarefaction and shock waves have the same direction. The perturbation growth after the shock impact has the same direction as the RT growth, but with a greater rate. As a result, the perturbation growth is promoted relative to the RT growth.
-
(iii) The shock strikes the evolving interface in the third phase, as depicted in figure 2(d). In this phase, the perturbation remains inverted. The vorticities deposited by the rarefaction and shock waves have opposite directions, and there are also five different possibilities of the perturbation growth. The manipulation mechanism of the perturbation growth in the third phase is similar to that in the first phase, although the vorticities produced by the shock and rarefaction waves in the third phase have opposite signs to those in the first phase.
-
(iv) The shock strikes the evolving interface in the fourth phase, as depicted in figure 2(e). In this phase, the perturbation amplitude is positive, and the vorticities deposited by the rarefaction and shock waves have the same direction. The manipulation mechanism in the fourth phase is similar to that in the second phase, and the perturbation growth after the shock impact is always promoted.
Overall, when the shock hits the evolving interface in the first and third phases, the perturbation growth after the shock impact can either be promoted, reduced or frozen out, depending on the relative magnitudes of vorticity deposited by the shock and rarefaction waves. When the shock hits the evolving interface in the second and fourth phases, the perturbation growth after the shock impact is always promoted, since the vorticities produced by the shock and rarefaction waves have the same sign. In the following subsection, theoretical models will be developed to quantify the growth behaviours at different shock arrival times.
2.2. Theoretical modelling
For small-amplitude RT stable behaviour in rarefaction-driven flows, Mikaelian (Reference Mikaelian2009b ) derived an implicit expression (denoted as the Mik model) to describe the oscillatory amplitude growth. The Mik model can be written as
 \begin{equation} \rho _h\frac {\textrm {d}}{\textrm {d}t}\left [\frac {1}{\rho _h}\frac {\textrm {d}}{\textrm {d}t}(\rho _ha)\right ]+\rho _l\frac {\textrm {d}}{\textrm {d}t}\left [\frac {1}{\rho _l}\frac {\textrm {d}}{\textrm {d}t}(\rho _la)\right ]-(\rho _h-\rho _l)gka=0, \end{equation}
where
 $g$
,
 $\rho _h$
and
 $\rho _l$
denote the rarefaction-induced acceleration, and densities of heavy and light fluids, respectively, and
 $k$
= 2
 $\pi$
/
 $\lambda$
denotes the wavenumber. Notably, (2.1) did not give the analytical expressions for
 $g$
,
 $\rho _h$
and
 $\rho _l$
. Recently, by solving the dynamic equation for rarefaction-driven interface motion, Gao et al. (Reference Gao, Guo, Zhai and Luo2024) derived the expressions for rarefaction-induced acceleration
 $g$
as
 \begin{equation} g=\theta _1\xi _1t^{\theta _1-1}+\theta _2\xi _2t^{\theta _2-1}, \end{equation}
velocity
 $u$
as
 \begin{equation} u=\xi _1t^{\theta _1}+\xi _2t^{\theta _2}-\frac {2}{\gamma _{h}-1}c_{h0}, \end{equation}
and displacement
 $x_r$
as
 \begin{equation} x_r=\frac {\xi _1}{\theta _1+1}t^{\theta _1+1}+\frac {\xi _2}{\theta _2+1}t^{\theta _2+1}-\frac {2}{\gamma _h-1}c_{h0}t+\eta , \end{equation}
where
 $\gamma _h$
and
 $c_{h0}$
denote the adiabatic index and sound speed for the heavy fluid, respectively, and
 $\xi _1,\xi _2,\theta _1,$
 $\theta _2$
and
 $\eta$
are determined from geometric relations. In our previous experiments (Gao et al. Reference Gao, Guo, Zhai and Luo2024),
 $\xi _1=0.04475,\,\xi _2=0.95525,\,\theta _1=2891.696,$
 $\theta _2=151.428$
and
 $\eta$
=
 $-$
2900.55 for
 $L_0$
= 710 mm (
 $L_0$
will be defined later). Here,
 $\rho _h$
and
 $\rho _l$
(see derivations in Gao et al. Reference Gao, Guo, Zhai and Luo2024) are respectively expressed as
 $${\rho _h} = {\rho _{h0}}{\left( {1 + {{{\gamma _h} - 1} \over 2}{u \over {{c_{h0}}}}} \right)^{{2 \over {{\gamma _h} - 1}}}},$$
 $${\rho _l} = {\rho _{l0}}{\left( {1 + {{{\gamma _l} - 1} \over 2}{{{u^*}} \over {{c_{l0}}}}} \right)^{{2 \over {{\gamma _l} - 1}}}}{\left( {1 - {{{\gamma _l} - 1} \over 2}{{u - {u^*}} \over {{c^*}}}} \right)^{{2 \over {{\gamma _l} - 1}}}},$$
where
 $\rho _{h0}$
and
 $\rho _{l0}$
denote the initial densities of heavy and light fluids, respectively;
 $\gamma _l$
and
 $c_{l0}$
denote the adiabatic index and sound speed for the light fluid, respectively; and
 $c^*=c_{l0}-(({\gamma _l-1})/{2})u^*$
and
 $u^*=(x_r/t-c_{l0}){2}/({\gamma _l+1})$
, with
 $x_r$
given by (2.4). Substituting (2.2), (2.5) and (2.6) into (2.1) results in a modified form of the Mik model (mMik model). The mMik model can predict the oscillatory perturbation growth when the amplitude growth is within the first and second phases. However, the prediction by the mMik model deviates from the experimental result when the amplitude growth is within the third and fourth phases, which is probably caused by the gas diffusion in experiments. As a result, the mMik model is further modified by considering the diffusion effect, and the modified mMik model is referred to as the mMik2 model. The experimental results show that the mMik2 model can provide a good prediction of the amplitude growth in different phases, and therefore, the mMik2 model is used in this work to predict the RT stable growth rate. The modification of the mMik model and the validation of the mMik2 model can be found in Appendix A.
In this work, it is assumed that when the shock arrives at the evolving interface, the interface still satisfies the small-perturbation hypothesis, such that the linear superposition principle is applicable. For a small-perturbation case, the shock-induced linear amplitude growth can be described by the impulsive model (Richtmyer Reference Richtmyer1960)
 \begin{equation} V_0^R=kU_ca^\ast A^\ast , \end{equation}
where
 $a^\ast$
is the interface amplitude at the time of the shock arrival,
 $U_c$
is the shock-induced jump velocity and
 $A^\ast$
= (
 $\rho _h^\ast - \rho _l^\ast )/(\rho _h^\ast + \rho _l^\ast$
) is the pre-shock Atwood number, with
 $\rho _h^\ast$
and
 $\rho _l^\ast$
being the pre-shock densities of the heavy and light fluids, respectively. The values of
 $U_c$
,
 $\rho _h^\ast$
and
 $\rho _l^\ast$
can be obtained through 1-D gas dynamics theory (Han & Yin Reference Han and Yin1993).
The interface amplitude growth rate (
 $V_0^{\it{sum}}$
) after the shock impact is obtained by linearly superposing the rarefaction-induced RT growth rate and the shock-induced RM growth rate
 \begin{equation} V_0^{\it{sum}}=V^M_0+V_0^R, \end{equation}
where
 $V^M_0$
denotes the RT growth rate obtained from the mMik2 model.
The variations of
 $V_0^R$
,
 $V_0^M$
and
 $V_0^{\it{sum}}$
as a function of
 $L_r$
(the reflection distance determining the shock arrival time and the shock intensity, which will be discussed in § 3) when co-directional rarefaction and shock waves interact with a single-mode air/SF
 $_6$
interface with an initial amplitude (
 $a_0$
) and wavelength (
 $\lambda$
) of 2 and 40 mm (
 $a_0/\lambda =$
0.05, satisfying the small-perturbation hypothesis), respectively, are plotted in figure 3. All scenarios depicted in figure 2(b–e), are covered, except the third scenario in figure 2(b), in which the shock must be sufficiently strong to produce more vorticity at the interface than the rarefaction waves. In the current approach for generating co-directional rarefaction and shock waves, the shock strength positively correlates with
 $L_r$
. When the diaphragm rupture pressure and gas properties are fixed, an increase in the shock strength requires a corresponding increase in
 $L_r$
. However, the extension of
 $L_r$
will prevent the shock from striking the interface during the first phase. Consequently, under the present experimental conditions, the third scenario in figure 2(b) cannot be captured by the theoretical curves shown in figure 3.
Variations of the theoretical curves for
 $V^R_0$
,
 $V^M_0$
and
 $V_0^{\it{sum}}$
as a function of
 $L_r$
in case 2-40. The black star marks the freeze-out of the interface.

As presented in figure 3, in terms of the absolute perturbation growth rate,
 $V_0^{\it{sum}}$
is always smaller than
 $V_0^M$
when the shock arrives at the evolving interface during the first phase. Specifically,
 $V_0^{\it{sum}}=$
0 when
 $L_r=$
0, which, however, cannot be realised in experiments. As a result, in the first phase, the perturbation growth is always reduced by the shock in the present work. When the shock arrives at the evolving interface during the second and fourth phases,
 $V_0^{\it{sum}}$
is always greater than
 $V_0^M$
, and the perturbation growth is always promoted by the shock. When the shock arrives at the evolving interface during the third phase,
 $V_0^{\it{sum}}$
initially surpasses
 $V_0^M$
in absolute value but is overtaken by
 $V_0^M$
as
 $L_r$
increases. Thus, the perturbation growth is first promoted and then reduced by the shock. At a specific
 $L_r$
in the third phase, freeze-out of the perturbation growth can be achieved. In the following, a series of experiments will be designed and conducted in the rarefaction-shock tube to verify the manipulation possibilities.
3. Experimental methods
The experiments are conducted in a rarefaction-shock tube (Gao et al. Reference Gao, Guo, Zhai and Luo2024). As depicted in figure 4(a), this tube, with an inner cross-sectional area of 120 mm
 $\times$
6 mm, consists of four main sections: a 1.0 m vacuum section, a 0.4 m transition section, a 0.45 m test section and a 1.0 m reflection section. The initial pressure in the transition, test and reflection sections is atmospheric. Prior to each experiment, a polyethylene terephthalate (PET) diaphragm separates the vacuum and transition sections. Air within the vacuum section is extracted using a vacuum pump. Once the pressure inside the vacuum section drops to approximately 9 kPa (this pressure ensures that the interface remains consistently in the rarefaction region before the shock arrival (Han & Yin Reference Han and Yin1993)), the PET diaphragm is broken, generating rarefaction waves that propagate downstream along the transition section and a shock wave that propagates upstream along the vacuum section. When the shock collides with the reflecting wall, it reverses direction and propagates downstream. As a result, co-directional rarefaction and shock waves are produced. The evaluation of the boundary-layer effects on interface evolution within this narrow tube is provided in Appendix B.
Schematics of the rarefaction-shock tube (a) and the initial interface location
 $L_0$
along with the reflection distance
 $L_r$
(b).

In this work, the time origin is defined as the moment of the diaphragm rupture. The time (
 $t_s$
) of the shock arriving at the developing interface is controlled by changing the reflection distance (
 $L_r$
), defined as the distance between the diaphragm and the reflecting wall, as shown in figure 4(b). In the experiments, a plate matching the vacuum section’s cross-sectional area is inserted, with its diaphragm-facing surface serving as the reflecting wall. The value of
 $L_r$
is adjusted by using shorter or longer plates to increase or decrease its value. The Mach numbers for the shock generated during diaphragm rupture and the reflected shock from the end wall are 1.61 and 1.50, respectively. As
 $L_r$
varies, the shock Mach number (
 $M_s$
) at
 $t_s$
also changes due to the shock traversing the time-dependent rarefaction regions (Gao et al. Reference Gao, Guo, Zhai and Luo2024). The relationship between
 $t_s$
and
 $L_r$
is determined by numerically solving the shock-rarefaction relations based on 1-D gas dynamics theory (Han & Yin Reference Han and Yin1993), from which
 $M_s$
is positively correlated to
 $L_r$
. In this work,
 $L_r$
varies from 19 to 418 mm, with
 $M_s$
ranging from 1.06 to 1.38.
Three different sets of single-mode interfaces, 1-40, 2-40 and 3-60, with their initial amplitudes and wavelengths listed in table 1, are considered to explore the manipulation of perturbation growth. The initial amplitude–wavelength ratios (
 $a_0$
/
 $\lambda$
) in these single-mode perturbations are 0.025 and 0.05, respectively, satisfying the small-perturbation hypothesis (Gao et al. Reference Gao, Guo, Zhai and Luo2024). The centre of the initial interface is located at
 $L_0$
= 710 mm downstream of the diaphragm, as depicted in figure 4(b). The soap-film technique, which has exhibited its reliability in generating well-defined interfaces (Li et al. Reference Li, Cao, Wang, Zhai and Luo2023), is adopted to create the single-mode perturbations. Transparent acrylic plates, with their edges pre-carved into a sinusoidal shape, are adopted to fabricate the interface device. A super-hydrophobic–oleophobic coating is applied to these sinusoidal edges to confine the soap film to the designed shape. By pulling a rectangular brush dipped in a moderate soap solution along the sinusoidal edges, a soap-film interface is formed. After inserting the interface device into the test section, SF
 $_6$
is injected to replace air on the right side of the soap film, forming an air/SF
 $_6$
interface. In the experiments, the SF
 $_6$
concentration in each run is nearly 100
 $\%$
, leading to an initial Atwood number of approximately 0.67. The experiment under each set of conditions is repeated at least three times to ensure reproducibility. Illuminated by a xenon light source (CEL-HXF300, with a radiant output of 50 W), the flow field is recorded by a schlieren system with a high-speed camera (FASTCAM SA5, Photron Ltd). The frame rate of the camera is 65 100 frames per second, the exposure time is 1
 $\unicode {x03BC}$
s and the pixel resolution ranges from 0.417 to 0.488 mm pixel
 $^{-1}$
. The ambient pressure and temperature are 101
 $\pm$
0.3 kPa and 296
 $\pm$
1.5 K, respectively.
Initial parameters for different single-mode cases. Here,
 $a_0$
and
 $\lambda$
denote the initial amplitude and wavelength, respectively.

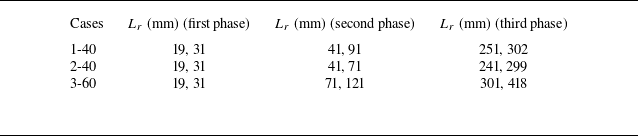
According to figure 3, in each phase of the first three phases, two reflection distances
 $L_r$
are chosen for manipulating the evolution of each single-mode case. The detailed values of
 $L_r$
for different single-mode cases are provided in table 2. Note that, in the present work, the perturbation growth is reduced and promoted, respectively, when the shock arrives at the evolving interface in the first and second phases. In the third phase, only two values of
 $L_r$
corresponding to the promotion and freeze-out of the perturbation growth are chosen, and the scenario corresponding to the reduction of the perturbation growth, which requires a larger
 $L_r$
, is omitted in the experiments. In addition, the scenarios in the fourth phase are also excluded in the experiments. For a larger
 $L_r$
, the interface has evolved for a long time before the shock arrival, and diffuses severely due to sustained effects of the rarefaction waves. It is difficult to identify the interface profile at the shock arrival time. As a result, these scenarios requiring a larger
 $L_r$
are not considered in the experiments.
The values of the reflection distance
 $L_r$
in cases 1-40, 2-40 and 3-60, used for the examination of the manipulation theory.

Taking case 2-40 as an example, we explain the reasons for choosing these different values of
 $L_r$
in different phases. As shown in figure 3, the RT growth rate is negative, while the RM growth rate is positive in the first phase, and the perturbation growth will be reduced. We aim to examine the different degrees of reduction, and
 $L_r=$
19 and 31 mm are selected. When
 $L_r=$
19 mm, the RM growth rate is comparable to the RT growth rate, and the perturbation growth will be greatly reduced. When
 $L_r=$
31 mm, the RM growth rate is much smaller than the RT growth rate, and the perturbation growth will be slightly reduced. In the second phase, both the RT and RM growth rates are negative, and the perturbation growth will be promoted. For the similar purpose,
 $L_r=$
41 and 71 mm are selected. At
 $L_r=$
41 mm, the RM growth rate is much smaller than the RT growth rate, and the perturbation growth will be slightly promoted. At
 $L_r=$
71 mm, the RM growth rate is comparable to the RT growth rate, and the perturbation growth will be greatly promoted. Moreover, around
 $L_r=$
160 mm,
 $V_0^{\it{sum}}$
reaches its negative peak; however, the corresponding
 $L_r$
is not considered, because the pre-shock amplitude no longer satisfies the small-amplitude assumption (
 $a$
/
 $\lambda$
 $\lt$
0.05) (Gao et al. Reference Gao, Guo, Zhai and Luo2024), invalidating the impulsive model (2.7). In the third phase, the RT growth rate is positive, while the RM growth rate is negative, and
 $L_r=$
241 and 299 mm are selected. When
 $L_r=$
241 mm, the RM growth rate is much greater than the RT growth rate in magnitude, and the perturbation growth will be promoted conversely. When
 $L_r=$
299 mm, the perturbation growth is specifically frozen out. For other two cases, the values of
 $L_r$
are chosen for the similar reasons. Particularly, in table 2,
 $L_r=$
302, 299 and 418 mm determined by the manipulation theory correspond to the freeze-out conditions in cases 1-40, 2-40 and 3-60, respectively.
4. Experimental validation
Figures 5(a), 5(b) and 5(c) show the schlieren images of interface evolution at different values of
 $L_r$
for cases 1-40, 2-40 and 3-60, respectively. The blue solid lines in the first row denote the initial interface contours. For clarity, the initial interface is removed from the images through image processing after it departs from its initial position. For each
 $L_r$
, the second row of the images in figures 5(a), 5(b) and 5(c) depicts the interface state at the time of the shock arrival. Here, case 2-40 is taken as an example to discuss the details of the interface evolution. For different
 $L_r$
, the interface behaves differently at the arrival of the shock. For example, at
 $L_r=$
19 mm, the perturbation has not completed the first phase inversion, and its amplitude reduces relative to the initial value. At
 $L_r=$
31 mm, the interface is almost planar, and the perturbation is about to reverse its phase. For other four different values of
 $L_r$
, the perturbation has completed the first phase inversion, but the perturbation has different amplitudes. After the shock impact, the interface evolution transitions from the RT stable state to the RM unstable state, characterised by the asymmetrically developed bubbles and spikes. As shown in the first and second columns, the perturbation is less developed at
 $L_r=$
19 mm relative to that at
 $L_r=$
31 mm, which coincides with the theoretical prediction that the perturbation growth is greatly reduced at
 $L_r=$
19 mm. Relatively, the interface evolves much more rapidly when the shock arrives during the second phase because both the RT and RM growth rates are negative, and the perturbation growth is promoted by the shock, as shown in the third and fourth columns of figure 5. In contrast, in the last column of figure 5, the interface morphology remains almost unchanged after the shock impact, which indicates that freeze-out of the perturbation growth is almost achieved. Similar analysis can be made for cases 1-40 and 3-60, and the details are omitted here.
Schlieren images of interface evolution driven by co-directional rarefaction and shock waves for cases 1-40 (a), 2-40 (b) and 3-60 (c). Numbers in the schlieren images denote time in microseconds. The time origin is defined as the moment of the diaphragm rupture. The rarefaction head arrives at the interface at 2083
 $\unicode {x03BC}$
s. The second row of images in panels (a), (b) and (c) depicts the interface state at the time of the shock arrival.

The amplitude growth at different values of
 $L_r$
for cases 1-40, 2-40 and 3-60 is presented in figures 6(a), 6(b) and 6(c), respectively. In addition, the RT stable amplitude growth is also provided for comparison. The amplitude is determined as half the distance between the manually identified leftmost and rightmost interface positions in the schlieren images. Taking case 2-40 as an example, the post-shock amplitude growth rate at
 $L_r=$
19 mm is smaller than the RT stable growth rate. At
 $L_r$
= 31 mm, the post-shock amplitude growth rate is close to the RT stable growth rate, as indicated in figure 3 where
 $V_0^{\it{sum}}$
is comparable to
 $V_0^{M}$
. At
 $L_r=$
41 and 71 mm, the post-shock amplitude growth rates are greater than the RT stable growth rate, and the perturbation growth at
 $L_r=$
71 mm is promoted obviously relative to that at
 $L_r=$
41 mm. At
 $L_r=$
241 mm, the perturbation growth rate is reversed, and freeze-out of perturbation growth is observed at
 $L_r$
= 299 mm. To sum up, the perturbation growth tendency at each
 $L_r$
is consistent with the prediction illustrated in figure 3. Similar conclusions can also be reached for other two cases.
Temporal variations of interface amplitudes at different shock arrival times for cases 1-40 (a), 2-40 (b) and 3-60 (c). RTS denotes the amplitude growth in RT stability.

According to figure 3, in each phase of the first three phases, two reflection distances
 $L_r$
are chosen for manipulating the evolution of each single-mode case. The detailed values of
 $L_r$
for different single-mode cases are provided in table 2. Note that, in the present work, the perturbation growth is reduced and promoted, respectively, when the shock arrives at the evolving interface in the first and second phases. In the third phase, only two values of
 $L_r$
corresponding to the promotion and freeze-out of the perturbation growth are chosen, and the scenario corresponding to the reduction of the perturbation growth, which requires a larger
 $L_r$
, is omitted in the experiments. In addition, the scenarios in the fourth phase are also excluded in the experiments. For a larger
 $L_r$
, the interface has evolved for a long time before the shock arrival, and diffuses severely due to sustained effects of the rarefaction waves. It is difficult to identify the interface profile at the shock arrival time. As a result, these scenarios requiring a larger
 $L_r$
are not considered in the experiments.
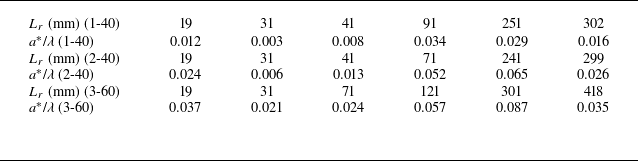
In addition, by linearly fitting the experimental data, the post-shock linear amplitude growth rates are obtained, as presented in figure 7, together with the theoretical curves obtained from (2.8). The results in figure 7 show averaged data from three independent experimental runs, with error bars reflecting both experimental variability and measurement uncertainties. Generally, the linear superposition principle (2.8) is applicable to calculating the post-shock amplitude growth rate in the present work. Discrepancies between the theoretical predictions and the experimental results arise at moderate
 $L_r$
values in cases 2-40 and 3-60. To explain the discrepancy, the values of
 $a^\ast$
/
 $\lambda$
at different
 $L_r$
in cases 1-40, 2-40 and 3-60 are provided in table 3. In four instances, the values of
 $a^\ast$
/
 $\lambda$
slightly exceed the small-amplitude assumption threshold of 0.05, specifically, at
 $L_r$
= 71 and 241 mm for case 2-40 and
 $L_r$
= 121 and 301 mm for case 3-60. Under these conditions, the impulsive model (2.7) overpredicts the shock-induced amplitude growth rate (Rikanati et al. Reference Rikanati, Oron, Sadot and Shvarts2003; Dimonte & Ramaprabhu Reference Dimonte and Ramaprabhu2010; Guo et al. Reference Guo, Si, Zhai and Luo2022), leading to a slight overestimation of the experimental results by the linear superposition model (2.8). Overall, the present work verifies the validity of the new model and the feasibility of manipulating the light/heavy perturbation via co-directional rarefaction and shock waves.
Comparison of the linear amplitude growth rates after the shock impact between experimental results and theoretical predictions from (2.8).

The values of
 $a^\ast$
/
 $\lambda$
at different
 $L_r$
in cases 1-40, 2-40 and 3-60.

5. Conclusion
In this work, we aim to manipulate the development of a single-mode light/heavy interface using co-directional rarefaction and shock waves. After the light/heavy interface is accelerated by rarefaction waves, RT stability occurs and the perturbation amplitude growth will experience an oscillation. The RT stable state can be divided into four different stages with different perturbation phases and amplitude variations. When a shock propagating in the same direction as the rarefaction waves further strikes the evolving interface, the interface evolution will transition from RT stability to RM instability. Depending upon the interface state when the shock arrives, the perturbation growth can be actively manipulated through controlling the magnitudes of the vorticities deposited by rarefaction and shock waves.
According to the directions and magnitudes of the vorticities deposited by rarefaction and shock waves, as well as the perturbation phase, we theoretically conclude that there are twelve different growth possibilities of a light/heavy interface accelerated by co-directional rarefaction and shock waves. Specifically, when the shock hits the evolving interface in the first and third stages, the perturbation growth after the shock impact can either be promoted, reduced or frozen out relative to the RT growth, depending on the relative magnitudes of the vorticities deposited by the shock and rarefaction waves. When the shock hits the evolving interface in the second and fourth stages, the perturbation growth after the shock impact is always promoted relative to the RT growth, since the vorticities produced by the shock and rarefaction waves have the same sign.
Since the sustained pressure gradient from the rarefaction waves significantly enhances gas diffusion across the interface, the RT stable amplitude growth at late stages is reduced. The classic model proposed by Mikaelian (Reference Mikaelian2009b ) is revised by incorporating the gas diffusion effects to describe the RT stable growth. Subsequently, a theoretical model is established by combining the RT growth rate with the RM growth rate, and the new model provides the conditions for the different possibilities of the perturbation growth. Then based on the new model, extensive experiments are designed and conducted in the specially designed rarefaction-shock tube. By precisely controlling the shock arrival time at the interface, the different growth possibilities, including promotion, reduction and freeze-out, are realised in experiments. This work verifies the feasibility of manipulating the light/heavy perturbation via co-directional rarefaction and shock waves, which sheds light on the control of hydrodynamic instabilities in practical applications.
Funding
This work was supported by the National Natural Science Foundation of China (Nos. 12302371, 12372281 and 12388101), the Youth Innovation Promotion Association CAS, the Strategic Priority Research Program of Chinese Academy of Sciences (No. XDB0620201) and the Fundamental Research Funds for the Central Universities (No. WK2090000048).
Declaration of interests
The authors report no conflict of interest.
Appendix A. Modification of the mMik model
For small-amplitude RT stable behaviour in rarefaction-driven flows, Mikaelian (Reference Mikaelian2009b
) derived an implicit expression (2.1), denoted as the Mik model, to describe the oscillatory amplitude growth. Further, in our previous work, Gao et al. (Reference Gao, Guo, Zhai and Luo2024) revised the Mik model by providing the analytical expressions for the rarefaction-induced acceleration and density, and the revised model is referred to as the mMik model. Experiments of single-mode air/SF
 $_6$
interfaces driven by rarefaction waves are conducted to assess the validity of the mMik model. Figure 8(a) presents the experimental schlieren images of interface evolution for case 2-40. After the rarefaction head reaches the interface (
 $t$
= 2083
 $\unicode {x03BC}$
s, not displayed), the interface continuously reverses its phase. Note that the interface becomes less distinct at late stages (4055–4460
 $\unicode {x03BC}$
s), because the sustained pressure gradient provided by the rarefaction waves intensifies the molecular diffusion of the two gases, reducing the density gradient across the interface. Simulations using the numerical solver HOWD (Ding et al. Reference Ding, Si, Chen, Zhai, Lu and Luo2017) are performed to further investigate the gas diffusion. The numerical schlieren images of the interface evolution, as shown in figure 8(b), demonstrate good agreement with the experimental results. Figure 8(c) displays the distribution of SF
 $_6$
in mass fraction obtained from numerical simulations, ranging from 0.1
 $\%$
to 99.9
 $\%$
. At late stages, a distinct diffusion layer is present across the interface.
Experimental (a) and numerical (b) schlieren images, as well as SF
 $_6$
distribution in mass fraction (c) of a single-mode air/SF
 $_6$
interface driven by rarefaction waves for case 2-40. Numbers in panel (a) denote time in microseconds. Comparison of the RT stable perturbation growth between experimental results and theoretical predictions (d).

Comparison of the RT stable amplitude growth extracted from the experiments and predicted by the mMik model is presented in figure 8(d). The mMik model can provide a good prediction of the experimental data before the second phase ends. After that, the prediction by the mMik model deviates from the experimental data due to gas diffusion effects. To characterise the influence of gas diffusion, a growth reduction factor denoted as
 $\psi$
(LeLevier, Lasher & Bjorklund Reference LeLevier, Lasher and Bjorklund1955; Duff, Harlow & Hirt Reference Duff, Harlow and Hirt1962; Morgan, Likhachev & Jacobs Reference Morgan, Likhachev and Jacobs2016) is introduced to modify (2.1), resulting in the following expression:
 \begin{equation} \rho _h\frac {\textrm {d}}{\textrm {d}t}\left [\frac {1}{\rho _h}\frac {\textrm {d}}{\textrm {d}t}(\rho _ha)\right ]+\rho _l\frac {\textrm {d}}{\textrm {d}t}\left [\frac {1}{\rho _l}\frac {\textrm {d}}{\textrm {d}t}(\rho _la)\right ]-(\rho _h-\rho _l)\frac {gka}{\psi }=0. \end{equation}
The value of
 $\psi$
is first determined using a 1-D gas diffusion approach. The total chemical potential (
 $\mu$
) of a gas in rarefaction-driven flows can be expressed as
 \begin{equation} \mu (x)=mg(x)x+k_bT(x)\ln p(x)+\mu _{ref}. \end{equation}
Here,
 $m$
denotes the relative molecular mass;
 $k_b$
denotes the Boltzmann constant;
 $\mu _{\it{ref}}$
, a constant quantity, denotes the chemical potential of an arbitrary reference state; and
 $T$
and
 $p$
denote the rarefaction-induced temperature and pressure for the heavy gas
 $$T = {T_0}{\left( {1 + {{{\gamma _h} - 1} \over 2}{u \over {{c_{h0}}}}} \right)^2},$$
 $$p = {p_0}{\left( {1 + {{{\gamma _h} - 1} \over 2}{u \over {{c_{h0}}}}} \right)^{2{\gamma _h}/({\gamma _h} - 1)}},$$
with
 $T_0$
and
 $p_0$
representing the initial temperature and pressure, respectively. Based on
 $\mu (x)$
, the gas diffusion flux (
 $J$
) can be calculated by
 \begin{equation} J(x)=-\frac {Dp(x)}{kT(x)}\frac {\partial \mu (x)}{\partial x}, \end{equation}
where
 $D\propto T^{3/2}/p$
is the diffusion coefficient. The diffusion profile can be described by the Gaussian error function for mass fraction
 \begin{equation} {\textrm {erf}}(x)=-\frac {1}{\sqrt {\sigma \pi }}\int _{0}^{x}e^{-\frac {y^2}{\sigma }}{\textrm {d}}y, \end{equation}
where
 $\sigma$
is a time-dependent variable, introduced to adjust the gas distribution in mass fraction. Taking arbitrary values for the initial amount (
 $\epsilon _0$
) of diffused gas and the initial diffusion distance (
 $\delta _0$
), the total amount (
 $\epsilon$
) of diffused gas can be calculated by
 \begin{equation} \epsilon =\epsilon _0+\int \int J(x){\textrm {d}}t\;{\textrm {d}}y. \end{equation}
Assuming that the position where the mass fraction of the heavy gas equals 99.9
 $\%$
is the edge of the diffusion layer, the relationship between
 $\epsilon$
and the error function can be expressed as
 $$99.9\,\% = - {1 \over {\sqrt {\sigma \pi } }}\int_0^\delta {{e^{ - {{{y^2}} \over \sigma }}}} {\rm{d}}y,$$
 $$\epsilon= \kappa \int_0^\delta {\left( { - {1 \over {\sqrt {\sigma \pi } }}\int_0^x {{e^{ - {{{y^2}} \over \sigma }}}} {\rm{d}}y} \right)} \,{\rm{d}}x,$$
where
 $\delta$
, as a function of time, denotes the gas diffusion distance at the mass fraction of 99.9
 $\%$
;
 $\kappa$
is a proportional factor, which is obtained by substituting
 $\delta _0$
and
 $\epsilon _0$
into (A8) and (A9). Once
 $\kappa$
is determined,
 $\sigma$
and
 $\delta$
can also be obtained by solving (A8) and (A9). Ultimately, the growth reduction factor
 $\psi$
can be calculated by substituting the value of
 $\delta$
into the following empirical model (LeLevier et al. Reference LeLevier, Lasher and Bjorklund1955):
 \begin{equation} \psi =\frac {k+K}{K}, \end{equation}
where
 $K$
is determined by
 \begin{equation} \rho _h=\rho _l+\frac {1}{2}(\rho _h-\rho _l)e^{-K\delta }. \end{equation}
Substituting the value of
 $\psi$
determined by (A10) into (A1) yields the mMik1 model. The theoretical curves produced by the mMik1 model are presented in figure 8(d). Relative to the mMik model, the mMik1 model effectively captures the experimental RT stable growth in the second and third phases. However, a slight deviation between the experimental results and the theoretical predictions by the mMik1 model still occurs. This is mainly because
 $\psi$
is derived based on 1-D gas diffusion, whereas the initial single-mode perturbation results in quasi-2-D gas diffusion, as illustrated in figure 8(c).
The second approach, which fits the data from the quasi-2-D RT stable experiments, is adopted to determine the value of
 $\psi$
. If the acceleration and density in the flow are constant, (A1) reduces to Taylor’s equation (Taylor Reference Taylor1950)
 \begin{equation} \frac {\textrm {d}^2a}{\textrm {d}t^2}- \frac {\bar {A}\bar {g}ka}{\psi }=0, \end{equation}
where
 $\bar {A}$
and
 $\bar {g}$
denote the average values for the time-dependent Atwood number and acceleration in rarefaction-driven flows, respectively. The solution to the amplitude
 $a$
of (A12) has the form of cosh(
 $\omega t$
), where
 $\omega =\sqrt {k\bar {A}\bar {g}/\psi }$
is the initial growth rate. The RT stable amplitude growth in each phase follows this cosh(
 $\omega t$
) form, which can be found by a coordinate transformation of the data in figure 8(d). To obtain the expression for the amplitude in each phase,
 $\bar {A}$
and
 $\bar {g}$
are taken as the average values of the Atwood number and acceleration in each phase. Additionally, a signed Atwood number
 $\bar {A}$
is used to solve (A12): in the first and third phases,
 $\bar {A}$
is negative, while in the second phase,
 $\bar {A}$
is positive. Then, by solving (A12), the RT stable amplitude in the first three phases can be expressed as
 $$a(t) = 2{a_0} - {a_0}\cosh (\omega t),\,{\rm{in}}\,{\rm{the}}\,{\rm{first}}\,{\rm{phase}},$$
 $$a(t) = - 2{a_1} + {a_1}\cosh [\omega ( - t + {t_1})],\,{\rm{in}}\,{\rm{the}}\,{\rm{second}}\,{\rm{phase,}}$$
 $$a(t) = - 2{a_1} + {a_1}\cosh [\omega (t - {t_1})],\,{\rm{in}}\,{\rm{the}}\,{\rm{third}}\,{\rm{phase}},$$
where
 $a_1$
and
 $t_1$
denote the amplitude and time at the separation point between the second and third phases.
Figures 9(a) and 9(b) show the measured RT stable amplitude in the second and third phases for case 2-40, plotted using (A14) and (A15), respectively. The amplitude growth falls on a straight line, and the slope of the line yields the value of
 $\omega$
. Then, by solving
 $\omega =\sqrt {k\bar {A}\bar {g}/\psi }$
, the values of
 $\psi$
in the second (third) phase for cases 1-40, 2-40 and 3-60 are determined as 1.601 (1.658), 1.411 (1.621) and 1.275 (1.435), respectively. In the first phase, gas diffusion is minimal (see figure 8(a–c)), resulting in
 $\psi$
= 1. This is also confirmed by the good agreement between the experimental data and the mMik model in the first phase, as shown in figure 8(d). Substituting the corresponding value of
 $\psi$
into (A1) for each phase yields the mMik2 model. As illustrated in figure 8(d), the mMik2 model provides more accurate predictions of the experimental RT stable growth across different phases relative to the mMik1 model.
The extraction of the growth rate
 $\omega$
in the second (a) and third (b) phases for case 2-40. Here,
 $\omega$
is found by extracting the slope of the linear fit to the amplitude data, plotted using (A14) and (A15) for the second and third phases, respectively.

Appendix B. Boundary-layer effects
The effect of the shock-induced boundary layer on interface evolution in such a narrow tube has been verified to be negligible in our previous work (Zhai et al. Reference Zhai, Chen, Xing, Li, Cao, Wang and Luo2025). Therefore, only the boundary-layer effect induced by the rarefaction waves is evaluated in the present study.
The boundary-layer thickness along the tube wall decreases from the diaphragm toward the rarefaction head, because the gas flow direction is opposite to that of the rarefaction head. Once the rarefaction head reaches the interface, the interface begins to move upstream, and the boundary layer at the interface starts to develop. The flow field in the rarefaction region is considered laminar, and the boundary-layer thickness (
 $\delta ^{\ast }$
) at the interface can be calculated using
 $\delta ^{\ast }=\sqrt {\pi /2}\sqrt {2\nu \Delta x/u_e}|1-u_w/u_e|$
(Mirels Reference Mirels1956). Here,
 $\Delta x$
is the distance travelled by the rarefaction head after it separates from the interface;
 $\nu =\mu /\rho$
, where
 $\mu$
is the viscosity coefficient of the gas and
 $\rho$
is gas density at the interface;
 $u_w$
and
 $u_e$
are the velocity of the rarefaction head and its relative velocity with respect to the interface, respectively. In our experiments, the rarefaction head travels for approximately 3 ms after departing from the interface (see figure 6), leading to
 $\Delta x \approx 651$
mm. The values of
 $\mu$
for air and SF
 $_6$
are 1.81
 $\times$
10
 $^{-5}$
and 1.60
 $\times$
10
 $^{-5}$
Pa s, respectively. Here,
 $u_w$
is approximately 135.1 m s
 $^{-1}$
, equal to the local sound speed of SF
 $_6$
in front of the rarefaction head. The interface velocity and gas densities in the rarefaction region vary with time. Based on (2.3), (2.5) and (2.6), when
 $\Delta x$
= 651 mm,
 $u_e$
and the densities for air and SF
 $_6$
at the interface are 285.2 m s
 $^{-1}$
, 0.98 and 1.95 kg m
 $^{-3}$
, respectively. Accordingly,
 $\delta ^\ast$
is estimated to be approximately 0.19 mm for air and 0.13 mm for SF
 $_6$
. These values are significantly smaller than the height and width of the flow cross-section (6 and 120 mm, respectively), indicating that the rarefaction-induced boundary layer has a negligible effect on the interface evolution.
In addition, the effect of the boundary layer on the interface evolution would be manifested through pressure waves that impart additional acceleration to the interface. In our previous study (Gao et al. Reference Gao, Guo, Zhai and Luo2024), the evolution of an initially flat interface accelerated by co-directional rarefaction and shock waves was examined. The interface motion showed good agreement with 1-D theoretical predictions that consider only the co-directional rarefaction and shock waves, without accounting for boundary-layer effects. This also indicates that the boundary-layer effect on the interface evolution is limited.