Introduction
The last decade has seen a surge of research efforts on the effects of specimen size on the strength and deformation of single-crystal, monolithic metals in the micrometer size regimen. Notable observations include the power-law dependence of yield strength on size,[ Reference Dou and Derby 1 , Reference Greer and De Hosson 2 ] with a great deal of insights gained into the nucleation of dislocations from a hitherto dislocation-free state,[ Reference Ngan, Zuo and Wo 3 , Reference Zuo and Ngan 4 ] deformation under a continuous dislocation-starved state,[ Reference Greer, Oliver and Nix 5 – Reference Shan, Mishra, Asif, Warren and Minor 7 ] stochastic deformation,[ Reference Parthasarathy, Rao, Dimiduk, Uchic and Trinkle 8 – Reference Cui, Po and Ghoniem 11 ] and so on. It is by now well known that for crystal sizes ranging from about 1 µm to tens of micrometers, the yield strength σ y roughly obeys a power-law variation with respect to specimen size D:
 $$\sigma _y \; \sim\; D^{ - m}, $$
where m typically varies between 0.5 and 1.[ Reference Dou and Derby 1 , Reference Greer and De Hosson 2 ] Thanks to efforts on discrete dislocation dynamics (DDD) simulations,[ Reference Parthasarathy, Rao, Dimiduk, Uchic and Trinkle 8 , Reference Rao, Dimiduk, Parthasarathy, Uchic, Tang and Woodward 12 – Reference Cui, Lin, Liu and Zhuang 17 ] the decreasing trend of σ y with D in this regimen has now been shown, due to the group interactions of dislocations in a limited crystal volume, and specifically, the operation of half Frank–Read sources,[ Reference Parthasarathy, Rao, Dimiduk, Uchic and Trinkle 8 , Reference Rao, Dimiduk, Parthasarathy, Uchic, Tang and Woodward 12 , Reference El-Awady, Wen and Ghoniem 13 ] which are Frank–Read sources truncated by the free surface of the specimen. A decreasing trend of σ y with D can be understood as the consequence of a scaling between the length of such half Frank–Read sources and the specimen size.[ Reference Parthasarathy, Rao, Dimiduk, Uchic and Trinkle 8 , Reference Rao, Dimiduk, Parthasarathy, Uchic, Tang and Woodward 12 , Reference El-Awady, Wen and Ghoniem 13 ]
In the size regimen of less than a fraction of a micrometer or so, tremendous efforts of in situ electron microscopy have been made to understand the strength and deformation of various materials.[ Reference Shan, Mishra, Asif, Warren and Minor 7 , Reference Yu, Legros and Minor 18 , Reference Imrich, Kirchlechner, Kiener and Dehm 19 ] For face-centered cubic (FCC) metals, the results generally point to the difficulty in storing dislocations, i.e., the so-called dislocation starvation condition, in this size regimen.[ Reference Greer, Oliver and Nix 5 , Reference Greer and Nix 6 ] Strength in this regimen is therefore controlled by the continuous need to nucleate new dislocations, while old ones zip out of the small crystal volume without encountering much difficulty. In this regimen, the strength data usually scatter significantly, making it difficult to draw clear-cut conclusions on whether strength varies with size,[ Reference Maaß, Meza, Gan, Tin and Greer 20 , Reference Chen, He, Shin, Richter and Gianola 21 ] although theoretically, it has been predicted that a weak size effect should exist, due to the expectation that a smaller specimen should contain fewer potential sites for dislocation nucleation.[ Reference Ngan, Zuo and Wo 3 , Reference Zuo and Ngan 4 ] For pristine body-centered cubic (BCC) crystals with a low dislocation content, strength in this regimen often approaches the ideal strength limit of about 10% of the elastic modulus, but flow instability in the form of sudden plastic collapse occurs immediately after the onset of yielding.[ Reference Bei, Shim, Pharr and George 22 ] Mechanistically, molecular dynamics have shown that a dislocation starved state is not achieved in submicron BCC crystals due to the frequent cross-slip, or pencil glide, of screw segments of dislocations in this crystal structure, making dislocations difficult to zip out of the crystal volume.[ Reference Weinberger and Cai 23 ]
From the quick survey above, tremendous progress has been made in the past decade, on the understanding of small-scale plasticity. However, the knowledge database gathered so far has been limited to metals with a monolithic, single-crystalline microstructure. Materials for real applications often contain more complex microstructures including dislocation networks or patterns (e.g., subcells), grain boundaries, precipitates, and so on. These microstructures are often associated with their own characteristic length scales, such as the spacing between dislocations or precipitates, grain or dislocation subcell size, etc. For bulk pieces of specimens with dimensions much larger than the microstructural length scale, strength, and deformation will be governed by the microstructural length scale alone, according to well established laws such as Taylor work hardening, where flow stress is inversely proportional to dislocation spacing, the Orowan looping mechanism where precipitation hardening varies inversely with the precipitate spacing, the Hall–Petch relation where strength varies with the inverse of the square-root of grain size, or inverse Hall–Petch behavior for nanocrystalline materials where strength decreases with decreasing grain size in the nanometric range. However, when the specimen size is also in the micrometer regimen, the internal (microstructural) length scale will also be in the same size regimen as the external (specimen size) length scale, and then the two length scales (external and internal) may couple together[ Reference Zhu, Bushby and Dunstan 24 ] to result in interesting effects on strength and deformation unseen before. While this would seem obvious, the literature is still critically short of such information and knowledge. The present authors have recently studied such coupled effects of external and internal lengths scales for some representative types of microstructures, and it is the aim of the present article to summarize the relevant findings, in order to show the magnitude of the problem.
Dislocation microstructures
The first type of microstructure discussed is the pre-existing dislocations themselves. For this, we limit ourselves to situations where dislocation storage can occur effectively, and, as mentioned above, this would be the case for specimen sizes typically larger than ~1 µm. In this case, Eq. (1) generally holds, but recent experiments and DDD simulations have shown that the stress exponent m is quite sensitive to the initial dislocation content in the crystal.[ Reference Ngan 25 – Reference El-Awady 30 ]
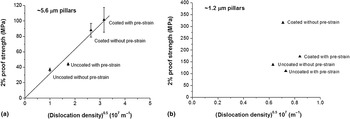
To explain why the size dependence has to follow the very simple power law in Eq. (1), and what governs the value of m, we proposed a simple, analytical theory.[ Reference Ngan 25 , Reference Gu and Ngan 26 ] The starting premise is that, in a situation where dislocation storage and hence mutual interactions are possible, strength is controlled by Taylor hardening. Experimental support for this is provided by residual dislocation-density measurement from deformed micro-pillars, as shown in Fig. 1. Here, means including coating and pre-straining of the micro-pillars were used to mediate the initial dislocation contents and their escape from the crystal volume during compressive deformation.[ Reference Gu and Ngan 31 ] For a larger size (5.6 µm) of micro-pillars [Fig. 1(a)], the proof strength of the pillars exhibited excellent scaling with the square-root of the measured density of the residual dislocations in the pillars, indicating that strength of this pillar size is dominated by the Taylor interaction mechanism. However, for a smaller pillar size of ~1 µm [Fig. 1(b)], there is no clear trend between proof strength and residual dislocation density, and in fact, the residual dislocation density remained at a lower level not significantly changeable by the means of pre-straining or pillar coating.
2% proof strength versus residual dislocation density in aluminum micro-pillars of two sizes (a) 5.6 µm and (b) 1.2 µm. Adapted with permission from Ref. Reference Gu and Ngan31, Elsevier, 2012.

Thus, for the case when dislocation storage happens and strength is dominated by Taylor hardening, we are compelled by experimental evidence to consider a dislocation network in which dislocation segments become mobile if the applied stress σ is larger than the segment mobile stress
 $\sigma _{\rm s} \sim \mu b/L$
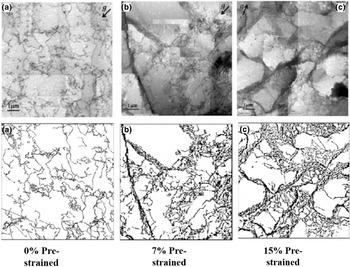
, where L is the segment length and other terms have their usual meanings. Out of such a “master” dislocation microstructure (say, a given one in Fig. 2), specimens of different micro-volumes are cropped, and since the specimen size is comparable with the internal length scale L, which itself is non-uniform in the master microstructure, the micro-specimens exhibit different strength. In addition to such an assumed picture, we make two further, soft assumptions: (1) the dislocation network of the master microstructure is a fractal of dimension q, so that the dislocation mesh length L is statistically distributed as ~1/L
q
[Fig. 3(a)]; (2) the dislocation velocity obeys a simple, empirical law
 $v \sim \sigma ^n $
.
Dislocation structures of aluminum at different pre-strain levels (a) 0%, (b) 7%, and (c) 15% (top panels real, lower panels digitized bitmaps). Adapted with permission from Ref. Reference Gu and Ngan26, Elsevier, 2013.

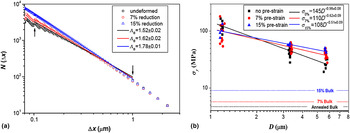
(a) “Box-counting” fractal analysis of the dislocation networks in the different pre-strained master microstructures corresponding to Fig. 2. (b) Size dependence of proof strength of aluminum micro-pillars milled from different pre-strained master microstructures in Fig. 2. Adapted with permission from Ref. Reference Gu and Ngan26, Elsevier, 2013.

Thus, for a volume
 $\!\sim\!D^3 $
harvested from the master microstructure, the number of mobile dislocation segments under a current applied stress σ would be
 $ \propto D^3 \times$
 $\int_0^\sigma {\,p(\sigma _{\rm s} )d\sigma _{\rm s} \propto D^3 \sigma ^{{\rm q} - 1} /(q - 1)} $
, where p(σ
s) is the probability distribution function of the mobilization stress σ
s of dislocation segments given by
 $p(\sigma _{\rm s} ) \sim \vert {dL/d\sigma _{\rm s}} \vert /L^{\rm q} \sim \sigma _{\rm s}^{{\rm q} - 2} $
, due to the Taylor hardening law as well as assumption (1) above. Then, for a large ensemble of micro-specimens of the same volume D
3 subject to loading at a constant stress rate
 $\dot \sigma $
, the ensemble yielding rate (i.e., the fraction of specimens yielded per unit time) is
 $$\dot N \sim v \times \displaystyle{{D^3 \sigma ^{{\rm q} - 1}} \over {(q - 1)}} = \alpha \displaystyle{{D^3 \sigma ^{{\rm q} + n - 1}} \over {(q - 1)}},$$
where v is dislocation velocity and α is a constant. At a current stress level σ, the survivability (without yielding) of the specimens in the ensemble is therefore
 $$\eqalign{F(\sigma )& = \exp \left[ { - \displaystyle{1 \over {\dot \sigma}} \mathop \int \limits_0^\sigma \dot N(\sigma {\rm ^{\prime}})d\sigma {\rm ^{\prime}}} \right] \cr & = \exp \left[ { - \displaystyle{\alpha \over {\dot \sigma (q + n)(q - 1)}}\; D^3 \sigma ^{{\rm q} + n}} \right].}$$
At a given F (say, 50%), Eq. (3) requires D 3 σ q+n to be constant, thus giving
 $$\sigma \sim D^{ - m} \quad {\rm where}\quad m = 3/(q + n).$$
Equation (1) is now proven, and the size exponent m is now understood to be inversely related to the fractal dimension q of the master dislocation microstructure, as well as the stress exponent n of the dislocation velocity. Interestingly, for three-dimensional (3D) fractals, 2 < q < 3, and since 0 < n < ∞, m is bounded as 0 < m < 1.5. This tallies with the fact that so far, no experimental report has concluded an m value higher than 1.5.
Equation (4) indicates that, unlike what is commonly assumed in the literature, the size exponent m is not a material parameter, but instead, it depends on the initial dislocation structure of the master microstructure from which the micro-specimens are harvested. Further evidence for Eq. (4) was provided by the pre-straining experiments shown in Figs. 2 and 3.[ Reference Gu and Ngan 26 ] Here, micropillars were focused-ion-beam milled on a large aluminum grain, and after compression testing and recording the proof strength, the entire specimen with the micropillars were cold-rolled to a higher pre-strain, and then pillar milling and compression testing were repeated. This sequence was repeated twice for different pre-strains of 7% and 15% shown in Fig. 2, and Fig. 3(b) shows the size dependence of strength measured from the micro-pillars. It can be seen that the size exponent m decreases from 0.98 for no pre-strain, to 0.62 for 7% pre-strain, and then to 0.51 for 15% pre-strain. At each pre-strain, the dislocation microstructure in the master microstructure was imaged by transmission electron microscopy (TEM) and was digitized, and was then analyzed by the box-counting method as shown in Fig. 3(a). Here, the box-counting dimension ΛB is for a 2D projection (the TEM image) of a 3D microstructure, and hence it is bounded by 1 < ΛB < 2, instead of the[ Reference Greer and De Hosson 2 , Reference Ngan, Zuo and Wo 3 ] bounds for q mentioned above. Nevertheless, it can be seen that as the pre-strain increases from 0% to 7% and then to 15%, ΛB increases from 1.52 to 1.62 to 1.78. Thus, on increasing pre-strain, m decreases while the fractal dimension ΛB (or q) increases. The inverse relation between m and q in Eq. (4) is thus verified, at least in a qualitative way. The most important conclusion is that the size exponent m in Eq. (4) is not a material constant, because for the same material (e.g., Al in Figs. 2 and 3), different m values can be obtained, depending on the pre-strain and hence the initial dislocation configuration of the master microstructure.
Polycrystalline microstructures
We discuss next the role of polycrystalline microstructures in affecting strength and deformation of micro-scaled specimens.[
Reference Ehrler, Hou, Zhu, Png, Walker, Bushby and Dunstan
32
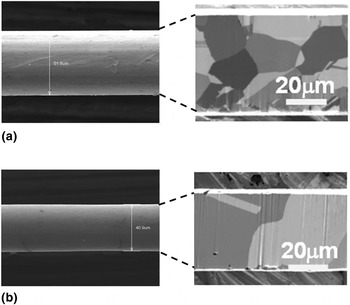
] To illustrate what could be of interest, we consider the issue of whether the Hall–Petch relation would hold for micrometer-sized specimens with a few grains across the specimen thickness. Figure 4 shows examples of this category. In this experiment, Ag micro-wires with an initial thickness of ~50 µm [Fig. 4(a)] were heat treated to obtain different grain sizes, and these wires were then etched by acid to thinner thickness, followed by tensile testing to determine their strength.[
Reference Chen and Ngan
33
]
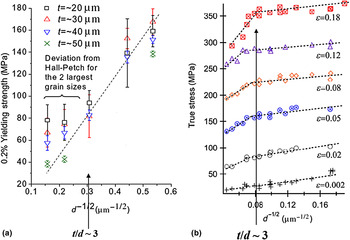
Figures 4(a) and 4(b) show two examples of the polycrystalline microstructure, and Fig. 5(a) shows the Hall–Petch plots, i.e., strength versus (grain size)−1/2, of such micro-wires. As a comparison, the Hall–Petch plots of bulk nickel foils with thickness in the millimeter scale are also shown in Fig. 5(b). In both cases of micro- and bulk specimens, the strength deviates from the Hall–Petch trend for the polycrystalline state where there three or fewer grains across the specimen thickness, i.e., when the specimen thickness-to-grain size ratio
 $t/d \; \widetilde \lt \; 3$
. For bulk-scale specimens in Fig. 5(b), the deviation is a negative one, which has been understood due to the fact that grains that are exposed to the specimen free surfaces are softer, and when t/d is small, such soft surface grains are present in large quantities, so that the overall strength becomes lower.[
Reference Keller, Hug and Feaugas
34
] However, for specimens with thickness t in the micro-scale [Fig. 5(a)], the deviation from the Hall–Petch trend for
 $t/d\; \widetilde \lt \; 3$
becomes positive. In this case, the surface grains that are present in large quantities for
 $t/d\; \widetilde \lt \; 3$
are stronger, not softer, than the interior grains.
Silver micro-wires containing a few grains across their thickness: (a) a wire with thickness t ≈ 50 µm and internal grain size d ≈ 21 µm, (b) another wire with thickness t ≈ 40 µm and internal grain size d ≈ 40 µm, exhibiting a “bamboo” grain structure. Adapted with permission from Refs. Reference Chen and Ngan33, Reference Chen and Ngan35, Elsevier, 2011.

Hall–Petch plots of strength versus (grain size)−1/2 for (a) silver polycrystalline micro-wires with specimen thickness t = 20–50 µm (reproduced with permission from Ref. Reference Chen and Ngan33, Elsevier, 2011), (b) bulk nickel polycrystalline foils with specimen thickness t = 0.5 mm (adapted with permission from Ref. Reference Keller, Hug and Feaugas34, Elsevier, 2011). In both cases, deviation from the Hall–Petch trend for the mean-field behavior occurs when
 $t/d\; \widetilde \lt \; 3$
(d = grain size), i.e., when there are fewer than about three grains across the thickness of the specimen. In the case of bulk specimens (b), the deviation is a reduction compared with Hall–Petch, while for micro-specimens (a), the deviation is an increment.

Dislocation-density measurements in fact showed that dislocations in such micrometer-wires do not accumulate when the t/d ratio is low.[
Reference Chen and Ngan
35
]
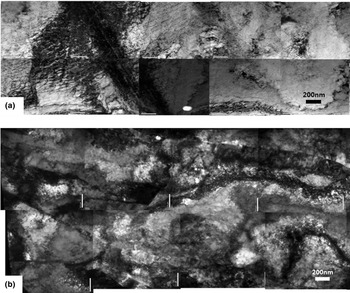
Figures 6(a) and 6(b) show the deformed dislocation microstructures of two Ag micro-wires with t/d ratio of 1.2 and 7.8, respectively, at comparable tensile elongations and initial dislocation contents. It can be seen that for the case of t/d ≈ 1.2 [Fig. 6(a)], the deformed dislocation density remains at a low value of
 $\sim \!3 \times 10^{14} $
m−2 compared with the initial dislocation density of
 $\sim \!2 \times 10^{14} $
m−2, but for the high t/d ratio case of 7.8 [Fig. 6(b)], the dislocation density increased significantly to
 $\sim \!1 \times 10^{16} $
m−2 after deformation. Micro-samples with low t/d ratios approaching unity are obviously similar to single-crystalline micro-pillars for which the size effect in Eq. (1) is valid, where dislocations can easily zip out of the free surfaces during deformation instead of accumulate. Hence, in a micro-wire with a low t/d ratio, grains that are exposed to free surfaces should be in a dislocation starved state and so they are stronger than any interior grains present.
Large-area TEM montages of deformed microstructures in Ag micro-wires. Individual dislocations can be seen at edges of diffraction bend contours. (a) Wire thickness t ≈ 50 µm and internal grain size d ≈ 40.6 µm (t/d ≈ 1.2), with residual dislocation density estimated at
 $\sim \!3 \times 10^{14} $
m−2 at 12% elongation. (b) Wire thickness t ≈ 40 µm and internal grain size d ≈ 5.1 µm (t/d ≈ 7.8), with residual dislocation density estimated at
 $\sim \!1 \times 10^{16} $
m−2 at 14% elongation. In both cases, the initial dislocation density of the undeformed samples was ~2 × 10¹⁴ m−2. Adapted with permission from Ref. Reference Chen and Ngan35, Elsevier, 2012.

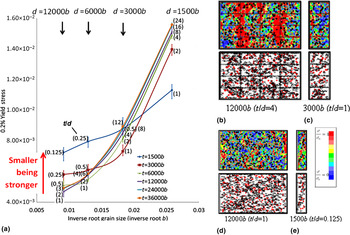
DDD simulations have been proven useful in providing conceptual understanding of the grain-boundary effects as discussed above. Figure 7(a) shows Hall–Petch plots simulated using 2D DDD for different specimen thickness t in the micrometer range, and different t/d ratios, with the initial dislocation density at ~1013 m−2, which is a realistic value.[
Reference Leung and Ngan
36
] In such 2D DDD models, grains are assumed to occupy a rectangular grid structure with periodic boundary conditions along the tensile direction (the direction perpendicular to the specimen thickness direction) as shown in the selected cases in Figs. 7(b)–7(e). In general, in Fig. 7(a), the positive deviation from the polycrystalline Hall–Petch behavior for small t/d ratios as seen in Fig. 5(a) is successfully predicted. Figure 5(a) in fact also indicates that, in the regimen when strength exhibits positive deviation from the polycrystalline Hall–Petch behavior, a “smaller being stronger” size effect occurs, namely, the smaller the specimen size t the larger is the strength. This size effect is of a similar genre as that depicted by Eq. (1), and is also predicted by the simulations in Fig. 7(a). Figures 7(b)–7(e) show selected cases of different values of t and t/d ratio. It can be seen that for
 $t/d\;\widetilde \gt\; 3$
[Fig. 7(b)], surface grains are subjected to lower stress and are therefore softer than interior ones, because of less dislocation pile-up and lower dislocation density there. Since smaller samples have relatively more surface grains, they are therefore weaker. For
 $t/d\;\widetilde \lt\; 1$
[Figs. 7(c)–7(e)], since grain boundaries are scarce, dislocation pile-up is less, which leads to a reduced Hall–Petch slope. Also, as can be seen by comparing Figs. 7(d) and 7(e), a smaller sample [Fig. 7(e)] contains fewer dislocations due to the ease of zipping out, and so it is stronger. The simulations here therefore also confirm the experimental observation in Fig. 6(a) where dislocations do not accumulate when t/d is small.
2D DDD simulations of grain-boundary induced strengthening in micrometer-sized polycrystals. (a) Simulated proof stress versus (grain size)−1/2 plots for different specimen thicknesses t and grain size d, with t/d ratios shown in brackets. (b–e) Simulated stress fields (upper panels) and dislocation plots (lower panels) for selected cases of different specimen thickness t (shown in terms of b underneath each case) and t/d ratio. Rectangular grids (if any) show simulated grain boundaries. Color bar on right of (e) shows relative scale for stress applicable to all cases in (b–e). Adapted with permission from Ref. Reference Leung and Ngan36, Elsevier, 2013.

This phenomenon of Hall–Petch deviation illustrates the intricate coupling effects of the internal length scale (the grain size) and the external specimen size in affecting strength.
Precipitate microstructures
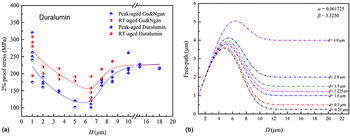
As the last microstructure to illustrate, we consider precipitates. A classical precipitated alloy is duralumin, which is essentially an Al–Cu–Mg–Mn alloy. Figure 8 shows the master microstructures of duralumin at two aged conditions, namely, naturally (room-temperature) aged and peak-aged conditions. Precipitated phases including T-phase Al20Cu2Mn3 and S-phase Al2CuMg can be seen. Figure 9(a) shows the 2% proof strength of duralumin micro-pillars under compression.[ Reference Gu and Ngan 37 , Reference Gan, Gu and Ngan 38 ] Remarkably, duralumin exhibits a non-monotonic size effect, in which strength first decreases and then increases on increasing size. The size dependence of strength of precipitated alloys is more complex than the common “smaller-being-stronger” size effect in Eq. (1).
Precipitated microstructures in duralumin at (a) naturally (room-temperature) aged and (b) peak-aged conditions. Rod-shaped T-phase Al20Cu2Mn3 precipitates are present in (a,b), while (b) also exhibits needle-shaped S-phase Al2CuMg precipitates.

(a) The 2% proof stress of duralumin micro-pillars versus pillar diameter D. (b) Model mean-free path of dislocations in a precipitated micro-specimen.

The behavior in Fig. 9(a) can be understood by considering the mean free path Λ of dislocations, which is defined as the mean distance traversed by dislocations, before they become trapped by precipitates or annihilated at the free surfaces of the specimen. In a precipitated micro-specimen of size D, if a dislocation can escape trapping by precipitates glide through the specimen thickness, then its free path will be D. If a dislocation is pinned by some precipitates, its free path will be some d, which will scale with the precipitate spacing. Let F(x) be the probability that a dislocation is not pinned by precipitates when it has glided a distance x, the mean free path of all mobile dislocations in the specimen will be
 $${\rm \Lambda} = F(D) \cdot D + [1 - F(D)] \cdot d.$$
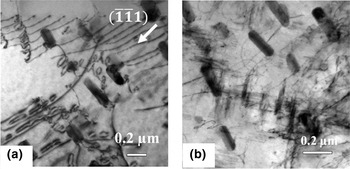
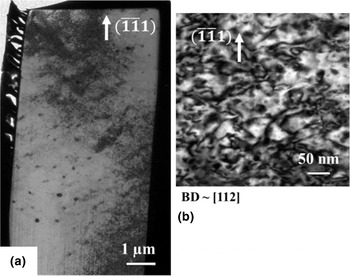
F(x) is obviously a decreasing function of x, since the longer a dislocation has traveled in a precipitate field, the smaller is the chance that it is not pinned. A simple, convenient form can be F(x) = exp( − αx β ), where α and β are empirical, positive parameters, and Fig. 9(b) shows the variation of the mean free path with specimen size D for different precipitate spacing d, for the case of α = 0.001725 and β = 3.325. It can be seen that for specimen size D smaller than the size corresponding to the smallest strength in Fig. 9(a), Λ is close to D itself, which means that most dislocations are not pinned by the precipitates and can glide through the thickness of the specimen. For D larger than the size corresponding to the smallest strength, Λ drops on increasing D toward a steady value that is simply d; in this case, dislocations are increasingly trapped by precipitates. At the size corresponding to the smallest strength, Λ exhibits a maximum, meaning that dislocations can traverse the farthest, corresponding to minimum resistance to deformation. The non-monotonic size effect of strength in Fig. 9(a) is therefore the result of two strengthening mechanisms at play. In the small-size regimen, there are not enough precipitates within the specimen thickness to effectively trap dislocations, so the latter glide through the specimen, leaving the specimen in a continuous dislocation-starved state. Strength is high due to the need to nucleate or mobilize dislocations to sustain deformation. On increasing D, more and more precipitates are present, which can now trap dislocations; the strengthening mechanism here is the conventional precipitation hardening. At the size at which strength is minimum, both strengthening mechanisms are ineffective—this size is too large for dislocation starvation to be effective, and too small to contain enough precipitates to strengthen the specimen. Figure 10 shows the microstructure of a deformed duralumin micro-pillar close to the size at which strength reaches minimum. It can be seen that across the specimen thickness, there are only a few (~ ten) large, T-phase precipitates, which should not be effective in offering high precipitation hardening. The residual dislocation density is high at ~1015 m−2, which indicates that dislocation starvation does not happen.
TEM microstructure of deformed duralumin pillar close to the size at which strength reaches minimum. (a) Longitudinal microstructure of pillar where large T-phase precipitates are seen as dark spots. (b) Close-up of a typical location in the specimen showing high density of residual dislocations. Adapted with permission from Ref. Reference Gu and Ngan37, Elsevier, 2013.

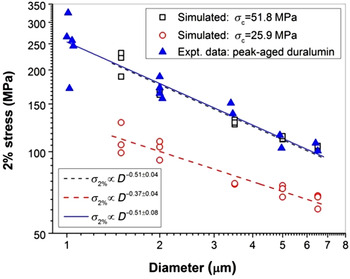
Notwithstanding the above, in the small-size regimen when strength is controlled by the dislocation starved condition, the “smaller-being-stronger” size effect is significantly milder than that in pristine Al without precipitates. When the strength versus size relation in this regimen is fitted by Eq. (1), the m value is found to be ~0.51 as shown in Fig. 11, compared with the value of ~0.98 for pristine Al without precipitates or pre-straining [Fig. 3(b)]. The m value for duralumin is in fact close to pre-strained Al containing a high density of initial dislocations [Fig. 3(b)]. In either a precipitated or dense-dislocation microstructure, the small internal microstructural length scale evidently reduces the dependence of strength on specimen size.
Smaller-being-stronger size dependence in duralumin in the regimen of small specimen size. Beyond this regimen, strength increases with size as shown in Fig. 9(a). Reproduced with permission from Ref. Reference Gu, Leung and Ngan39, Elsevier, 2014.

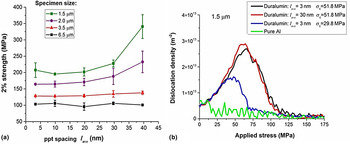
DDD simulations again can provide useful insights into the effects of precipitates on size effect of strength. Figure 12 shows 2D DDD simulation results on the precipitate effects on strength and dislocation storage.[ Reference Gu, Leung and Ngan 39 ] Here, the 2D simulation region is rectangular with an aspect ratio of 1:3, with periodic boundary conditions applied along the long axis, which is also the tensile axis, and free surfaces are assumed along the short axis. Dislocation velocity is assumed to be proportional to the effective stress comprising the applied stress, elastic interaction between dislocations and resistance due to Taylor hardening. Dislocation nucleation is modeled by dipole sources, which operate at critical stresses σ nuc that follow a Gaussian distribution of mean 15 MPa and standard deviation 6 MPa. Dislocation annihilation is modeled by deleting dipoles less than 1b wide from the system. Precipitates are positioned according to a Gaussian distribution with average spacing l ave and standard deviation 0.3l ave. Dislocation–precipitate interactions in reality are 3D events and in the 2D simulation here, they are modeled as three possible scenarios as a dislocation meets a precipitate: (1) If the glide stress is larger than a critical stress σ c, then the dislocation overcomes the precipitate and moves at a slower speed with the effective stress reduced by σ c. (2) Else, if the stress normal to the slip plane is larger than a critical stress set to be 3σ c, then the dislocation has 10% chance to cross slip over the particle. (3) Else, the dislocation is pinned by the precipitate.
2D DDD simulation results of precipitate effects on (a) strength and (b) dislocation storage. Reproduced with permission from Ref. Reference Gu, Leung and Ngan39, Elsevier, 2014.

Figure 12(a) shows that for specimen sizes ranging from 1.5 to 6.5 µm, a “smaller-being-stronger” size effect is predicted, which is more prominent for larger precipitate spacing l ave. Two sets of simulated size effect are shown in Fig. 11, and it can be seen that one of these matches the experimental results for duralumin well. Figure 12(b) shows that, when compared with the pure Al case without precipitates, dislocation accumulation is enhanced by the presence of precipitates, even in the regimen where strength is governed by the dislocation starvation mechanism.
Perspectives and conclusion
The above examples all show that, when dense microstructures exist in micro-specimens, the simple “smaller-being-stronger” picture as represented by the power law in Eq. (1) is far from complete. The microstructures may correspond to an internal length scale that may dominate over, or at least couple with, the external specimen-size length scale to control strength and deformation. In such cases, conventional wisdom often becomes invalid. For example, in the case of polycrystalline, micro-samples of a given specimen thickness t in the micro scale, the Hall–Petch relation may break down in the regimen
 $t/d\; \widetilde \lt \; 3$
, when loss of dislocations to free surfaces becomes significant leading to low dislocation accumulation. Precipitation hardening is another example—in the alloy example in the section “Precipitate microstructures”, when the specimen size is not large compared with the spacing of precipitates, the latter may no longer be effective in blocking dislocations, leading to a much lower strength than the bulk value. Even in the simpler example of the specimen just containing an initial amount of dislocations, the exponent m in Eq. (1) may be affected by the initial dislocation network according to Eq. (4). Other microstructures will most likely produce other unusual effects but the literature is critically short of such information and knowledge.
Modeling of size effects when microstructures dominate is another interesting area requiring challenging developments. The DDD simulations shown in Figs. 7, 10, and 11 are sometimes referred to as “2.5D” simulations, which are really 2D simulations for infinitely straight dislocations with certain 3D events, such as interactions with precipitates, dislocation generation and cross slip, modeled in ad hoc manners in 2D. Currently, 3D DDD simulations are often used as a convenient tool to model micro-pillar plasticity, since the slow accumulation of dislocations due to the constant loss at free surfaces, especially for very small crystals with low initial dislocation contents,[ Reference El-Awady 30 , Reference Zhou, Beyerlein and LeSar 40 ] is ideal for 3D DDD, which cannot handle large quantities of dislocation segments. The incorporation of microstructures will meet two key challenges for the 3D DDD method: (i) the need to model dislocation–microstructure interactions in the simulation, and (ii) enhanced dislocation accumulation, which means more efficient simulation codes will need to be developed.
Acknowledgment
Financial support by the Kingboard Professorship Endowment is gratefully acknowledged.