Introduction
Trichinellosis is a worldwide zoonotic disease resulting from eating pork and meat products contaminated with T. spiralis larvae (Borhani et al. Reference Borhani, Fathi, Harandi, Simsek, Ahmed, Wu and Liu2023). Once ingested, the parasite migrates from the intestine to skeletal muscles, where it encysts, causing a wide range of clinical symptoms that include fever, myalgia, and inflammation (Arshad et al. Reference Arshad, Maqsood, Yaqoob, Iqbal, Rayshan, Mohsin, Qamar, Abbas, Hassan, Khan and Mohsin2023). Beyond its clinical manifestations, T. spiralis infection induces oxidative stress and triggers a significant inflammatory response, leading to tissue damage and metabolic dysfunction (Mohamed et al. Reference Mohamed, Hegab, Amer, Zalat, Shoeib and Abdel-ShafiI2025).
Benzimidazole derivatives, particularly ABZ, are regarded as the main antiparasitic medication used to treat trichinellosis, as they attach to cuticular tubulin and damage adult intestinal parasites. However, it is less effective against larvae that are encapsulated in the skeletal muscles (Hamed et al. 2022). The low-level bioavailability of anti-helminthic medications, first-pass metabolism, and the need for addition anti-inflammatory medications with their several side effects symbolize barriers in the treatment of trichinellosis (Bruschi and Dupouy-Camet Reference Bruschi, Dupuoy-Camet and Bruschi2022).
Therefore, there is growing interest in natural bioactive substances with free radical scavenging and anti-inflammatory capabilities as adjunct therapeutic agents (Salas et al. Reference Salas, Menchaca Castro, Aráujo, Niño Herrera, Iliná, Valdés and Aguilar González2023). RSV is a polyphenolic stilbene appearing in the peels of red fruits such as grapes, nuts, and berries (Szkudelska and Szkudelski Reference Szkudelska and Szkudelski2010). RSV is a powerful antioxidant. It reduces the production of reactive oxygen species (ROS) within cells through several mechanisms that offer an antioxidant defense (Robb et al. Reference Robb, Page, Wiens and Stuart2008). Moreover, it has antiparasitic and antimicrobial properties (Elgendy et al. Reference Elgendy, Othman, Hasby Saad, Soliman and Mwafy2020; Soliman et al. Reference Soliman, Ismail, Badr and Nasr2017). It also modulates various cellular pathways, including SIRT1 activation, to protect against oxidative stress and inflammation (Salas et al. Reference Salas, Menchaca Castro, Aráujo, Niño Herrera, Iliná, Valdés and Aguilar González2023).
On the other hand, SFN, an isothiocyanate compound naturally present in cruciferous plants, including broccoli, is considered a potent activator of the nuclear factor erythroid 2-related factor 2 (Nrf2) pathway, leading to enhanced cellular antioxidant defense and detoxification mechanisms (Habtemariam Reference Habtemariam2024). While both compounds have revealed protective effects in different models of inflammation and oxidative damage, their comparative efficacy against T. spiralis infection, evaluated independently rather than in combination with standard therapy, remains underexplored. Understanding their differential effects could provide new insights into host-parasite interactions and offer more effective therapeutic strategies.
Material and methods
Experimental animals and parasite
50 male Swiss albino mice, each weighing between 20 and 25 grams and at the age of 5 weeks, were sourced from the animal house of Theodor Bilharz Research Institute in Giza, Egypt. They were kept in compliance with the National Institutes of Health Guidelines for Animal Research. They were housed in plastic cages with white wood chips for bedding, fed with a commercial complete food mixture and tap water for drinking, and maintained under controlled conditions of lighting (12 h light/12 h dark cycle) and temperature (25 ± 2 oC). Additionally, the T. spiralis strain was supplied by Theodor Bilharz Research Institute.
Drugs
Albendazole (Alzental) suspension (EIPICO) containing 20 mg/mL was administered at a dose of 50 mg/Kg (Attia et al. Reference Attia, Mahmoud, Farrag, Makboul, Mohamed and Ibraheim2015). RSV powder and SFN were purchased from Sigma-Aldrich Chemical Co., St. Louis, MO, USA. Resveratrol powder was dissolved in distilled water to make a suspension at a dose of 20 mg/kg (Soliman et al. Reference Soliman, Ismail, Badr and Nasr2017). An aqueous suspension of SFN in distilled water was administered at a dosage of 100 mg/kg (Zahran et al. Reference Zahran, Moustafa, Fouda, Salem and Omran2023). All drugs were administered orally with a tuberculin syringe on day 28 Post-infection once daily till time of scarification.
Infection of animals
Infective larvae were obtained from contaminated pork tissue by mixing the muscles in digestive fluid for 12 h (20% concentrated HCl and 20% pepsin). The mixture was centrifuged (at 1000 rpm for 2 min), then washed (0.9% NaCl) repeatedly to obtain the larvae (Guenther et al. Reference Guenther, Nöckler, von Nickisch-Rosenegk, Landgraf, Ewers, Wieler and Schierack2008). The infective larvae were mixed with 1.5% gelatin saline to become stable and ready for infection. Mice were prevented from food 12 h before infection. After that, they were given infective larvae through the oral route using a tuberculin syringe with a blunt nozzle.
Experimental design
Animals were divided into five main groups (10 mice in each group) as follows: group (I): Control negative (non-infected, non-treated), group (II): Control positive (infected, non-treated), group (III): Infected mice treated with ABZ, group (IV): Infected mice treated with RSV, and group (V): Infected mice treated with SFN.
The groups from II to V were infected orally with 200 larvae per mouse, according to the method defined by Dunn and Wright (Reference Dunn and Wright1985). Then the infected mice received treatment on the 28th day post-infection (dpi) for two weeks, and all mice were sacrificed on the 42nd day of the study. Finally, pieces from skeletal muscles were utilized for parasitological and histopathological evaluation. Additionally, sera were collected for biochemical and serological analysis.
Parasitological studies
Total larval count
On the 42nd dpi, mice were euthanized. All carcasses’ muscle larval count was calculated using the method outlined by Martínez-Gómez et al. (Reference Martínez-Gómez, Santiago-Rosales and Bautista-Garfias2009). Briefly, after being dissected, each mouse was digested in 200 millilitres of distilled water containing 1% pepsin hydrochloride. After incubating the mix for an hour at 37 °C with constant stirring using an electric stirrer, we collected the encysted larvae using the sedimentation method and repeatedly cleaned them with distilled water. A McMaster counting chamber was used to count the larvae under a microscope.
Biochemical assessment
Serum biochemical analysis. Blood samples were collected in Eppendorf tubes from the corner of the rats’ eyes (Hoff Reference Hoff2000). After clotting, they were centrifuged at 1500 rpm for 15 min at 4 °C; after getting serum, it was stored at −20 °C until used.
Colorimetric measurement of oxidative stress markers
Levels of Malondialdehyde (MDA) (MD2529, Biodiagnostics, Egypt) and reduced glutathione (GSH) levels (GR2511, Biodiagnostics, Egypt) were determined using colorimetric methods, in accordance with the manufacturer’s guidelines. The Malondialdehyde assay is based on the reaction of MDA with thiobarbituric acid under acidic conditions to form a pink chromogen measured at 534 nm (Ohkawa et al. Reference Ohkawa, Ohishi and Yagi1979). The reduced glutathione assay relies on the reduction of Ellman’s reagent (5,5′-dithiobis-2-nitrobenzoic acid) by the free sulfhydryl group of GSH, producing a yellow-coloured product measured at 405 nm (Beutler et al. Reference Beutler, Duron and Kelly1963).
Enzyme-linked immunosorbent assays (ELISAs)
Serum concentrations of tumour necrosis factor-alpha (TNF-α) (ab236712, Abcam, USA), interleukin-6 (IL-6) (ab234570, Abcam, USA), and Nrf2 (MBS752046, MyBioSource, USA) were determined using rat-specific ELISA kits according to the manufacturers’ protocols. The concentrations of the measured biomarkers were calculated based on the standard curve, and optical density (OD) was recorded at a wavelength of 450 nm.
The mRNA expression level of SIRT1 and SLC7A11 in muscle tissue
Total RNA was extracted from muscle tissue homogenates using the Total RNA Mini Kit (Geneaid; catalogue numbers RTD050, RTD100, and RTD300) following the manufacturer’s instructions. RNA purity was evaluated using a NanoDrop®️ ND-1000 spectrophotometer. Subsequently, cDNA was synthesized via reverse transcription at 75 °C for 5 min, 60 °C for 60 min, and 90 °C for 5 min using the Maxime RT Premix Kit (iNtRON Biotechnology, kit catalogue no.: 25081).
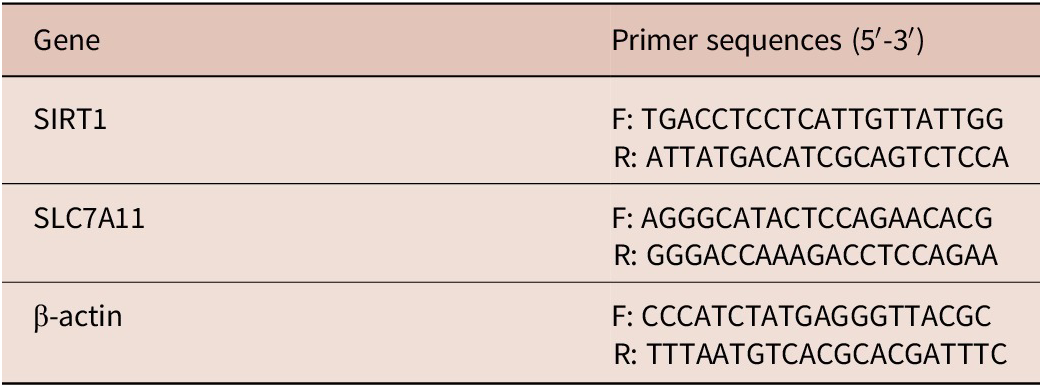
A real-time cycler was used to carry out quantitative real-time PCR (DTlite 4 DNA-TECHNOLOGY). PCR reactions were prepared in a total volume of 20 μL containing 7 μL deionized water, 1 μL template DNA, 1 μL of each primer (1 μM), and 10 μL of 2× PCR Master Mix (Qiagen, Germany). The primer sequences of SIRT1 and SLC7A11 genes are provided in Table 1. The housekeeping gene, β-actin, and the levels of the untreated control group were used to standardise the target genes’ relative expression levels. Finally, the results were expressed as fold change, which was calculated using the 2^-ΔΔCt method.
Primers used for real-time PCR analysis of SIRT1 and SLC7A11 genes (Wang et al. Reference Wang, Shao, Zhang, Chen, Chang, Xie and Zhang2023)

Table 1. Long description
The table consists of two columns: Gene and Primer sequences (5 prime to 3 prime).
* Row 1: Gene S I R T 1. Forward primer F: T G A C C T C C T C A T T G T T A T T G G. Reverse primer R: A T T A T G A C A T C G C A G T C T C C A.
* Row 2: Gene S L C 7 A 1 1. Forward primer F: A G G G C A T A C T C C A G A A C A C G. Reverse primer R: G G G A C C A A A G A C C T C C A G A A.
* Row 3: Gene beta-actin. Forward primer F: C C C A T C T A T G A G G G T T A C G C. Reverse primer R: T T T A A T G T C A C G C A C G A T T T C.
Footnote: S I R T 1 stands for Silent information regulator 2 homolog 1 or sirtuin 1. S L C 7 A 1 1 stands for Solute carrier family 7 member 11.
SIRT1: Silent information regulator 2 homolog 1 (or sirtuin 1); SLC7A11: Solute carrier family 7 member 11.
Histopathological study
Muscle specimens were collected from all studied groups for studying general histopathological features using H&E stain (Drury and Wallington Reference Drury and Wallington1980).
Histopathological evaluation
In skeletal muscle samples, the extent of the inflammatory reaction surrounding the capsule was evaluated as mild reaction = +1 (1% to 30% increase in inflammatory cellular infiltration), moderate reaction = +2 (31% to 60% increase in inflammatory cellular infiltration), and intense reaction = +3 (61% to 100% increase in inflammatory cellular infiltration) compared to the control group (Shalaby et al. Reference Shalaby, ALbakkosh, Shalaby, ALabiad, ELshamy, ALorini, Jaber and Tawfeek2023).
Statistical analysis
SPSS version 29 (IBM, Armonk, NY, USA) was used for statistical analysis. Quantitative data were represented as mean ± SD. One-way ANOVA (F test) was used for comparison among three or more groups, and pairwise comparison between groups was performed using the Least Significant Difference (LSD) method. A p-value < 0.05 was considered statistically significant, and p < 0.001 was considered highly significant.
Results
Parasitological result
The mean muscle larval count was significantly reduced in ABZ-, RSV-, and SFN-treated groups compared to the infected control (1690c ± 157, 1290 ± 145, and 2260 ± 46, respectively) (Table 2).
Mean larval count

Table 2. Long description
The table is organized into columns for Group, Mean, plus or minus, S D, Range (two columns), Reduction percentage, and Statistical analysis (two columns).
* Group G I I: Mean 8933 plus or minus 451. Range 8500 to 9400. Statistical analysis F = 624.303 and p < 0.001.
* Group G I I I: Mean 1690 plus or minus 157. Range 1520 to 1830. Reduction 81 percent. Statistical analysis P 1 < 0.001 and P 2 < 0.001.
* Group G I V: Mean 1290 plus or minus 145. Range 1150 to 1440. Reduction 86 percent. Statistical analysis P 3 < 0.001 and P 4 = 0.086 N S.
* Group G V: Mean 2260 plus or minus 46. Range 2220 to 2310. Reduction 75 percent. Statistical analysis P 5 = 0.024 and P 6 = 0.001.
Footnotes define P 1 through P 6 as comparisons between specific groups. F represents A N O V A test. N S indicates not significant (p >= 0.05). Single asterisk indicates p < 0.05 and double asterisk indicates p < 0.01.
P1 = GII vs. GIII; P2 = GII vs. GIV; P3 = GII vs. GV; P4 = GIII vs. GIV; P5 = GIII vs. GV; P6 = GIV vs. GV. F: ANOVA test, P: Probability, NS = not significant (p ≥ 0.05); * p < 0.05; ** p < 0.01, R%: Reduction percentage.
Biochemical results
Oxidant/anti-oxidant markers
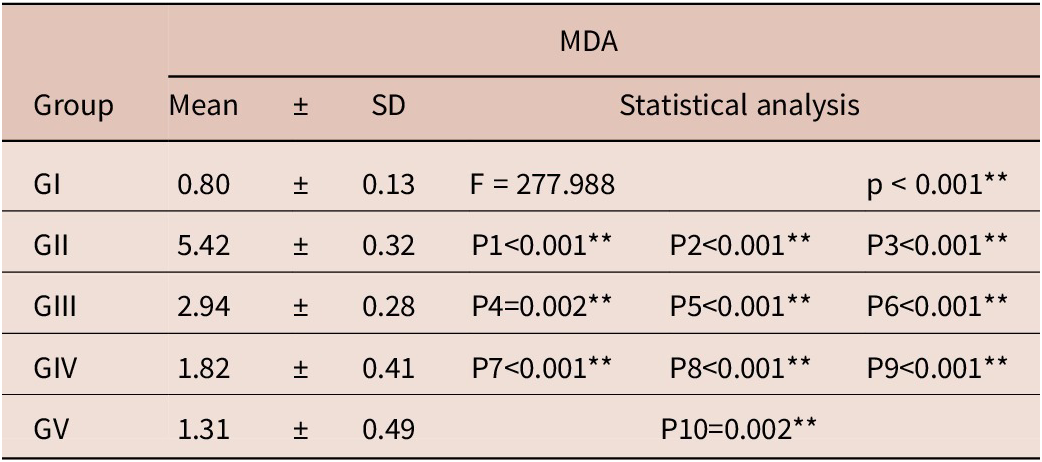
MDA. Malondialdehyde levels showed a significant increase in the infected non-treated group (GII: 5.42 ± 0.32) relative to the negative control (GI: 0.80 ± 0.13). ABZ therapy reduced MDA to 2.94 ± 0.28, while RSV and SFN demonstrated greater reductions (1.82 ± 0.41 and 1.31 ± 0.49, respectively) (p < 0.001) (Table 3).
MDA among the studied groups

Table 3. Long description
The table is structured with seven columns. The first column lists the Group, followed by M D A data including Mean, plus or minus symbol, S D (Standard Deviation), and three columns for Statistical analysis.
* Group G I: Mean 0.80 plus or minus 0.13. Statistical analysis shows F equals 277.988 and p is less than 0.001.
* Group G I I: Mean 5.42 plus or minus 0.32. Statistical analysis shows P 1 is less than 0.001, P 2 is less than 0.001, and P 3 is less than 0.001.
* Group G I I I: Mean 2.94 plus or minus 0.28. Statistical analysis shows P 4 equals 0.002, P 5 is less than 0.001, and P 6 is less than 0.001.
* Group G I V: Mean 1.82 plus or minus 0.41. Statistical analysis shows P 7 is less than 0.001, P 8 is less than 0.001, and P 9 is less than 0.001.
* Group G V: Mean 1.31 plus or minus 0.49. Statistical analysis shows P 10 equals 0.002.
All p-values are marked with double asterisks indicating highly significant differences. The footer defines F as A N O V A test, P as Probability, and provides a key for comparison pairs P 1 through P 10 between the different groups.
F: ANOVA test, P: Probability, **: Highly significant difference. NS = not significant (p ≥ 0.05); * p < 0.05; ** p < 0.01. P1 = GI vs. GII; P2 = GI vs. GIII; P3 = GI vs. GIV; P4 = GI vs. GV; P5 = GII vs. GIII; P6 = GII vs. GIV; P7 = GII vs. GV; P8 = GIII vs. GIV; P9 = GIII vs. GV; P10 = GIV vs. GV.
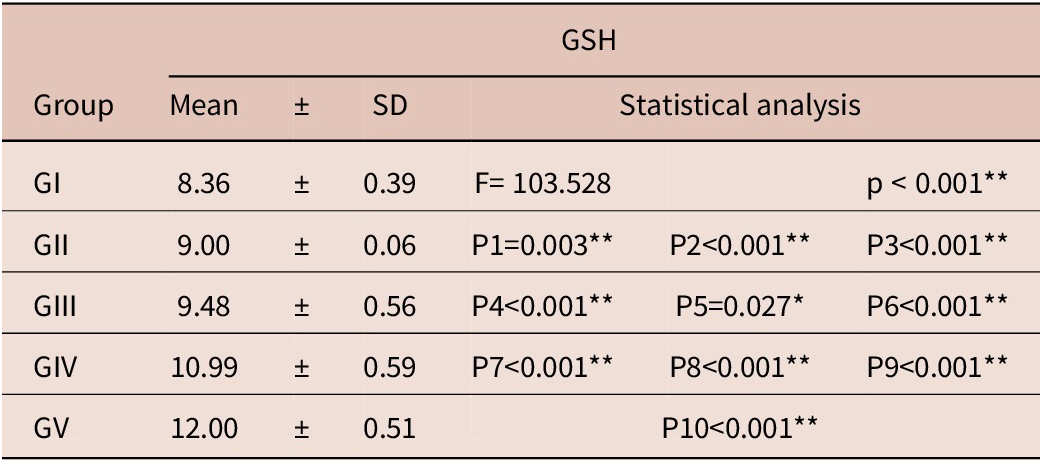
GSH. GSH levels showed a significant increase among the treated groups compared to those that did not receive treatment (p < 0.001). SFN produced the highest elevation (12.00 ± 0.51), followed by RSV (10.99 ± 0.59) and ABZ (9.48 ± 0.56) (Table 4).
GSH among the studied group

Table 4. Long description
The table consists of seven columns: Group, Mean, plus or minus symbol, S D, and three columns for Statistical analysis.
* Group G I: Mean 8.36 plus or minus 0.39. Statistical analysis shows F equals 103.528 and p is less than 0.001.
* Group G I I: Mean 9.00 plus or minus 0.06. Statistical analysis shows P 1 equals 0.003, P 2 is less than 0.001, and P 3 is less than 0.001.
* Group G I I I: Mean 9.48 plus or minus 0.56. Statistical analysis shows P 4 is less than 0.001, P 5 equals 0.027, and P 6 is less than 0.001.
* Group G I V: Mean 10.99 plus or minus 0.59. Statistical analysis shows P 7 is less than 0.001, P 8 is less than 0.001, and P 9 is less than 0.001.
* Group G V: Mean 12.00 plus or minus 0.51. Statistical analysis shows P 10 is less than 0.001.
Footnotes define F as A N O V A test, P as Probability, and asterisks for significance levels: one asterisk for p less than 0.05 and two asterisks for p less than 0.01. Comparison keys are provided for P 1 through P 10 representing pairwise comparisons between groups G I through G V.
F: ANOVA test, P: Probability, **: Highly significant difference. NS = not significant (p ≥ 0.05); * p < 0.05; ** p < 0.01. P1 = GI vs. GII; P2 = GI vs. GIII; P3 = GI vs. GIV; P4 = GI vs. GV; P5 = GII vs. GIII; P6 = GII vs. GIV; P7 = GII vs. GV; P8 = GIII vs. GIV; P9 = GIII vs. GV; P10 = GIV vs. GV.
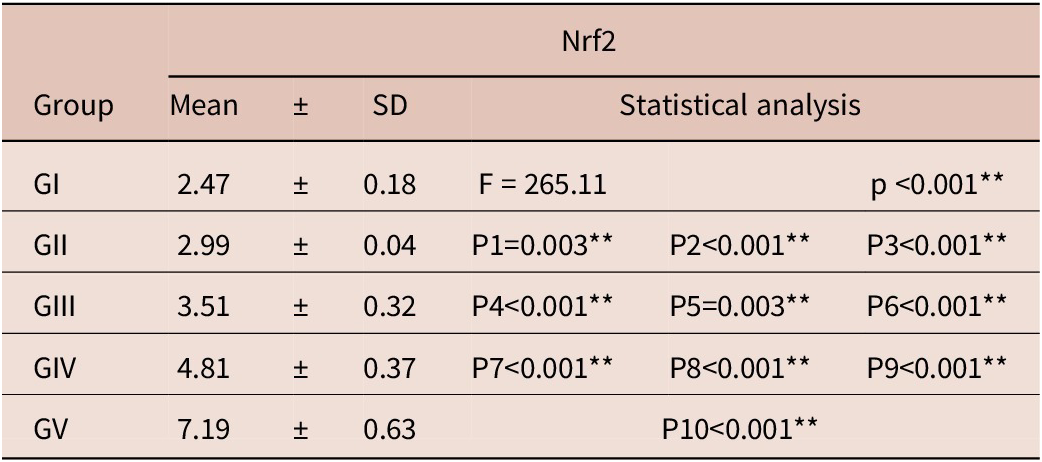
Nrf2. Nrf2 levels showed a significant increase in the treated groups compared to non-treated groups (p < 0.001). The SFN group (GV) exhibited the greatest elevation (7.19 ± 0.63) compared with the infected non-treated group (2.99 ± 0.04) (Table 5).
Nrf2 among the studied groups

Table 5. Long description
The table presents N r f 2 measurements for five groups. The columns are Group, Mean, plus or minus, S D (Standard Deviation), and Statistical analysis.
* Group G I: Mean 2.47 plus or minus 0.18. Statistical analysis shows F equals 265.11 and p is less than 0.001.
* Group G I I: Mean 2.99 plus or minus 0.04. Statistical comparisons: P 1 equals 0.003, P 2 is less than 0.001, P 3 is less than 0.001.
* Group G I I I: Mean 3.51 plus or minus 0.32. Statistical comparisons: P 4 is less than 0.001, P 5 equals 0.003, P 6 is less than 0.001.
* Group G I V: Mean 4.81 plus or minus 0.37. Statistical comparisons: P 7 is less than 0.001, P 8 is less than 0.001, P 9 is less than 0.001.
* Group G V: Mean 7.19 plus or minus 0.63. Statistical comparison: P 10 is less than 0.001.
Footnote definitions: F refers to A N O V A test. P refers to Probability. Double asterisks indicate a highly significant difference (p is less than 0.01). Comparison keys: P 1 (G I vs G I I), P 2 (G I vs G I I I), P 3 (G I vs G I V), P 4 (G I vs G V), P 5 (G I I vs G I I I), P 6 (G I I vs G I V), P 7 (G I I vs G V), P 8 (G I I I vs G I V), P 9 (G I I I vs G V), and P 10 (G I V vs G V).
F: ANOVA test, P: Probability, **: Highly significant difference. NS = not significant (p ≥ 0.05); * p < 0.05; ** p < 0.01. P1 = GI vs. GII; P2 = GI vs. GIII; P3 = GI vs. GIV; P4 = GI vs. GV; P5 = GII vs. GIII; P6 = GII vs. GIV; P7 = GII vs. GV; P8 = GIII vs. GIV; P9 = GIII vs. GV; P10 = GIV vs. GV.
(SIRT1- SLC7A11) gene expression
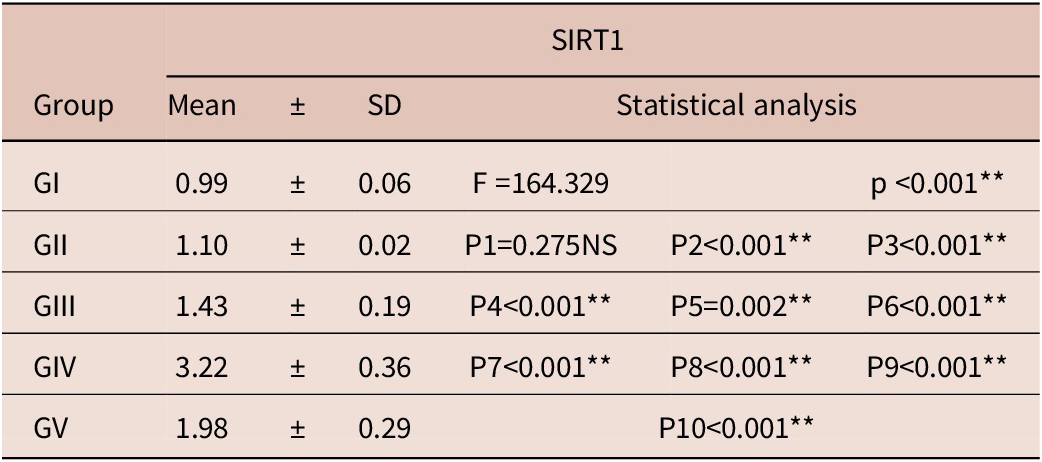
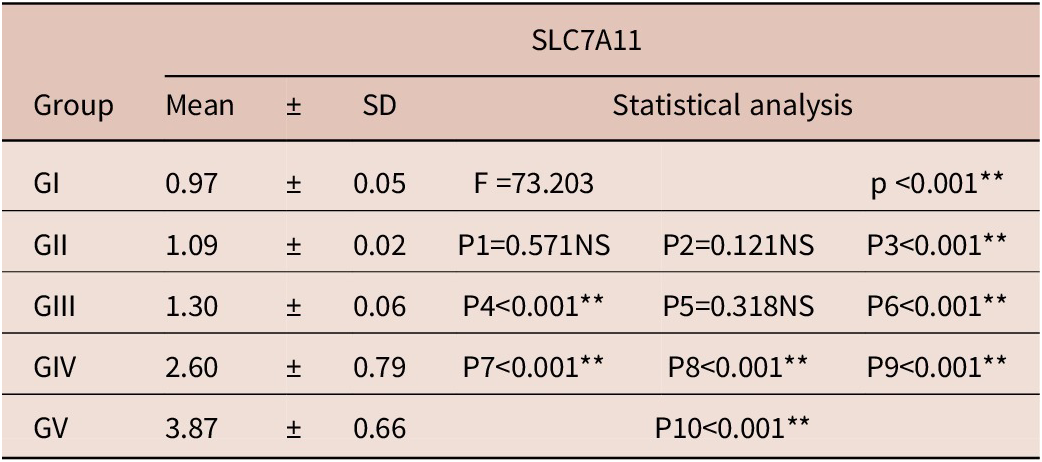
SIRT1 and SLC7A11 expression levels showed a significant increase within the treated groups versus the control groups (P < 0.001). With regard to SIRT1, RSV resulted in the highest induction (3.22 ± 0.36), while SFN and ABZ induced moderate increases (1.98 ± 0.29 and 1.43 ± 0.19, respectively) (Table 6). With regard to SLC7A11, SFN showed the most pronounced elevation (3.87 ± 0.66) (Table 7).
SIRT1among the studied groups

Table 6. Long description
The table is organized into seven columns. The first column lists the Group, followed by S I R T 1 data including Mean, plus or minus, S D, and three columns for Statistical analysis.
* Group G I: Mean 0.99 plus or minus 0.06. Statistical analysis shows F equals 164.329 and p is less than 0.001.
* Group G I I: Mean 1.10 plus or minus 0.02. Statistical analysis shows P 1 equals 0.275 N S, P 2 is less than 0.001, and P 3 is less than 0.001.
* Group G I I I: Mean 1.43 plus or minus 0.19. Statistical analysis shows P 4 is less than 0.001, P 5 equals 0.002, and P 6 is less than 0.001.
* Group G I V: Mean 3.22 plus or minus 0.36. Statistical analysis shows P 7 is less than 0.001, P 8 is less than 0.001, and P 9 is less than 0.001.
* Group G V: Mean 1.98 plus or minus 0.29. Statistical analysis shows P 10 is less than 0.001.
Footnotes define F as A N O V A test, P as Probability, and double asterisks as highly significant differences. P-values 1 through 10 represent specific group comparisons: P 1 is G I vs G I I; P 2 is G I vs G I I I; P 3 is G I vs G I V; P 4 is G I vs G V; P 5 is G I I vs G I I I; P 6 is G I I vs G I V; P 7 is G I I vs G V; P 8 is G I I I vs G I V; P 9 is G I I I vs G V; P 10 is G I V vs G V.
F: ANOVA test, P: Probability, **: Highly significant difference. NS = not significant (p ≥ 0.05); * p < 0.05; ** p < 0.01. P1 = GI vs. GII; P2 = GI vs. GIII; P3 = GI vs. GIV; P4 = GI vs. GV; P5 = GII vs. GIII; P6 = GII vs. GIV; P7 = GII vs. GV; P8 = GIII vs. GIV; P9 = GIII vs. GV; P10 = GIV vs. GV.
SLC7A11 among s the studied groups

Table 7. Long description
The table presents S L C 7 A 11 data for five groups (G I, G I I, G I I I, G I V, and G V).
Columns include Group, Mean, plus or minus, S D (Standard Deviation), and Statistical analysis (F value and P values).
* G I: Mean 0.97 plus or minus 0.05. Statistical analysis shows F = 73.203 and p < 0.001 (highly significant).
* G I I: Mean 1.09 plus or minus 0.02. P 1 = 0.571 N S, P 2 = 0.121 N S, P 3 < 0.001 (highly significant).
* G I I I: Mean 1.30 plus or minus 0.06. P 4 < 0.001 (highly significant), P 5 = 0.318 N S, P 6 < 0.001 (highly significant).
* G I V: Mean 2.60 plus or minus 0.79. P 7 < 0.001, P 8 < 0.001, P 9 < 0.001 (all highly significant).
* G V: Mean 3.87 plus or minus 0.66. P 10 < 0.001 (highly significant).
Footnote definitions: F refers to A N O V A test. P refers to Probability. N S indicates not significant (p >= 0.05). Double asterisks indicate highly significant differences (p < 0.01). P values 1 through 10 represent specific pairwise comparisons between the five groups.
F: ANOVA test, P: Probability, **: Highly significant difference. NS = not significant (p ≥ 0.05); * p < 0.05; ** p < 0.01. P1 = GI vs. GII; P2 = GI vs. GIII; P3 = GI vs. GIV; P4 = GI vs. GV; P5 = GII vs. GIII; P6 = GII vs. GIV; P7 = GII vs. GV; P8 = GIII vs. GIV; P9 = GIII vs. GV; P10 = GIV vs. GV.
Inflammatory cytokines
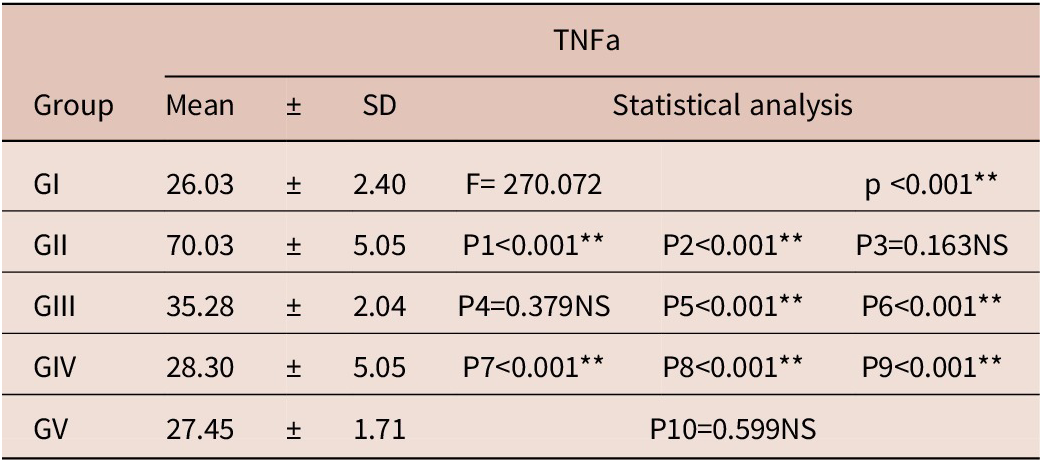
TNF-α.TNF-α exhibited a marked elevation in the infected untreated mice (GII: 70.03 ± 5.05). All treatments significantly reduced TNF-α levels, with RSV and SFN achieving the greatest attenuation (Table 8).
TNF-α among the studied groups

Table 8. Long description
The table presents T N F alpha measurements for five groups.
- Group G I: Mean 26.03 plus or minus S D 2.40. Statistical analysis shows F equals 270.072 and p is less than 0.001 (highly significant).
- Group G I I: Mean 70.03 plus or minus S D 5.05. Statistical comparisons: P 1 is less than 0.001 (highly significant), P 2 is less than 0.001 (highly significant), and P 3 equals 0.163 (not significant).
- Group G I I I: Mean 35.28 plus or minus S D 2.04. Statistical comparisons: P 4 equals 0.379 (not significant), P 5 is less than 0.001 (highly significant), and P 6 is less than 0.001 (highly significant).
- Group G I V: Mean 28.30 plus or minus S D 5.05. Statistical comparisons: P 7 is less than 0.001 (highly significant), P 8 is less than 0.001 (highly significant), and P 9 is less than 0.001 (highly significant).
- Group G V: Mean 27.45 plus or minus S D 1.71. Statistical comparison: P 10 equals 0.599 (not significant).
Statistical keys: P 1 is G I versus G I I; P 2 is G I versus G I I I; P 3 is G I versus G I V; P 4 is G I versus G V; P 5 is G I I versus G I I I; P 6 is G I I versus G I V; P 7 is G I I versus G V; P 8 is G I I I versus G I V; P 9 is G I I I versus G V; P 10 is G I V versus G V.
F: ANOVA test, P: Probability, **: Highly significant difference. NS = not significant (p ≥ 0.05); * p < 0.05; ** p < 0.01. P1 = GI vs. GII; P2 = GI vs. GIII; P3 = GI vs. GIV; P4 = GI vs. GV; P5 = GII vs. GIII; P6 = GII vs. GIV; P7 = GII vs. GV; P8 = GIII vs. GIV; P9 = GIII vs. GV; P10 = GIV vs. GV.
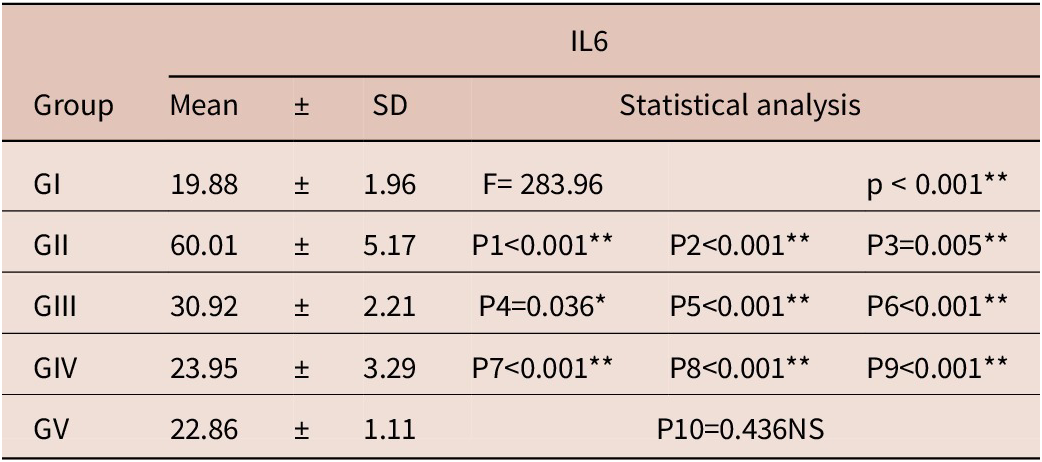
IL-6. Similarly, IL-6 was dramatically elevated in GII (60.01 ± 5.17) and was significantly reduced across all treated groups (p < 0.001) (Table 9).
IL-6 among the studied groups

Table 9. Long description
The table presents I L-6 data for five groups.
* Group G I: Mean 19.88 plus or minus S D 1.96. Statistical analysis shows F equals 283.96 and p is less than 0.001.
* Group G I I: Mean 60.01 plus or minus S D 5.17. Statistical comparisons show P 1 is less than 0.001, P 2 is less than 0.001, and P 3 equals 0.005.
* Group G I I I: Mean 30.92 plus or minus S D 2.21. Statistical comparisons show P 4 equals 0.036, P 5 is less than 0.001, and P 6 is less than 0.001.
* Group G I V: Mean 23.95 plus or minus S D 3.29. Statistical comparisons show P 7 is less than 0.001, P 8 is less than 0.001, and P 9 is less than 0.001.
* Group G V: Mean 22.86 plus or minus S D 1.11. Statistical comparison P 10 equals 0.436 N S.
Footnote definitions: F refers to A N O V A test. P refers to Probability. P 1 through P 10 represent specific group-to-group comparisons. Significance levels are marked as N S for not significant (p greater than or equal to 0.05), asterisk for p less than 0.05, and double asterisk for p less than 0.01.
F: ANOVA test, P: Probability, **: Highly significant difference. NS = not significant (p ≥ 0.05); * p < 0.05; ** p < 0.01. P1 = GI vs. GII; P2 = GI vs. GIII; P3 = GI vs. GIV; P4 = GI vs. GV; P5 = GII vs. GIII; P6 = GII vs. GIV; P7 = GII vs. GV; P8 = GIII vs. GIV; P9 = GIII vs. GV; P10 = GIV vs. GV.
Histopathological results
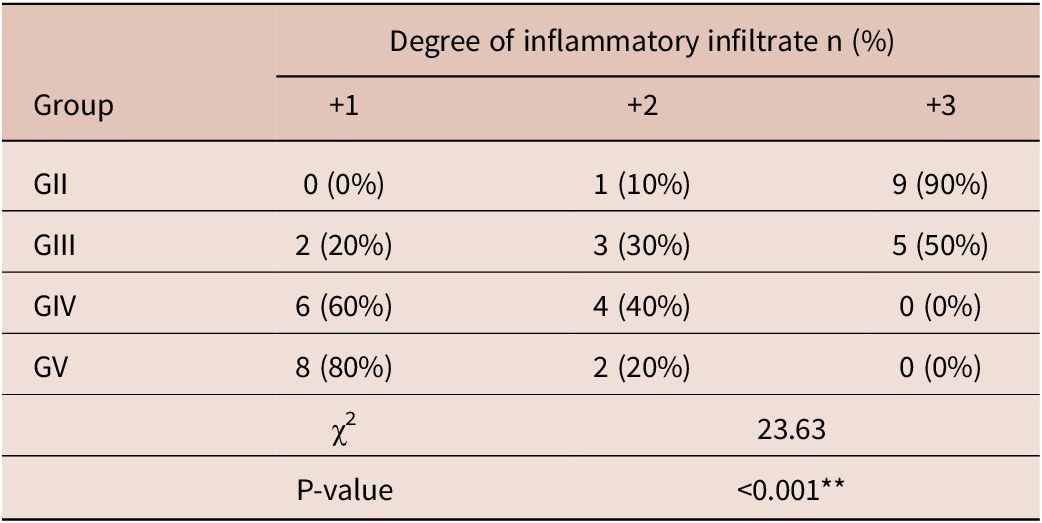
Regarding the pathological changes in the skeletal muscle, the infected control group displayed numerous larvae of T. spiralis which encysted in the skeletal muscle fibres, surrounded by an intense inflammatory reaction and diffuse degeneration of muscle fibres. On the other hand, the treated groups with either ABZ, RSV, or SFN exhibited a significant reduction in the number of infested larvae and the inflammatory infiltration, with greater improvement within the SFN-treated group as shown in Figure 1. The extent of inflammatory cellular infiltrate is shown in Table 10.
Skeletal muscle sections of the studied mouse groups (Haematoxylin and eosin stain, X 100): (a) GI showing normal muscle histology with no evidence of degeneration or inflammation. (b) GII showing numerous encysted larvae in the muscle (black arrows) surrounded by dense inflammatory cell infiltration (red arrows) with diffuse muscle degeneration. (c) GIII showing an encapsulated larva (black arrows) encircled by a very thin capsule with mild inflammatory cell infiltration (red arrow); (d) GIV showing a markedly degenerated muscle larva (black arrow) replaced by eosinophilic infiltrate. (e) GV showing a markedly degenerated muscle larva (black arrow) with complete inflammatory cell infiltration of the capsule and restoration of normal muscle fibres.

Figure 1. Long description
A collection of five light micrographs labeled a through e, each with a 200 micrometer scale bar.
* Panel a (G I): Shows longitudinal sections of healthy skeletal muscle fibers with uniform pink staining and no signs of cellular infiltration.
* Panel b (G II): Displays severe pathology. Three black arrows point to coiled, encysted larvae embedded in the tissue. A red arrow points to a large, dense cluster of dark purple inflammatory cells surrounding the cysts, amidst fragmented muscle fibers.
* Panel c (G III): Shows a single encysted larva (black arrow) enclosed in a thin, distinct capsule. A red arrow points to a small, localized area of inflammatory cell infiltration adjacent to the capsule.
* Panel d (G IV): Features a black arrow pointing to a dark purple, eosinophilic mass representing a degenerated larva that has been largely replaced by infiltrating immune cells.
* Panel e (G V): Shows a black arrow pointing to a site of a former larva, now appearing as a localized inflammatory cluster within muscle tissue that has otherwise regained its organized, parallel fiber structure.
Degree of inflammatory infiltrate among the studied groups

Table 10. Long description
The table is organized into four columns. The first column lists the Group, and the subsequent three columns represent the Degree of inflammatory infiltrate categorized as plus 1, plus 2, and plus 3, with values provided as n and percentage.
* Group G I I: plus 1 is 0 (0 percent), plus 2 is 1 (10 percent), plus 3 is 9 (90 percent).
* Group G I I I: plus 1 is 2 (20 percent), plus 2 is 3 (30 percent), plus 3 is 5 (50 percent).
* Group G I V: plus 1 is 6 (60 percent), plus 2 is 4 (40 percent), plus 3 is 0 (0 percent).
* Group G V: plus 1 is 8 (80 percent), plus 2 is 2 (20 percent), plus 3 is 0 (0 percent).
Below the group data, statistical results are listed:
* Chi-squared (chi super 2) value is 23.63.
* P-value is less than 0.001, marked with two asterisks indicating it is highly significant.
p < 0.001 (highly significant).
Discussion
T. spiralis is a parasitic nematode which leads to trichinellosis, a zoonotic disease characterized by an initial intestinal phase followed by larval migration and encystment in skeletal muscles (Chaudhury Reference Chaudhury, Parija and Chaudhury2022). The control of T. spiralis poses a difficulty because of the range of tissue involvement, effector cells at different phases of infection, and immune response mechanisms (Hamed et al. Reference Hamed, Abdel-Shafi, Elsayed, Mahfoz, Tawfeek and Abdeltawab2022). ABZ, a benzimidazole anthelmintic, remains the primary treatment for trichinellosis by inhibiting parasite microtubule polymerization and energy metabolism, although it has limited effects on host inflammatory and oxidative responses (Cortez-Maya et al. Reference Cortez-Maya, Moreno-Herrera, Palos and Rivera2020).
Our study investigated the therapeutic potential of two dietary phytochemicals, RSV and SFN, renowned for their antioxidant and cytoprotective properties. Our study shows that both SFN and RSV have strong ameliorative effects against the muscle phase of T. spiralis infection, but they may do so through distinct molecular routes.
In our study, the infected untreated group demonstrated a markedly high larval burden, confirming the severity of infection. Treatment with ABZ produced significant reductions in larval burden (81%). These findings agree with studies reporting that ABZ reduces larval viability through microtubule inhibition, resulting in impaired glucose uptake and parasite energy depletion (Chai et al. Reference Chai, Jung and Hong2021).
Regarding RSV, the significant reduction in mean larva count and improvement in histopathological findings may be linked to its potent activation of sirtuin enzymes (SIRTs) that are essential to the preservation of cardiovascular homeostasis (Ministrini et al. Reference Ministrini, Puspitasari, Beer, Liberale, Montecucco and Camici2021). SIRT1, an epigenetic regulator of the endogenous antioxidant and anti-inflammatory defense systems, is one of the most isoform in the cardiovascular system. (Singh et al. Reference Singh, Chhabra, Ndiaye, Garcia-Peterson, Mack and Ahmad2018). As well, researchers have used RSV’s ability to decrease polyamine metabolism, block calcium channels, disrupt the parasite’s oxygen consumption, and create antimitotic effects by blocking tubulin polymerization to explain its antiparasitic activities (Leiro et al. Reference Leiro, Cano, Ubeira, Orallo and Sanmartín2004; Kedzierski et al. Reference Kedzierski, Curtis, Kaminska, Jodynis-Liebert and Murias2007; Lamas et al. Reference Lamas, Morais, Arranz, Sanmartín, Orallo and Leiro2009). Our results agreed with those of Elgendy et al. (Reference Elgendy, Othman, Hasby Saad, Soliman and Mwafy2020) and Salama et al. (Reference Salama, Alabiad and Saleh2023). They demonstrated the direct damaging effect of RSV on T. spiralis larvae and adult stages.
Regarding SFN, it was a notable result that the SFN-treated group presented the greatest improvement in muscle architecture and also showed a reduction in parasite burden. This may be attributed to SFN activating the Nrf2 pathway, upregulating cytoprotective enzymes, and promoting redox balance, thereby mitigating oxidative injury associated with parasitic infection (Zhang et al. Reference Zhang, Zhang, Zhao, Peng, Zhang, Xu and Deng2025). Previous studies have shown that SFN can be used as an antiparasitic against Leishmania (Leary et al. Reference Leary, Anderson, Keyes, Huskie, Blake and Miller2023) and microsporidia(Nosema ceranae) (Borges et al. Reference Borges, Guzman-Novoa and Goodwin2020).
Infection drastically increased MDA levels, a marker of oxidative lipid damage, while only moderately increasing glutathione levels in the face of overwhelming oxidative stress, indicating an early and inadequate antioxidant response. These adjustments are consistent with T. spiralis infection, during which enhanced ROS production is central for disease pathogenesis. Both RSV and SFN have potent modulatory effects on oxidative stress, commonly measured via MDA levels as a lipid peroxidation biomarker. RSV significantly reduces the levels of MDA in most cellular and animal models by scavenging ROS and inducing endogenous antioxidant defences like SOD and GSH (Truong et al. Reference Truong, Jun and Jeong2018).
Resveratrol and sulforaphane treatment effectively reversed oxidative stress. RSV antioxidant action is primarily mediated via SIRT1 activation and upregulation of detoxifying enzymes, in addition to its direct radical scavenging properties (Elgendy et al. Reference Elgendy, Othman, Hasby Saad, Soliman and Mwafy2020). SFN exhibited even greater restoration of GSH levels than RSV, in line with its function as a potent Nrf2 activator, leading to upregulation of genes involved in glutathione biosynthesis and cellular redox homeostasis (Borges et al. Reference Borges, Guzman-Novoa and Goodwin2020; Kubo et al. Reference Kubo, Chhunchha, Singh, Sasaki and Singh2017).
Nevertheless, conflicting findings exist regarding ABZ, as some studies report its potential to increase oxidative stress by inducing mitochondrial dysfunction (Martínez-Espinosa et al. Reference Martínez-Espinosa, Argüello-García, Saavedra and Ortega-Pierres2015). Likewise, the antioxidant effects of SFN have been described as dose-dependent, with suboptimal dosage producing limited redox recovery (Yagishita et al. Reference Yagishita, Fahey, Dinkova-Kostova and Kensler2019).
Our results showed a slight increase in antioxidant levels in the infected group, reflecting an attempted defensive response to infection-related oxidative stress. Nevertheless, this response was limited and inadequate. In contrast, treatment significantly enhanced antioxidant defences, with SFN producing the highest activation of Nrf2 and SLC7A11. SFN disrupts KEAP1-dependent Nrf2 degradation (Ma et al. Reference Ma, Gu, Lian, Wazir, Lu, Ruan and Su2023; Vatankhah et al. Reference Vatankhah, Panahizadeh, Safari, Ziyabakhsh, Mohammadi-Ghalehbin, Soozangar and Jeddi2024), enabling its nuclear translocation and subsequent activation of ARE-regulated genes, including SLC7A11, which facilitates cystine uptake required for glutathione synthesis (Zou et al. Reference Zou, Zhou, Lai, Zhou, Su, Zhang and Qi2025). This proposed mechanism, if applicable to our model, may partly explain the marked restoration of GSH levels observed post-treatment, although KEAP1/Nrf2 nuclear translocation was not directly assessed in the present study.
Resveratrol produced the greatest increase in SIRT1 expression, consistent with its established role as a SIRT1 activator (Deng et al. Reference Deng, Li, Liu, Xiao, Li, Tian and Zhang2019). SIRT1, in turn, enhances mitochondrial antioxidant capacity and modulates downstream transcription factors such as FOXO3a and PGC-1α (Singh et al. Reference Singh, Chhabra, Ndiaye, Garcia-Peterson, Mack and Ahmad2018). Such downstream actions, as reported in the literature, could support improved cellular resilience against oxidative injury, though FOXO3a and PGC-1α expression were not evaluated in our study. ABZ exhibited only modest effects on antioxidant gene expression, which aligns with the fact that its primary mechanism is antiparasitic rather than antioxidant.
Consistent with our results, some studies also reported that SFN can protect against oxidative stress-induced apoptosis through increasing SIRT1 expression levels (Chen et al. Reference Chen, Huang, Lv, Li and Dong2021).
Some studies, however, report conflicting results in specific contexts: SFN has been shown to reduce SIRT1 expression under certain inflammatory conditions (Habtemariam Reference Habtemariam2024), and RSV-induced Nrf2 activation has been described as variable depending on tissue type and stress intensity (Ungvari et al. Reference Ungvari, Bagi, Feher, Recchia, Sonntag, Pearson and Csiszar2010).
In this study, the increase in TNF-α and IL-6 from infection is consistent with reports describing TLR activation and downstream NF-kB signalling as key drivers of ROS-associated cytokine production in trichinellosis, although these upstream signaling components were not directly measured here (Ma et al. Reference Ma, Zhang, Zhang, Wang, Song, Han, Zhang, Long, Cui and Wang2023). Both RSV and SFN appear to produce a significant reduction in cytokine production. RSV’s anti-inflammatory effect may be attributable, based on prior reports, to inhibition of NF-κB nuclear translocation and promoting SIRT1-mediated deacetylation of NF-κB subunits, thus suppressing pro-inflammatory gene expression (Pan et al. Reference Pan, Yu, Huang and Zhu2016).
SFN’s suppression of cytokine production is consistent with reported mechanisms involving Nrf2 activation and HO-1 induction, a potent anti-inflammatory effector molecule that negatively regulates NF-κB signaling, though these pathways were not directly examined in this study (Subedi et al. Reference Subedi, Lee, Yumnam, Ji and Kim2019).
Albendazole showed only a mild decrease in the level of cytokines, likely due to indirect effects secondary to parasite clearance rather than intrinsic anti-inflammatory action. Paprocka et al. (Reference Paprocka, Kołodziej, Wiese-Szadkowska, Helmin-Basa and Bogucka-Kocka2022) reported that there is conflicting literature regarding the anti-inflammatory efficacy of ABZ; some studies have shown very little evidence of anti-inflammatory effect. Additional studies investigating the effect of RSV on IL-6 levels in individuals infected with this parasite have demonstrated variability in response based on the stage of infection and the host’s immune system (Malaguarnera Reference Malaguarnera2019).
Our results showed that at the early stage of infection, the host mounts a compensatory, protective response to combat the oxidative stress and metabolic changes caused by the infection. During this phase, key antioxidant and stress-response pathways, most notably Nrf2, SIRT1, and SLC7A11, may exhibit a modest upregulation as part of an innate attempt to preserve redox balance and prevent cellular injury, and this agrees with those of Wang et al. (Reference Wang, Shao, Zhang, Chen, Chang, Xie and Zhang2023). This early activation supports a slight increase in intracellular GSH synthesis, reflecting the body’s initial defensive effort. However, this endogenous response is typically limited and insufficient to offset the escalating oxidative burden. In contrast, therapeutic interventions with agents capable of enhancing Nrf2/SIRT1 signaling or stimulating SLC7A11-mediated cystine uptake produce a markedly greater elevation in these pathways. Such treatments result in a more pronounced rise in GSH levels, indicating a far more efficient restoration of the antioxidant machinery compared with the mild natural increase observed at the onset of infection.
Conclusion
Collectively, these findings confirm that T. spiralis infection induces substantial oxidative and inflammatory disturbances while suppressing endogenous antioxidant gene expression. Although ABZ demonstrated expected antiparasitic activity, RSV and SFN provided broader biochemical improvement by restoring redox balance, activating Nrf2/SIRT1 signaling, and attenuating inflammatory cytokines. SFN demonstrated the most comprehensive biochemical improvement, while RSV provided superior SIRT1 activation and anti-inflammatory activity. These results highlight the promise of phytochemical-based therapies as candidate adjuncts to conventional anthelmintics, although their efficacy in combination with ABZ was not evaluated in this study and warrants future investigation.
Financial support
This research received no specific grant from any funding agency, commercial or not-for-profit sectors.
Competing interests
The authors declare no competing interests.
Ethical standard
The Zagazig University’s Institutional Animal Care and Use Committee approved the present study (Approval NO: ZU-IACUC/3/F/216/2025).