

Introduction
Agriculture and livestock production are the basis of rural economies in most parts of the world; these activities are relevant for national food security and a source of income and livelihoods especially for the poor. In Tanzania, 30% of the national gross domestic product is from agriculture, 13% from the livestock sector, primarily beef and dairy cattle (MLFD, 2010). The human population in Tanzania has been predicted to increase from 40 million in 2000 to 140 million in 2050 (United Nations, 2015). This implies a likely increasing demand for livestock and livestock products in the country, a demand which to be met will require more efficient farm systems (i.e. higher animal yields per unit of input such feeds). This also implies a need for agriculture to provide income and employment opportunities for that growing population. Despite the large cattle population and abundant pasture and grazing land, the livestock sector in Tanzania has been facing great challenges to grow, to improve its efficiency and to access profitable markets.
In 2006 the Ministry of Livestock Development (currently Ministry of Livestock Development and Fisheries) formulated the national livestock policy, outlining the path to the development of a competitive and efficient livestock industry in the country (MLD, 2006). There are many constraints to cattle productivity, which need to be addressed, from breed performance to seasonal fluctuations on feed availability and access to inputs (e.g. commercial feeds for cattle), services (e.g. vaccination and treatment) and markets to sell the production. An important concern often reported by farmers, but less precisely documented, is animal disease. Endemic infectious diseases such as trypanosomiasis and East Coast fever are associated with great cattle mortality and economic burden on farmers every year (Malele, Reference Malele2012). Several species of Trypanosoma affect cattle, of which Trypanosoma vivax, Trypanosoma congolense, Trypanosoma brucei brucei and Trypanosoma brucei rhodesiense are present in East Africa (OIE, Reference OIE2016). The true prevalence and burden associated with more chronic diseases, which rarely cause death in cattle, but that reduce productivity, such as bovine tuberculosis and brucellosis are not properly documented; these two diseases are present in the country, and control strategies are not in place (Mangen et al., Reference Mangen, Otte, Pfeiffer and Chilonda2002; Ayele et al., Reference Ayele, Neill, Zinsstag, Weiss and Pavlik2004; Akakpo et al., Reference Akakpo, Têko-Agbo and Koné2010; Katale et al., Reference Katale, Mbugi, Karimuribo, Keyyu, Kendall, Kibiki, Godfrey-Faussett, Michel, Kazwala, van Helden and Matee2013). In addition there is concern about the zoonotic potential of these diseases, for example the zoonotic form of Trypanosomiasis is caused by T. b. rhodesiense and is responsible for about 2% of human cases (WHO, 2015). Tuberculosis in cattle is mainly caused by Mycobacterium bovis, which infects humans and is the primary cause of extrapulmonary tuberculosis (Ayele et al., Reference Ayele, Neill, Zinsstag, Weiss and Pavlik2004; Dürr et al., Reference Dürr, Müller, Alonso, Hattendorf, Laisse, van Helden and Zinsstag2013; Müller et al., Reference Müller, Dürr, Alonso, Hattendorf, Laisse, Parsons, van Helden and Zinsstag2013). Brucella abortus, the main cause of brucellosis in cattle, is also responsible for human-brucellosis, sometimes referred to as ‘Malta fever’ or ‘undulant fever’ (Corbel, Reference Corbel2006). Given the close contact of farmers, and rural populations in general, with livestock, the zoonotic risk derived from these cattle pathogens is possibly higher in these communities.
Reports to the World Organization for Animal Health (OIE) confirm the presence of these pathogens in cattle herds in Tanzania. Between 2010 and 2015, 118 cases of trypanosomiasis were reported in cattle; bovine tuberculosis was noted as being present but not quantified except in 2011 when two cases were reported; and brucellosis was noted as being present in cattle but not quantified for all years (OIE, Reference OIEn.d.). However, surveillance systems in the country are known to be weak, and rigorous figures of the national, or even regional, prevalence of these three major animal and human pathogens in the Tanzanian cattle herd do not exist (Mangen et al., Reference Mangen, Otte, Pfeiffer and Chilonda2002; Ayele et al., Reference Ayele, Neill, Zinsstag, Weiss and Pavlik2004). As such, a systematic review and meta-analysis could provide a more accurate picture of disease prevalence than official reporting. A systematic review is a transparent process to find, evaluate and synthesize the results from various studies on a relevant topic (Sargeant et al., Reference Sargeant, Rajic, Read and Ohlsson2006). Meta-analysis is a statistical technique for combining and analyzing the results from different studies to derive conclusions about the topic (Haidich, Reference Haidich2010). These approaches are considered the ‘gold standard’ to obtaining the most compelling and strong scientific evidence base. Considering that substantial research has been conducted in the country on these three agents over the last decades (Alonso et al., Reference Alonso, Lindahl, Roesel, Traore, Yobouet, Ndour, Carron and Grace2016), the objective of this systematic review and meta-analysis was to synthesize the available literature to estimate the individual animal prevalence of Brucella spp., Mycobacterium spp. and Trypanosoma spp. in cattle in Tanzania and identify factors that may influence such estimates.
Methods
Literature review and data extraction
The data used in this study was generated through a systematic review (SR), following best practice as described in the literature (e.g. O'Connor et al., Reference O'Connor, Anderson, Goodell and Sargeant2014; Sargeant and O'Connor, Reference Sargeant and O'Connor2014). The protocol for the SR is reported elsewhere (Alonso et al., Reference Alonso, Lindahl, Roesel, Traore, Yobouet, Ndour, Carron and Grace2016), where detailed information on the SR methods can be found. Briefly, a number of zoonotic hazards relevant to the cattle value chain was identified by experts. This list included Mycobacterium spp., Brucella spp. and Trypanosoma spp. Specific research questions were framed that explored four main aspects of relevance to the selected hazards, including prevalence in cattle, which is the focus of this study. Searches were conducted in four electronic databases (PubMed, CabDirect, Web of Science and African Journals OnLine) using database tailored syntax (search strategy available as supplementary material in Alonso et al., Reference Alonso, Lindahl, Roesel, Traore, Yobouet, Ndour, Carron and Grace2016). A list of titles was downloaded from all databases to an Excel file and duplicates removed. Inclusion/exclusion criteria were defined regarding the relevance of the articles to the research questions of interest. Titles were screened independently by two reviewers. Those titles considered relevant by at least one reviewer were retained. Full papers were obtained online, when available, and read in full. If not available, corresponding authors were contacted to request a copy of the article. Quality criteria were developed and agreed prior to starting the review of full papers. A data extraction template was prepared as an excel file to facilitate standardized extraction. Data were extracted from both full papers and, when the full paper was not available, from abstracts (whenever the abstract contained data). Reviewers read the full paper and abstracts and (i) excluded not relevant articles (according to criteria), (ii) judged the quality of the remaining articles (only for full papers) and (iii) extracted the data. Ten percent of the full papers and abstracts were reviewed in parallel by the four reviewers in the team in two separate rounds, and inconsistent application of criteria or data extraction was discussed and consensus reached. The data extraction template was reviewed accordingly. The remaining papers (90%) were each reviewed by only one of the four reviewers. More details of the SR protocol are available elsewhere (Alonso et al., Reference Alonso, Lindahl, Roesel, Traore, Yobouet, Ndour, Carron and Grace2016).
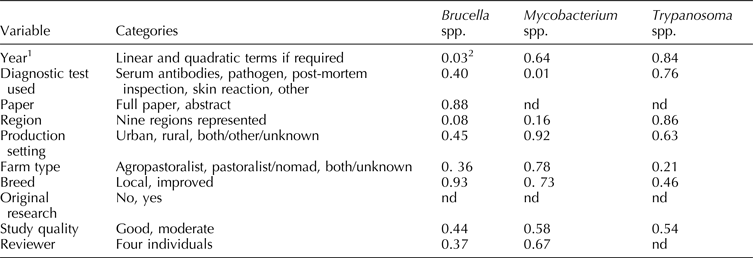
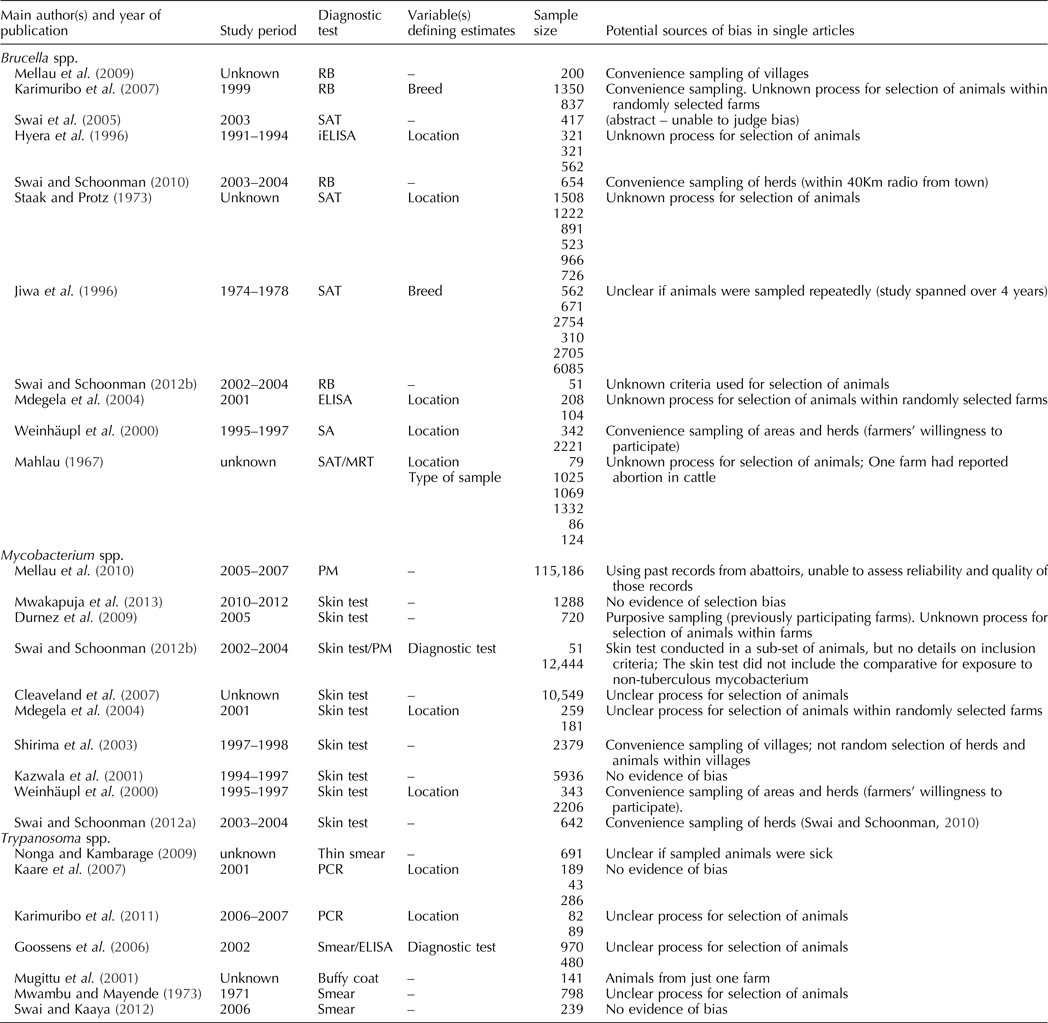
For the purpose of this study, all articles reporting prevalence for any of the three pathogens of interest were included, and the data previously extracted from these articles was exported to a separate Excel file. Only information from articles rated as having moderate or good quality, according to the SR quality criteria (Alonso et al., Reference Alonso, Lindahl, Roesel, Traore, Yobouet, Ndour, Carron and Grace2016) were considered for meta-analysis (poor quality articles were excluded from analysis). The characteristics of the data extracted and the data finally included in the meta-analyses (after data cleaning) are presented in Table 1. Along with the prevalence estimates (or number of tested subjects, positive and negative) reported in each article, data were extracted on study level variables, which might account for differences in prevalence estimates, but only variables for which there were sufficient records (<40% missing) were kept (Table 2). The database for each pathogen was cleaned and only records (i.e. data points in the database, herein referred to also as ‘studies’) providing enough information to allow estimation of prevalence and standard errors (SE) were kept. Prevalence estimates from sick animals and from non-cattle hosts were excluded from analysis (Table 1). The few prevalence estimates reported at an aggregated level (i.e. herd or village level) were excluded (as outside the scope of this study) and only prevalence estimates obtained at individual level (i.e. proportion of positive animals in a study) were used in the analysis. Diagnostic tests were classified into one of five categories (Table 2), based on the nature of the sample and the substance detected although only a subset were used in each individual disease according to the existing methods for detection of each of the target pathogens (e.g. post-mortem inspection of organs and skin test for Mycobacterium spp.; microscopy for Trypanosoma spp.). All the estimates in the final database were cross-checked with the original articles by the senior author to identify and correct any data entry mistakes. Finally, all articles included in the meta-analyses were subjected to a final assessment of bias, looking specifically for the most common sources of bias in prevalence studies: selection and information bias. This final bias review did not result in the exclusion of any additional articles.
Summary of the number and key attributes of prevalence records for Brucella spp., Mycobacterium spp., Trypanosoma spp., in Tanzanian cattle identified in this SR and the quantity of records excluded from the meta-analysis by reason for exclusion

1Prevalence estimates.
2Includes only moderate and good quality articles.
3Includes small ruminants, humans, animal derived products and wildlife.
4Means range of the time span in which studies were conducted, not the publication date.
Variables investigated as possible sources of variation in prevalence estimates across studies and the P-values derived from unconditional association analysis

nd = no data (no variation in predictor within records used in meta-analysis).
1Middle year in which the study was conducted, not published.
2Included a quadratic term.
Statistical and meta-analysis methods
Statistical analyses were done using Stata14 (StataCorp. 2015. Stata Statistical Software: Release 14. College Station, TX). Descriptive statistics were calculated for each of the three pathogens separately.
For each retained record in each dataset, the prevalence of the disease was converted to the logit scale and its standard error computed. Random effects meta-analyses were performed for each of the three diseases using the method of Dersimonian and Laird (Reference DerSimonian and Laird1986) with the estimate of heterogeneity being taken from an inverse-variance model (DerSimonian and Laird, Reference DerSimonian and Laird1986). For each disease a forest plot was created. The amount of variation between studies (Tau squared) was determined as was the proportion of variation that was not attributable to chance (Higgen's I 2). For TB, a sub-group analysis broke the data down by type of diagnostic test (skin reaction vs post-mortem inspection)
Meta-regression was used to investigate factors potentially contributing to the between-study heterogeneity. Initially, unconditional associations (univariable metaregression) were considered for all variables. For continuous predictors (e.g. year in which the study was conducted), the linearity of the association between the predictor and the effect size (logit of prevalence) was evaluated using a scatterplot and lowess curve. If there was any evidence of non-linearity, a quadratic term was added to the model, but only retained if it had P < 0.05. All predictors with unconditional associations, which had P < 0.15 were considered in a multivariable meta-regression, with variables being retained in the final model if they had a P < 0.1 (to account for the limited sample size available for the meta-regressions).
Results
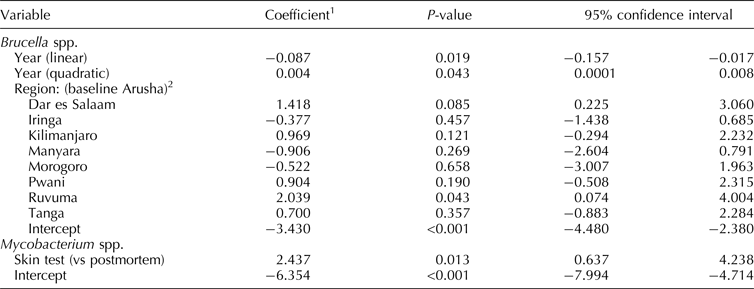
The overall SR database on the three target organisms included 38 full papers and 11 abstracts considered of moderate to high quality. After data cleaning, only 26 full papers and one abstract contributed to this meta-analysis. Some articles contributed more than one record (‘study’) to the database. A description of predictor variables investigated and P-values derived from unconditional associations are presented in Table 2. Table 3 reports the outcomes of the final regression models. A description of articles included in the analysis and the outcome of the assessment of bias is presented in Table 4.
Final meta-regression models for factors affecting estimates of prevalence for Brucella spp. and Mycobacterium spp.

1The coefficient is the log of the odds ratio (OR) for the effect of the factor on the disease frequency. If exponentiated, it provides the OR of the effect.
2Overall P-value was 0.079.
Description of articles included in the study

RB, Rose Bengal test; iELISA, indirect ELISA; SAT, serum agglutination test; SA, slow agglutination; MRT, milk ring test; PM, post-mortem inspection; PCR, polymerase chain reaction.
Brucella spp.
Eighteen (18) articles were available in the SR database reporting information on prevalence of Brucella spp. The final dataset used for the meta-analysis contained 31 records derived from 11 different articles (Table 1). Studies weighted approximately equally with weights on individual studies ranging from 1.7% to 3.6%. Between study variability was large (τ 2 = 0.439; heterogeneity I 2 = 97.0%). Individual study prevalence estimates ranged from 0.3 to 60.8% with the overall average prevalence estimate being 8.2% (95% CI 6.5–10.2). Figure 1 presents the forest plot derived from the meta-analysis. The sample size in the studies included in the analysis ranged from 51 to 6085 (median = 654).
Forest plot presenting prevalence estimates (logit scale) of Brucella spp. in cattle in Tanzania, sorted by mean year in which the study was conducted (1967–2009).

Unconditional evaluations of factors that might have contributed to the heterogeneity identified year (quadratic relationship), and region (nine regions represented in the data) as having P < 0.15 (Table 2). The final multivariable multi-regression model (Table 3) included both predictors (year and region). The quadratic relationship between year and the logit of prevalence showed that the overall prevalence estimates declined from approximately 15% in the late 1960s to about 4% in the late 1980s and then rose back to 14% by 2010. Region was a predictor (P = 0.079) of Brucella prevalence indicating that regional variation in prevalence explained a substantial amount of the variability between studies. However, region was missing from seven records, reducing the sample size to 24. These two predictors explained 61.4% of the variability in prevalence estimates between studies and reduced the τ2 to 0.369.
Mycobacterium spp.
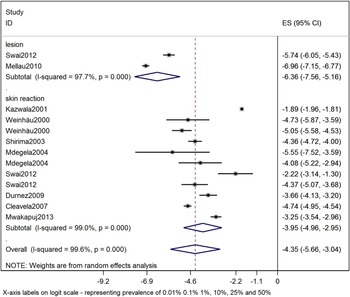
Twenty (20) articles were identified in the SR database having estimates for Mycobacterium spp. The final dataset contained 13 records from ten different articles (Table 1). Studies weighted approximately equally, with weights ranging from 6.72 to 7.91%. The variability between studies was very large (τ 2 = 5.64; heterogeneity I 2 = 99.6%). Individual study prevalence estimates ranged from 0.1 to 13.2% with the average prevalence estimate being 1.28% (95% CI 0.35–4.58). Figure 2 presents the forest plot derived from the meta-analysis. Sample size ranged from 51 to 115,186 (median = 1288).
Forest plot presenting prevalence estimates (logit scale) of Mycobacterium spp. in cattle in Tanzania, by diagnostic test (lesion: post-mortem inspection; skin reaction: intradermal tuberculin test), sorted by mean year in which the study was conducted (1996–2011).

Unconditional evaluations of factors that might have contributed to the heterogeneity identified diagnostic test (post-mortem inspection and skin test) as having P < 0.15 (Table 2). The model revealed a strong association between the diagnostic test used (P = 0.013) and Mycobacterium spp. prevalence, with higher prevalence estimates given by the skin test compared with post-mortem inspection of carcasses. The diagnostic test used explained 42.9% of the variability in prevalence estimates between studies and reduced the τ 2 to 1.094.
Trypanosoma spp.
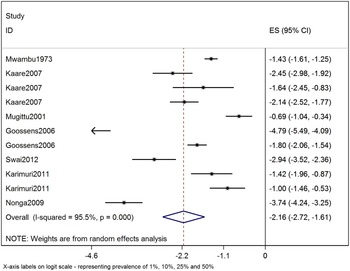
The SR database contained 15 articles reporting estimates for Trypanosoma spp. The final dataset used for the analysis contained 11 records derived from seven articles (Table 1). Studies weighted approximately equally, with weights ranging from 8.13 to 9.73%. Between study variability was large (τ 2 = 0.8164; heterogeneity I 2 = 95.5%). Individual study prevalence estimates ranged from 0.82 to 33.3% with the average prevalence estimate being 10.3% (95% CI 6.20–16.70). Figure 3 presents the forest plot derived from the meta-analysis. Sample size ranged from 43 to 970 (median = 239).
Forest plot presenting prevalence estimates (logit scale) of Trypanosoma spp. in cattle in Tanzania, sorted by mean year in which the study was conducted (1971–2009).

None of the variables in the dataset were found to be associated with Trypanosoma spp. prevalence (Table 2).
Discussion
The results presented in this study derive from the analysis of data obtained through a SR of scientific publications aimed at collating data on livestock and human pathogens in cattle value chains in Tanzania (Alonso et al., Reference Alonso, Lindahl, Roesel, Traore, Yobouet, Ndour, Carron and Grace2016). The scientific literature was very heterogeneous, had a number of study designs, different units of observations that produced estimates that cannot be directly aggregated (individual, herd and village level estimates), and different diagnostic methods. This diversity, together with the lack of data on other required variables, reduced substantially our datasets: the meta-analysis relied on 13 and 11 records for Mycobacterium spp. and Trypanomosa spp. and on 31 prevalence estimates for Brucella spp. Such small numbers translate into relatively large uncertainty in our overall summary estimates.
Best practice in SR requires evaluation and data extraction by at least two reviewers. In our SR, data extraction from 90% of the papers was done by one reviewer due to limited resources. We tried to minimize the potential risk of data input error by a process of joint review and discussion of 10% of papers. In addition, all the estimates used in this meta-analysis were cross-checked with the original articles by the senior author to identify and correct any data extraction or entry mistakes.
While the median sample size for the Mycobacterium spp. records (i.e. prevalence estimates) was 1288, those for Brucella spp. and Trypanomosa spp. were 659 and 239, respectively. The routine, large-scale screening for tuberculosis lesions at post-mortem in cattle at slaughter and the fact that the skin test does not need laboratory facilities may explain the larger sample sizes reported for this pathogen. However, the rather small sample sizes reported for the other two pathogens probably reflect both the difficulty in funding large-scale studies in Tanzania and the difficult logistics of collecting samples and data from small-holder cattle producers. These small sample sizes would have contributed to imprecision in individual prevalence estimates leading to additional heterogeneity among studies.
Study quality was an issue identified during the SR process; articles were rated as poor quality when the study methods were inappropriate or when reporting was incomplete and prevented appropriate data extraction (Alonso et al., Reference Alonso, Lindahl, Roesel, Traore, Yobouet, Ndour, Carron and Grace2016). A poor study design questions the reliability of the results and suboptimal reporting can preclude the use of the research findings. We attempted to limit its impact in this meta-analysis by limiting the data used to that derived from articles rated at least moderate in quality. Moreover, as already reported elsewhere (Alonso et al., Reference Alonso, Lindahl, Roesel, Traore, Yobouet, Ndour, Carron and Grace2016), the quality of articles included in the review was observed to improve over time; most of the articles included in the final meta-analysis databases were published after 2000, with only one article out of seven published in 1973 in the case of Trypanosoma spp. and 4 out of 11 (1967, 1973 and 1996, respectively) in the Brucella spp. dataset. While all the papers included in the meta-analysis were rated as being of at least moderate quality, many research studies used a convenience sampling approach, which could potentially introduce bias (selection bias). This speaks again about the logistics of conducting epidemiological studies in animals in countries where sampling frames do not exist and where access to herds may be challenging. The most common sources of information bias in such studies derive from diagnostics; all diagnostic test procedures are fallible with sensitivity and specificity <100%. As such, all diagnostic tests induce some degree of information bias in a study. The lack in many of the included articles of full details about how animals were selected precluded a more rigorous assessment of bias for each of the estimates included in the analysis. Statistical evaluation of publication bias was not undertaken for several reasons. Begg's and Egger's test are not suitable in situations in which there is a structural association between the effect size (logit of prevalence) and its SE. Other statistical tests of bias (e.g. Harbord's or Peter's) are not appropriate for data in this format (logit and SE). Finally, tests of publication bias are known to be unreliable when heterogeneity is high, as it was in these meta-analyses.
The organism showing the highest average prevalence in cattle was Trypanosoma spp. (10.3%), followed by Brucella spp. (8.2%) and, lastly, Mycobacterium spp. (1.3%). However, the large variability among studies resulted in large confidence intervals around these estimates.
The summary estimates derived from the meta-analyses reflect a weighted average of the records and should not be interpreted as estimates of the national prevalence of the diseases. This is particularly true when it is recognized that the data were collected over a long period of time, and for at least one disease agent (Brucella spp.) there was a strong temporal trend. In addition, few of the studies were based on a formal random sampling of animals in the country (or a region of the country) and the reasons and approaches for sample selection were not always clear in the articles. To minimize heterogeneity, the analysis only included studies that sampled apparently healthy animals as opposed to clinically ill animals that may overestimate the prevalence of disease in the cattle population. Moreover, the estimates used in the analysis were obtained from a range of diagnostic methods, which are known to have different specificity (Sp) and sensitivity (Se) performance (Gall and Nielsen, Reference Gall and Nielsen2004; Matope et al., Reference Matope, Muma, Toft, Gori, Lund, Nielsen and Skjerve2011; Alvarez et al., Reference Alvarez, Perez, Bezos, Marqués, Grau, Saez, Mínguez, de Juan and Domínguez2012; Ahmed et al., Reference Ahmed, Picozzi, Welburn and MacLeod2013), and which test for different aspects of infection: a test looking at serological parameters (e.g. antibodies in blood) will produce different prevalence estimates than a test looking for clinical disease (i.e. clinical signs) or pathogen detection. These factors, in addition to invalidating the summary estimate as an estimate of national prevalence, would also have contributed to the large variability between studies. It was not possible to investigate prevalence for single species within each genus (i.e. M. bovis, T. b. rhodesiense), due to the lack of speciation in the studies, and the use of diagnostic methods that are unable to differentiate between species. However, given the epidemiology of these organisms, it is likely that the Mycobacterium spp. found in cattle corresponds to M. bovis, and Brucella spp. to B. abortus. In the case of Trypanosoma spp., the estimates are likely to include positive animals to T. vivax, T. congolense, T. brucei brucei and zoonotic T. b. rhodesiense (OIE, Reference OIE2016).
The meta-analysis for all three pathogens showed a high degree of variability with Higgin's I 2 ranging from 95.5% in the Trypanosoma dataset to 97.0% for Brucella spp. and 99.6% for Mycobacterium spp. These very high values indicate that nearly all of the variability between studies was beyond what could be explained by chance alone. Because of the large variability between studies, the random effects meta-analysis weighted all studies comparably (range width of maximum 2% points for all pathogens). If there had been less heterogeneity, higher weights would have been given to larger studies.
Region was found to be a strong predictor of prevalence of Brucella spp. indicating that this variable explains a substantial portion of the variability between studies. However, only nine out of 30 countries' regions were represented in the dataset, covering northern, coastal and highland areas of the country. Different production systems (i.e. small scale vs pastoralists) dominate in different areas, and this may explain the geographical differences in prevalence (Njombe et al., Reference Njombe, Msanga, Mbwambo and Temba2012; Katale et al., Reference Katale, Mbugi, Karimuribo, Keyyu, Kendall, Kibiki, Godfrey-Faussett, Michel, Kazwala, van Helden and Matee2013). The analysis also suggests temporal trends in the prevalence of Brucella spp., with lower estimates around the 1980s, and a steady increase since then to these days. Globally, effective control strategies for brucellosis in domestic ruminants exist, including vaccination and testing and culling (OIE, Reference OIE2016). However these interventions, although effective, require intensive and sustained efforts, and represent an important economic burden for the sector and for national governments (McDermott et al., Reference McDermott, Grace and Zinsstag2013). As a consequence, there have not been regular nationwide brucellosis control campaigns in the country that could justify such changes in prevalence overtime. The dairy sector in particular has expanded strongly over the last decades (Njombe et al., Reference Njombe, Msanga, Mbwambo and Temba2012), and in the absence of continued strategies to contain the disease, this may explain why brucellosis prevalence in the country may be increasing.
Estimates of Mycobacterium spp. in cattle in the literature indicate that this pathogen is less prevalent than Brucella in the cattle herds. Contrary to many high-income countries, where large efforts and resources are directed toward detection and elimination of tuberculosis in cattle farms, in Tanzania tuberculosis surveillance is passive, and relies primarily on post-mortem inspection of carcasses after slaughter (Cosivi et al., Reference Cosivi, Grange, Daborn, Raviglione, Fujikura, Cousins, Robinson, Huchzermeyer, de Kantor and Meslin1998; Katale et al., Reference Katale, Mbugi, Kendal, Fyumagwa, Kibiki, Godfrey-Faussett, Keyyu, van Helden and Matee2012). Our meta-analysis showed a marked association between the diagnostic method used and the prevalence estimates, suggesting that post-mortem inspection is a less sensitive approach to detect tuberculosis in cattle, compared with skin testing. Tuberculosis is a slowly progressing chronic disease, and it is therefore logical that there will be a serological response, which is measurable by skin tests, for a long time before lesions can be detected at post mortem. Eleven (11) out of 13 estimates in our dataset derived from skin tests, and showed an average prevalence of 1.9%, compared with the remaining two studies using post-mortem inspection, which reported an average prevalence of 0.2%. Post-mortem inspection of cattle carcasses represents a useful public health strategy, limiting the arrival of contaminated meat to the consumers. However, it is not a suitable control strategy in cattle herds, especially if detection of positive animals at the slaughterhouse does not activate a follow up response to trace and test the herds where the animals come from. Active surveillance through skin test (tuberculin test), and elimination of positive animals are needed to reduce the circulation of Mycobacterium bovis in the cattle herd in Tanzania, but the same constraints described in the case of brucellosis apply.
Trypanosomiasis is a widespread cattle disease in Africa. The disease is known to be still highly prevalent among cattle, and control is costly and challenging (ILRI, 1989; Connor, Reference Connor1991). Numerous initiatives to eradicate it have been attempted over the years, and the amount of research on this disease in livestock in Tanzania and East Africa in general is large (Alonso et al., Reference Alonso, Lindahl, Roesel, Traore, Yobouet, Ndour, Carron and Grace2016). Despite this, only 11 relevant data estimates were available in the literature for our meta-analysis, suggesting that research may be available in quantity but not necessarily of highest quality. Moreover, prevalence estimates were very diverse between studies, ranging from 0.82 to 33.3%. Part of this variability may be explained by different Se and Sp of diagnostic tests. The diagnostic methods used in the vast majority of studies in the dataset looked for the presence of the pathogen in the sample (as opposed to antibody testing), but there exists a large range of such diagnostic methods for Trypanosoma spp. detection in cattle, with diverse Se and Sp (Connor, Reference Connor1991; Luckins, Reference Luckins1992). Many studies have looked at the risk factors for infection in cattle, and being a vector-borne disease, most of it is attributed to the presence and distribution of the tsetse fly vector. None of the variables included in the analysis were found to be significantly associated with the observed variability between studies. This was likely a function of the small sample size available for the meta-regression analysis.
The three pathogens selected for this study are very important zoonotic livestock health problems and, as our study confirms, present in the cattle herd in Tanzania. The fact that these pathogens also can infect humans makes them relevant public health hazards. However, the scientific body of literature on these pathogens in Tanzania was limited and often of suboptimal quality, which likely applies to the scientific literature from other low-income countries. While larger and more robust prevalence studies are needed there is also an urgent need to expand our understanding of the impacts and available control options to adequately support risk assessments and management of the public health implications of these and other zoonotic organisms.
Acknowledgements
We would like to thank Maud Carron for her input during the initial stages of the systematic review. The work was funded by the Consultative Group for International Agricultural Research (CGIAR) Research Program on Agriculture for Nutrition and Health, the Australian Centre for International Agricultural Research (ACIAR) and the ‘Safe Food, Fair Food’ project (funded by the Federal Ministry for Economic Cooperation and Development, Germany).