


Mass extinctions in the history of life
During the Phanerozoic (the last 542 million years in Earth's history), the fossil record shows ample evidence for major biological extinction events (Bambach Reference Bambach2006). Although the precise number of mass extinctions is a matter of definition and depends on the analysed dataset (Bambach Reference Bambach2006; Alroy Reference Alroy2008), a few mass-extinction events stand out due to their particularly dramatic loss of diversity (Raup & Sepkoski Reference Raup and Sepkoski1982; Alroy Reference Alroy2008), including the famous end-Permian and end-Cretaceous extinctions 251 and 65 million years ago.
No consensus has been reached yet concerning the ultimate causes and kill mechanisms of these biological crises. Among the usual suspects are large-scale volcanic eruptions and associated short-term aerosol cooling and long-term warming (Wignall Reference Wignall, Martí and Ernst2005), meteorite impacts responsible for nuclear winter-like conditions (Toon et al. Reference Toon, Zahnle, Morrison, Turco and Covey1997), sea-level changes impacting on the marine biosphere (Hallam & Wignall 1999; Peters 2008), ocean anoxia (Wignall & Twitchett Reference Wignall and Twitchett1996) and the adverse effects of abrupt climatic changes resulting from various climate forcings (Crowley & North 1998). Of course, combinations of different factors might be responsible for mass extinctions (Arens & West Reference Arens and West2008). Furthermore, one might not be looking at a biological signal but a sampling signal, e.g. due to changes in sea level influencing the amount of marine sedimentary rock (Smith & McGowan Reference Smith and McGowan2005).
The confusion is further amplified by repeated suggestions for regular cycles in extinction rates or species diversity of marine invertebrates (fluctuations in diversity can be caused by changes in species origination, extinction or both). Earlier studies suggested a 26-million-year periodicity in extinction (Raup & Sepkoski Reference Raup and Sepkoski1984), which was the basis for the hypothesis of an unknown object orbiting the Sun (Davis et al. 1984; Whitmire & Jackson Reference Whitmire and Jackson1984). The spectral signal on which this ‘Nemesis’ hypothesis was based was later considered spurious. However, Melott & Bambach (Reference Melott and Bambach2010) confirmed the signal in two improved datasets of fossil diversity, but rule out the Nemesis hypothesis due to the extremely regular timing.
More recently, evidence for a 62-million-year cycle in marine diversity was reported (Rohde & Muller Reference Rohde and Muller2005). On the one hand, this result has been challenged on a number of grounds, mostly involving the statistical method (Omerbashich Reference Omerbashich2006) and the dataset used in the analysis (Alroy Reference Alroy2008). On the other hand, it has recently passed a number of critical tests using better-suited methodology (Cornette Reference Cornette2007; Lieberman & Melott Reference Lieberman and Melott2007), a re-analysis (Melott Reference Melott2008) using the Paleobiology Database (Alroy Reference Alroy2008) and thus an improved dataset of fossil diversity, and a comprehensive analysis of three different and independent marine diversity datasets (Melott & Bambach Reference Melott and Bambach2011).
Hence cycles in fossil diversity or extinction remain a highly controversial topic, yet the disagreement between different studies is intriguing, especially since the analysis is often based on the same data. If the case for biodiversity cycles thus appears far from settled from the analysis of the fossil record, it is even less so concerning potential causes.
A number of causes and mechanisms for periodic diversity fluctuations have been suggested in the literature, mostly focusing on causes for extinction rather than origination (Rohde & Muller Reference Rohde and Muller2005; Bailer-Jones Reference Bailer-Jones2009). Sea-level changes and episodes of large volcanic eruptions are the most widely accepted terrestrial causes of major extinctions, and the question has been investigated whether these could operate periodically. Periodic changes of sea level would require either periodic changes in climate (thus requiring an unknown source for regular changes in climate forcing) or periodic uplift of continents (Hallam Reference Hallam1984). As for volcanic eruptions, large igneous provinces (caused by large magma flows emerging over short periods of time) indeed show some evidence for weak cycles with periods of ∼15, ∼30 and ∼60 million years over the last 300 million years (Prokoph et al. Reference Prokoph, Ernst and Buchan2004). Such periodic volcanism could be caused either by periodic mantle plumes (Schaeffer & Manga Reference Schaeffer and Manga2001) or, more speculatively, by periodic impacts of minor bodies from space (see below).
Astronomical phenomena are a source of periodicity in a wide range of frequencies, and thus many authors have argued for an astronomical origin of the periodicity in the fossil record. Periodic enhancement of the impact rate of comets could be triggered by perturbations of the Oort cloud due to periodic passages of giant molecular clouds or capture of minor bodies during the Sun's orbit around the Galactic centre. These could happen when the Sun crosses either the Galactic mid-plane (Rampino & Stothers Reference Rampino and Stothers1984) or the Milky Way's spiral arms (Napier & Clube Reference Napier and Clube1979). Furthermore, the Oort cloud might be perturbed by Galactic tidal forces (Heisler et al. Reference Heisler, Tremaine and Alcock1987). The connection between long-period comets from the Oort cloud and mass extinctions has been criticized, however (Kaib & Quinn Reference Kaib and Quinn2009). Furthermore, recent models for the Galactic structure show an asymmetric structure and exclude strictly periodic spiral-arm crossings with periods below ∼500 million years (Overholt et al. Reference Overholt, Melott and Pohl2009). Finally, Galactic mid-plane crossings occur every about 30 million years, a period that does not match the 62-million-year cycle, although it is close to the more ambiguous shorter period in fossil diversity (Raup & Sepkoski Reference Raup and Sepkoski1984; Melott & Bambach Reference Melott and Bambach2010).
Supernova explosions have been suggested as causes of mass extinction (Ellis & Schramm Reference Ellis and Schramm1995), and their rate could be periodically enhanced during passages through the Milky Way's plane or spiral arms, although the periods, again, do not match, and the density of the supernova may only be slightly enhanced in these higher-density regions (Bailer-Jones Reference Bailer-Jones2009).
Finally, Galactic cosmic rays have been suggested as the cause of periodic mass extinctions, most convincingly for the 62-million-year period in the fossil record (Medvedev & Melott Reference Medvedev and Melott2007). In this scenario, the Earth becomes exposed to enhanced rates of cosmic rays from the Virgo cluster of galaxies whenever it is far North of the Galactic plane. Both changes in climate and biologically harmful radiation have been invoked as extinction mechanisms, although both effects are likely very small.
Traditionally, many investigations of the causes of mass extinctions and of possible periodic extinctions have focused on single causes and (so far unsuccessful) searches for strong periodic forcings of biodiversity. It can be argued that – apart from limitations of the available data – this is the primary reason for the longstanding controversy about periodic extinctions in the fossil record. In reality, one could very well be looking at a combination of different extinction causes, including random events and one or more periodic driver(s). This can be viewed as an extension of the ‘press–pulse model’ for extinctions independently proposed by Arens & West (Reference Arens and West2008), in which a press disturbance puts stress on the ecosystems and acts together with a sudden and catastrophic pulse disturbance to produce the major extinction events observable in the fossil record.
Even if a periodic contribution to the Earth's extinction record exists however, questions arise as to why its signature is so difficult to detect, how important the periodic component is in comparison with other factors and what limits can be placed on it. This will be the focus of this paper.
This paper is organized as follows. Section 2 looks at the causes of extinction events on a rather fundamental level and explores different options. In Section 3, I introduce a conceptual model for mass extinctions combining periodic and random extinction causes. A special case of this model with a weak periodic disturbance of the biosphere is discussed in Section 4, and Section 5 presents a first test of this hypothesis using the best available data. Finally, Section 6 concludes with a discussion and summary of the results.
Weighing the options
The discussions above clearly demonstrate that the scientific community has not yet reached a consensus on two important questions concerning the origin of major extinctions: (1) Are the extinction peaks observed in the fossil record triggered by one single cause or multiple causes? (2) Are there any periodic causes for a decrease in diversity? Finding an answer to these fundamental questions appears to be a prerequisite for solving the problem of the causes of extinction events in the history of life on Earth.
From studies of the origins of extinctions, one can conclude that there were many catastrophic events such as massive volcanic eruptions or bolide impacts in the Earth's history for which a major impact on the biosphere is likely (e.g. Wignall Reference Wignall and Taylor2004). This would imply that mass-extinction events could be caused by a variety of triggers, although this would have to be demonstrated beyond doubt by detailed modelling of the causes’ effects on the climate and the biosphere.
If mass extinctions are caused by several factors, and if there are periodic drivers of species extinction, one can immediately draw some conclusions about extinction causes. Either one seems to be left with the far-reaching conclusion that the various drivers of mass-extinction events are in reality causally connected (e.g. by periodic impacts from space triggering the volcanic eruptions responsible for large igneous provinces), which does not seem particularly likely for a number of reasons (see e.g. White & Saunders Reference White and Saunders2005). Or mass extinctions would be caused by a combination of periodic and random disturbances, and in many ways this appears to be the most interesting and most likely case. This possibility will be explored making use of a conceptual model of the major extinctions in the past.
A unified model for mass extinctions
It will prove useful to think about extinction events within the framework of a simple conceptual model, which is illustrated in Fig. 1. The model has two key elements: the combination of various extinction causes acting together to produce the observed biodiversity history, and the existence of a threshold beyond which a mass-extinction event is detected or defined.
Illustration of the conceptual model. The figure shows the extinction rate as a function of time. The total extinction rate (red) is a combination of the background extinction rate (green, E b), one random event with strongly elevated extinction rate E r (magenta) and a periodic perturbation (blue) with amplitude E p. The threshold extinction rate E t above which the extinction forcings would be defined as mass extinction is shown as a dashed line. In this case of a strong periodic extinction driver, one would find a major extinction event whenever the periodic signal peaks and particularly severe extinctions when a peak coincides with a random event.

In this model, the total extinction rate as a function of time is considered as a combination of a noisy background component, a periodic componentFootnote 1 and occasional random events with higher extinction rate, which could be resulting from impacts from space, large-scale volcanism and the likeFootnote 2.
Furthermore, one can imagine a particular threshold extinction rate above which a particular extinction event would be detected in the fossil record or defined as a true mass-extinction eventFootnote 3. It is important to note that a mass-extinction threshold defined in this way need not necessarily be constant in time. Furthermore, while the definition of a threshold disturbance for mass extinctions seems to be well justified, the model could be extended to describe a more continuous transition between losses of biodiversity of various magnitudes.
Although it certainly is only a simplistic representation of the much more complex ecological reality, this model helps to focus on different possibilities for the origins of the major losses of biodiversity in the history of life.
Periodic enhancements of extinction rate
One could imagine, for example, that a periodic forcing regularly impacts on the biosphere severely enough for a massive extinction to occur, with particularly catastrophic extinction events occurring whenever a large random pulse coincides with a peak in periodic extinction forcing (see Fig. 1).
There is another possibility, however, that has been often neglected so far in discussions of possible periodic impacts on the biosphere. In this case, which is illustrated in Fig. 2, the periodic disturbance alone is not capable of causing a true mass extinction. Major extinctions are then triggered when frequent random pulses from one or more different causes are pushing the biosphere beyond the threshold during the phases of higher extinction rate caused by the weak periodic signalFootnote 4. In this sense, the model can be viewed as an extension of the press-pulse model developed by Arens & West (Reference Arens and West2008) in which the press disturbance is periodic in nature.
Same as Fig. 1, but for a periodic extinction signal too weak to cause a major extinction in itself. In this case of a comparatively weak periodic extinction signal, frequent random events push the total extinction rate above the threshold of a true mass extinction.

The weakness of the periodic signal together with distortions from random extinction pulses may present one reason for the controversy about potential periodicity in the fossil record.
Two conditions must be met in order to make this scenario plausible. First, the random pulses must be frequent and intense enough to cause extinction (almost) every time the periodic disturbance peaks. In mathematical terms, the average ‘frequency’ 〈f r〉 – defined by the average time interval 〈ΔT r〉 between random impacts, 〈f r〉≡1/〈ΔT r〉 – of random pulses with extinction rate E r beyond E t −E b −2E p (see Fig. 1 for definitions) must be larger than the frequency f p of the periodic signal, or

since the extinction rate E r of the random pulses must be larger than the difference between the threshold E t for a mass-extinction event and the sum of background extinction rate E b and peak extinction rate E p of the periodic driver, or E r>E t−E b−2E p to be able to push the extinction rate beyond the threshold whenever the periodic cause peaks.
Secondly, strong random impacts should not occur so often as to raise the extinction rate above the threshold even in minima of the periodic forcing, or

Note that an intensity distribution following these conditions, i.e. with higher-intensity events being less frequent than lower-intensity events, is to be expected from the distribution function of many physical quantities.
Without a knowledge of E p and E t, it is rather difficult to assess whether the various random pulses of extinction disturbances were frequent and intense enough to satisfy these criteria. If, on the other hand, the peak amplitude E p for a periodic forcing under investigation and an extinction threshold E t can be quantified, one can – at least in principle – test whether these conditions are fulfilled or not.
Some conclusions concerning these two criteria, however, can be drawn from the frequency of the two most widely discussed extinction triggers, bolide impacts and flood-basalt eruptions, however. Asteroid or comet impacts of objects with diameters beyond a few kilometres are expected to affect the climate and the biosphere on global scales (Toon et al. Reference Toon, Zahnle, Morrison, Turco and Covey1997) and occur every few million years or so, while larger impacts similar to the Chicxulub event occur in intervals of 100 million years or less (Chapman Reference Chapman2004). About a dozen (continental) flood-basalt provinces with ages up to 300 million years are known today, corresponding to an average time interval between eruptions of about 25 million years (White & Saunders Reference White and Saunders2005).
Assuming that the larger impacts and the flood-basalt eruptions have the potential to affect global biodiversity, these rates appear indeed high enough to trigger extinctions in connection with a hypothetical underlying periodic disturbance with a period of 62 million years, as suggested in Rohde & Muller (Reference Rohde and Muller2005). Indeed, White & Saunders (Reference White and Saunders2005) and Arens & West (Reference Arens and West2008) demonstrate that major impacts and eruptions occur so frequently that impacts and eruptions coinciding in time may explain the most dramatic extinction events. Additional triggers intrinsic to the Earth's system may further contribute to the frequency of random impacts on the biosphere.
The intriguing fact that not all flood-basalt eruptions and astronomical impacts have left their trace in the record of biological diversity does not invalidate this argument. This could be evidence of a further prerequisite needed for a major extinction event, which may be identical with a possible periodic extinction driver.
Beyond these qualitative arguments, the performance of the model will be tested in a more quantitative way in the following section.
Confronting the model with the data
Although a conclusive test of the model described above appears to be difficult given the sparse data available today and the incomplete understanding of mass-extinction mechanisms, a first assessment can be performed using information on the variation of the extinction rate of marine invertebrates from the Paleobiology Database (Alroy Reference Alroy2008), large igneous provinces (Ernst & Buchan Reference Ernst, Buchan, Ernst and Buchan2001) and bolide impacts from the Earth Impact Database through geological time. Details on the datasets can be found in Appendix A.
The extinction curve of marine invertebrates is approximated by a simple linear model for the (de-trended) extinction rate E as a function of age τ by minimizing χ2 (see Appendix B for details):

with the background extinction rate a b, the amplitude a p, period T and phase φ of a periodic perturbation, and coefficients a v and a i translating the area of large igneous provinces and the energy of bolide impacts into extinction rate.
Given the limited understanding of extinction mechanisms and the available data, this simple parameterization of the extinction effects of volcanoes and impacts is a reasonable approximation. Note, however, that there are several problems with this approach: First, the record of large igneous provinces and impact craters is incomplete and suffers from dating problems, especially for ages beyond 250 Ma. Secondly, while a linear relation between perturbation and extinction rate is assumed, a non-linear scaling is much more likely. Thirdly, while magma area and crater diameter are certainly reasonable proxies for their environmental effects, geographic and geologic factors almost certainly influence the extinction rate as well. Fourthly, dating uncertainties cause temporal misalignment between the data. The main effect of these limitations will be rather poorly determined values for a v and a i.
A χ2 approximation of the model described in equation (3) to the observed de-trended per-taxon extinction rate of marine invertebrates is shown in Fig. 3, and the best-fit parameters are given in Table 1.
De-trended per-taxon extinction rates of marine invertebrate genera from Alroy (Reference Alroy2008) as a function of time (black) and the results of the model fit (red). The dashed line shows an estimate for the threshold for a mass-extinction event chosen to select the ‘big five’. The dates for the 18 mass-extinction events during the Phanerozoic (Bambach Reference Bambach2006) are indicated at the bottom, with the ‘big five’ marked by thick lines. O, Ordovician; S, Silurian; D, Devonian; C, Carboniferous; P, Permian; Tr, Triassic; J, Jurassic; K, Cretaceous; Pg, Paleogene; N, Neogene.

Results of the fit to the data for the model with and without the periodic extinction component. Model parameters are the background extinction rate ab, the amplitude ap, period T and phase φ of a periodic perturbation, and coefficients av and ai translating the area of large igneous provinces and the energy of bolide impacts into extinction rate. Both χ 2 for the fit and the weights w from AIC are given in the last two columns

Despite the fact that the overall model fit certainly is not perfect (as is to be expected from the limitations outlined above), it indeed shows a weak periodic perturbation below the threshold for true mass extinctions. Furthermore, it has been verified that the amplitude of this periodic signal is quite robust with respect to variations in the timing and scaling of the random impacts. Moreover, qualitatively similar results are obtained with a test using the older Sepkoski dataset (Rohde & Muller Reference Rohde and Muller2005; Bambach Reference Bambach2006), which has higher time resolution, but is not corrected for sampling bias. Finally, a fit without the periodic component yields a slightly worse approximation of the data (see Table 1). Using Akaike's Information Criterion (AIC, Burnham & Anderson Reference Burnham and Anderson2002) to compare the models yields an AIC difference ΔAIC=10.78 and favours the model including the periodic perturbation with a weight w=0.9955 over the purely random model with w=0.0045.
This simple test therefore shows that the model of a weak periodic perturbation plus random impacts on the biosphere presented above is in agreement with the available data, although a more comprehensive test would require more complete data on impacts and volcanic eruptions as well as a better understanding of the scaling of biodiversity loss for these perturbations. It also demonstrates that any contribution of a periodic component to the extinction rate is small compared to random events such as impacts and volcanic eruptions.
Discussion
The last years have seen considerable improvement in thinking about mass-extinction events in the sense of a development from a focus on one particular event or on one particular ultimate cause towards a more complete picture. One example is the study by Arens & West (Reference Arens and West2008), who test the hypothesis that large-scale volcanism combined with impacts from space constitutes a general mechanism for mass extinctions. This is part of their more general ‘press–pulse’ theory in which a press disturbance puts stress on the ecosystems and acts together with sudden pulse disturbances to cause the major extinction events.
Following this pursuit of a more general theory for extinction events, a simple conceptual model for the relation between the causes and impacts of mass extinctions is presented in this paper. On the most fundamental level, two pressing questions about mass-extinction events in the Earth's history require an answer and should direct future research on this issue: (1) Are major extinctions caused by one single cause or by several? (2) Are there any periodic drivers for species extinction?
As for the first question, it appears likely that there is more than one cause for major extinctions. Indeed, the random concurrence of two impacts on the biosphere from different sources (e.g. massive volcanism and an impact from space) might be required to cause the most massive extinction events (White & Saunders Reference White and Saunders2005; Arens & West Reference Arens and West2008). Answering this question requires a detailed understanding not only of the ultimate extinction causes itself, but more importantly of their effect on the biosphere. Since in most cases the link between cause and ecological impact is conveyed by the Earth's climate, paleoclimate data and climate modelling of extinction events are clearly very important (Feulner Reference Feulner2009). Ultimately, of course, one would like to model the impacts on the Earth's ecosystems as well (e.g. Melott & Thomas Reference Melott and Thomas2009; Martin et al. Reference Martin, Cardenas, Guimarais, Peñate, Horvath and Galante2010, for the impact of Gamma Ray Bursts on the biosphere).
The second question concerning cycles in fossil diversity remains unanswered as well. Considering the well-known deficiencies of the fossil record (e.g. Peters & Footer Reference Peters and Foote2002), sampling issues of paleobiological databases and the difficulties of statistically sound analyses of time-series data (e.g. Bailer-Jones Reference Bailer-Jones2009), it is understandable that many scientists remain skeptical about the periodicity of biodiversity on timescales of tens of millions of years. Even vastly improved datasets such as the Paleobiology Database (Alroy et al. Reference Alroy, Aberhan, Bottjer, Foote, Fursich, Harries, Hendy, Holland, Ivany and Kiessling2008) appear to be unable to provide a definitive answer yet (Alroy Reference Alroy, Aberhan, Bottjer, Foote, Fursich, Harries, Hendy, Holland, Ivany and Kiessling2008; Melott Reference Melott2008; Melott & Bambach Reference Melott and Bambach2011).
At the present time, therefore, biodiversity cycles cannot currently be completely ruled out empirically, and the possibility of periodicity in the fossil record has some interesting implications for the causes of mass-extinction events, which are certainly worth exploring. In this paper, a new conceptual model has been used to demonstrate that a periodic biosphere disturbance need not necessarily be strong enough to cause mass extinctions in itself, but probably acts in conjunction with other, randomly occurring biosphere impacts to cause the major extinction events in the history of life on Earth.
This simple model represents an improvement in various ways. First, the weakness of the periodic disturbance naturally explains why the evidence for cycles in the fossil record is at the limit of statistical credibility. Furthermore, due to the randomness of the non-periodic causes, mass extinctions will occur around the peaks of the periodic disturbance (but not exactly at the maxima), and so the resulting time series of extinctions is not strictly periodic, in accordance with the data.
Secondly, it could explain the difficulty in finding a periodic disturbance strong enough to cause the major extinctions in the fossil record. If a weak periodic cause, together with random perturbations, is sufficient to produce periodic extinctions, there are many more possibilities for cyclic disturbances maybe only slightly enhancing the extinction rate.
Thirdly, it helps to reconcile hypotheses for periodic biodiversity stressors with more traditional explanations for extinction events such as astronomical impacts or large-scale volcanism, because a combination of periodic and random causes is required to produce true mass extinctions. This also helps to bridge the gap between research on possible periodic impacts on the biosphere and established paleontological wisdom.
Finally, a combined model of periodic and random extinction causes allows us to quantify the relative importance of various extinction drivers, at least in principle. Although current datasets and our incomplete understanding of extinction mechanisms restrict our ability to place strong limits on periodic extinction causes, the preliminary analysis in this paper suggests that their contribution to the major extinction epochs in the Earth's history is probably comparatively small.
Appendix A. Description of the datasets used in the model tests
De-trended extinction-rate data for marine invertebrate genera were taken from the Paleobiology Database (http://www.paleodb.org, Alroy et al. Reference Alroy, Aberhan, Bottjer, Foote, Fursich, Harries, Hendy, Holland, Ivany and Kiessling2008); these are the data shown in Fig. 2 of Alroy (Reference Alroy2008). Since the primary focus of the model is a description of the major extinction events and not in the general trend in extinction rate (a secular decline over the Phanerozoic), the de-trended time series for the extinction rate is used for the analysis.
Volcanic perturbations V(τ) during the Phanerozoic are taken from a compilation of large igneous provinces (Ernst & Buchan Reference Ernst, Buchan, Ernst and Buchan2001), updated and available online at http://www.largeigneousprovinces.org/, accessed 23 September 2009). Although the volume of the magma is probably the best indicator of the impact of a volcanic event, it is generally poorly determined due to erosion. Here the area of the province is used as a proxy for V(τ). Following Arens & West (Reference Arens and West2008) the sample is restricted to continental provinces with reasonable information on the age of the eruption, leaving 19 large igneous provinces. For longer eruption periods the signal is distributed equally over the entire age interval.
Data on impact structures were obtained from the Earth Impact Database (http://www.unb.ca/passc/ImpactDatabase/, accessed 23 September 2009), which currently contains 176 confirmed impact craters. The environmental effects of impacts are assumed to depend on the energy Y of the impact, which is computed from the diameter D of the crater (measured in kilometres) according to Y=34 PJ D 3.4 (Toon et al. Reference Toon, Zahnle, Morrison, Turco and Covey1997). The analysis was restricted to impacts during the Phanerozoic and to impact diameters larger than 10 km, resulting in 43 impact structures used in the analysis. Age errors were taken into account by distributing the signal equally over all sub-stages within the error interval. For both volcanic eruptions and impacts the age scale is adjusted to match the one for the extinction curve.
Appendix B. Description of the model for the extinction rate
In the model, the de-trended extinction rate is described using a simple linear model, in which the total extinction rate is the sum of the background extinction rate E b, a periodic contribution E p, a contribution from flood-basalt volcanism E v and one from bolide impacts E i:

Since the extinction rate is already de-trended, the background extinction rate E b is described by a constant a b:

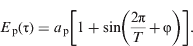
The periodic signal is parameterized by a sine wave with amplitude a p, period T and phase φ:
For simplicity (and lack of detailed knowledge), linear scaling relations are assumed for the biological effects of large-scale volcanic eruptions V(τ) and bolide impacts I(τ):

and

where V(τ) and I(τ) are estimates of the perturbations caused by flood-basalt volcanism and bolide impacts in the geological past, yielding the full model for the extinction rate E as a function of age τ,

given in equation (3) in the main text of the paper.
Acknowledgements
It is a pleasure to thank Coryn Bailer-Jones, Adrian Melott, Stefan Rahmstorf and Brian Thomas for comments on earlier drafts of this paper, two anonymous reviewers and Adrian Melott for constructive reviews that helped improve the text, as well as John Alroy for providing the PaleoDB data. Travel funding by the Deutsche Forschungsgemeinschaft (DFG, grant FE 1060/1–1), the European Space Agency (ESA) and the European Astrobiology Network Association (EANA) is gratefully acknowledged. This research made use of NASA's Astrophysics Data System.



