1 Introduction
The onset of large-scale unsteadiness for viscous fluids past axisymmetric bodies represents one of the major subject of study for several modern engineering applications, especially in the field of launcher afterbodies. The complex three-dimensional (3-D) wake dynamics associated with a wide range of axisymmetric bodies (such as disks, spheres or spheroids) shares many similarities and fundamentally differs with respect to its two-dimensional (2-D) counterparts (i.e. in a cylinder wake). In this respect, the wake behind a sphere may be considered as a representative simplified case for axisymmetric bodies. Both numerical simulations and experiments carried out on spheres at low Reynolds numbers reveal the existence of a toroidal recirculation behind the solid body (see Taneda (Reference Taneda1956) for the first experimental evidence). Several authors (Magarvey & Bishop Reference Magarvey and Bishop1961; Natarajan & Acrivos Reference Natarajan and Acrivos1993; Tomboulides, Orszag & Karniadakis Reference Tomboulides, Orszag and Karniadakis1993; Wu & Faeth Reference Wu and Faeth1993) also show that a first bifurcation occurs when a critical Reynolds number, based on free-stream quantities and the sphere diameter, is reached (
 $Re_{c}^{(1)}$
) and yields to the loss of axial symmetry of the steady base flow. The wake is shifted along the normal direction and exhibits a pair of steady streamwise vortices that extend on a very long distance downstream of the body. Although the flow is no longer axisymmetric, a reflectional symmetry of a plane in the streamwise direction still exists. When the Reynolds number is further increased beyond a second critical value (
 $Re_{c}^{(2)}$
) the flow undergoes a supercritical Hopf bifurcation and is dominated by a low-frequency shedding of hairpin-like vortices in a Strouhal number range of
 $St\approx 0.1{-}0.2$
(see Tomboulides et al. (Reference Tomboulides, Orszag and Karniadakis1993), Johnson & Patel (Reference Johnson and Patel1999), Ormières & Provansal (Reference Ormières and Provansal1999), Schouveiler & Provansal (Reference Schouveiler and Provansal2002) and Gumowski et al. (Reference Gumowski, Miedzik, Goujon-Durand, Jenffer and Wesfreid2008) for experimental results and direct numerical simulations).
The direct numerical simulations (DNS) of Tomboulides & Orszag (Reference Tomboulides and Orszag2000), carried out by using a mixed spectral element/Fourier method, show that a primary bifurcation occurs at
 $Re_{c}^{(1)}\approx 210$
and that the flow remains steady until
 $Re_{c}^{(2)}\approx 270$
. Extensive steady-state axisymmetric numerical simulations and linear stability analyses of flow past a sphere were reported by Ghidersa & Dusek (Reference Ghidersa and Dusek2000), Tezuka & Suzuki (Reference Tezuka and Suzuki2006) and Morzyński (Reference Morzyński2009). Within a linear analysis framework, the axisymmetry breaking can be understood by reducing the system into subspaces, each of them being associated with a different azimuthal wavenumber (referenced by
 $m$
in what follows). As reported by previous authors, the primary bifurcation is seen to arise from a temporally amplified steady mode for the subspace corresponding to
 $m=1$
. The bifurcation is then regular. Ghidersa & Dusek (Reference Ghidersa and Dusek2000) and Meliga, Sipp & Chomaz (Reference Meliga, Sipp and Chomaz2007) also pointed out that the superposition of the steady mode modulated by an arbitrary amplitude onto the base flow induces a loss of symmetry and causes the appearance of a double-threaded wake, observed both experimentally and numerically. The axisymmetric base flow assumption of the linear stability theory can therefore yield inaccurate descriptions of the flow around the second (Hopf) bifurcation, with repercussions for the identification of critical Reynolds number and characteristic frequency.
As underlined by Meliga et al. (Reference Meliga, Sipp and Chomaz2007) and Fabre, Auguste & Magnaudet (Reference Fabre, Auguste and Magnaudet2008), the relevance of a stability analysis based on axisymmetric equilibrium states that no longer exist at these Reynolds numbers, is questionable. To fill the gap between the theory and numerical/experimental predictions, Pier (Reference Pier2008) investigates the absolute/convective properties of the planar symmetric basic state under the parallel flow assumption along the streamwise direction. While the existence of an absolutely unstable pocket has been clearly established by the author, the prediction of both the critical Reynolds number and the Strouhal number is very rough due to strong non-parallel effects. Trying to overcome the effect of the steady mode on the base flow, Meliga et al. (Reference Meliga, Sipp and Chomaz2007) and Fabre et al. (Reference Fabre, Auguste and Magnaudet2008) reinterpreted the Hopf bifurcation as a weakly nonlinear interaction between the stationary mode and the unsteady mode associated with an axisymmetric base flow. While the resulting dynamical system of coupled amplitude equations appropriately depicts the bifurcation diagram, the assumption of simultaneous nearly neutral modes (i.e. for the steady and oscillatory modes) represents an inconsistency since the primary and secondary bifurcations occur at different values of the Reynolds number.
These findings motivate the investigation of the Hopf bifurcation by means of a linear stability analysis that allows a 3-D equilibrium state. Citro et al. (Reference Citro, Siconolfi, Fabre, Giannetti and Luchini2017) recently carried out a fully 3-D global linear stability analysis without any assumption on the base flow (see Theofilis (Reference Theofilis2011) for a review) by using a time-stepper approach (see Edwards et al. (Reference Edwards, Tuckerman, Friesner and Sorensen1994) and Bagheri, Åkervik & Henningson (Reference Bagheri, Åkervik, Brandt and Henningson2009)). Citro et al. (Reference Citro, Siconolfi, Fabre, Giannetti and Luchini2017) used an in-house stabilization algorithm called BoostConv (Citro et al. Reference Citro, Giannetti, Luchini and Auteri2015) to obtain the planar-symmetric steady base flow that is unstable above the Hopf bifurcation and found a close match between the leading mode and the onset of the unsteadiness.
While the space–time dynamics of large-scale motions for the flow around a sphere is now well predicted by linear stability analysis, little is known about the effect of compressibility on the coherent structures in the wake region. Assuming an axisymmetric base flow configuration independently of the Reynolds number, Meliga, Sipp & Chomaz (Reference Meliga, Sipp and Chomaz2010) examined the effect of compressibility on the linear stability of wake flows, such as an afterbody at zero angle of attack and a sphere. By following the stable and unstable regions in a
 $M$
–
 $Re$
plane, they showed that for the supercritical Hopf bifurcation there exists a stabilizing (destabilizing) effect of the Mach number for the afterbody (sphere) flow. As well as not considering the 3-D effects for the base flows around the Hopf bifurcation, their analysis did not account for the presence of shock waves and it was limited up to
 $M\approx 0.7$
. A compressible perfect gas with constant specific thermal conductivity and dynamic viscosity related by a unit Prandtl number was considered, limiting some coupling effects between the temperature and momentum equations. Nagata et al. (Reference Nagata, Nonomura, Takahashi and Fukuda2016) investigated the evolution of both the mean flow topology and the unsteadiness of the wake behind a sphere at high Mach and low Reynolds numbers conditions by performing nonlinear fully 3-D DNS calculations. The authors showed that an increasing Mach number has a stabilizing effect that causes an axisymmetrization of the flow and/or the disappearance of the unsteady self-sustained periodic behaviour. In a second study at higher Reynolds numbers, Nagata et al. (Reference Nagata, Nonomura, Takahashi, Mizuno and Fukuda2018) showed that for a supersonic case at
 $M=1.2$
the wake is axisymmetric and steady up to
 $Re=750$
and that the unsteady hairpin shedding only starts at
 $Re=1000$
. However, the origins of such phenomena were not discussed in the light of global linear stability theory.
Global stability analysis has been recently shown to be successful for compressible applications of supersonic jets (Ray & Lele Reference Ray and Lele2007; Nichols, Lele & Moin Reference Nichols, Lele and Moin2009; Beneddine, Mettot & Sipp Reference Beneddine, Mettot and Sipp2015), parabolic and bluff bodies (Mack, Schmid & Sesterhenn Reference Mack, Schmid and Sesterhenn2008; Meliga et al. Reference Meliga, Sipp and Chomaz2010), open cavities (Brès & Colonius Reference Brès and Colonius2008) and shock-wave/boundary-layer interactions (Crouch, Garbaruk & Magidov Reference Crouch, Garbaruk and Magidov2007; Robinet Reference Robinet2007; Sartor et al. Reference Sartor, Mettoc, Bur and Sipp2015; Guiho, Alizard & Robinet Reference Guiho, Alizard and Robinet2016). Although the presence of shock waves was considered in some of these studies, fully 3-D configurations with shock waves are almost non-existent in the literature.
At high Mach and low Reynolds number conditions, as in Nagata et al. (Reference Nagata, Nonomura, Takahashi and Fukuda2016, Reference Nagata, Nonomura, Takahashi, Mizuno and Fukuda2018), the sphere diameters under consideration would be in the range
 $D=10^{-5}{-}10^{-4}~\text{m}$
. Despite the absence of any practical application, a better understanding of the compressibility effects on the unstable bifurcations of axisymmetric bodies serves to extend the state-of-the-art knowledge but may also provide a first step towards the physical modelling of large scale motion arising in more realistic configurations. In this context, the objective of this work is not only to understand the evolution of the sphere unstable bifurcations with Mach numbers up to supersonic speeds but also to show the capability of global stability analysis in capturing and explaining complex 3-D phenomena in the presence of shock waves and separated regions.
The paper is organized as follows. The numerical methods for DNS and linear global stability are described in §§ 2 and 3. In § 4, the quality of the DNS and time-stepping approach are assessed for the low Mach number regime through detailed comparison with the incompressible case; the regular and Hopf bifurcations are described both in terms of direct numerical simulations and global modes. The supersonic regime is investigated in § 5 to analyse the effect of the Mach number on the flow dynamics. Concluding remarks and prospects are given in § 6.
2 Problem formulation
2.1 Governing equations
The 3-D Navier–Stokes (N–S) equations for a compressible perfect gas are considered. These equations govern the evolution of the system state
 $\boldsymbol{q}=[\unicode[STIX]{x1D70C},\unicode[STIX]{x1D70C}\boldsymbol{u},\unicode[STIX]{x1D70C}E]^{\text{T}}$
in the conservative form, where
 $\unicode[STIX]{x1D70C}$
,
 $\boldsymbol{u}$
and
 $E$
are the fluid density, the velocity vector and the total energy, respectively. The governing equations can be written in the non-dimensional form as:
 $$\begin{eqnarray}\frac{\unicode[STIX]{x2202}\boldsymbol{q}}{\unicode[STIX]{x2202}t}={\mathcal{R}}(\boldsymbol{q}),\end{eqnarray}$$
where
 ${\mathcal{R}}$
is the differential nonlinear N–S operator. The explicit form of (2.1) is given in Guiho et al. (Reference Guiho, Alizard and Robinet2016).
2.2 Stability problem
Linear stability analysis assumes the existence of an equilibrium solution,
 $\boldsymbol{q}_{b}$
, for the system (2.1) referred to as the base flow and defined by
 ${\mathcal{R}}(\boldsymbol{q}_{b})=0$
. In the following, the base flow
 $\boldsymbol{q}_{b}(\boldsymbol{x})$
is assumed to be 3-D, with
 $\boldsymbol{x}=[x,y,z]^{\text{T}}$
representing the array of the streamwise, vertical and transverse directions, respectively. Using the standard small perturbation technique, the instantaneous flow is decomposed into base flow and small disturbances
 $\boldsymbol{q}(\boldsymbol{x},t)=\boldsymbol{q}_{b}(\boldsymbol{x})+\unicode[STIX]{x1D700}\boldsymbol{q}^{\prime }(\boldsymbol{x},t)$
, where
 $\unicode[STIX]{x1D700}\ll 1$
. The resulting equations are further simplified by considering that the perturbation is infinitesimal, allowing the nonlinear fluctuating terms to be neglected. Thus, the compressible N–S equations become a system of linear partial differential equations defined by
 $$\begin{eqnarray}\frac{\unicode[STIX]{x2202}\boldsymbol{q}^{\prime }}{\unicode[STIX]{x2202}t}={\mathcal{J}}\boldsymbol{q}^{\prime },\end{eqnarray}$$
where the vector
 $\boldsymbol{q}^{\prime }=[\unicode[STIX]{x1D70C}^{\prime },\unicode[STIX]{x1D70C}^{\prime }\boldsymbol{u}_{b}+\unicode[STIX]{x1D70C}_{b}\boldsymbol{u}^{\prime },\unicode[STIX]{x1D70C}^{\prime }E_{b}+\unicode[STIX]{x1D70C}_{b}E^{\prime }]^{\text{T}}$
represents the conservative perturbation variables and
 ${\mathcal{J}}=\unicode[STIX]{x2202}{\mathcal{R}}/\unicode[STIX]{x2202}\boldsymbol{q}|_{\boldsymbol{q}_{b}}$
is the Jacobian operator obtained by linearizing the N–S operator
 ${\mathcal{R}}$
around the base flow
 $\boldsymbol{q}_{b}$
(see Guiho et al.
Reference Guiho, Alizard and Robinet2016). Assuming a normal mode decomposition, the asymptotic behaviour of a small perturbation is driven by
 $\boldsymbol{q}^{\prime }(\boldsymbol{x},t)=\widehat{\boldsymbol{q}}(\boldsymbol{x})\exp (\unicode[STIX]{x1D706}t)+\text{c.c.}$
, where (
 $\widehat{\boldsymbol{q}}(\boldsymbol{x}),\unicode[STIX]{x1D706}$
) satisfies the eigenproblem
 ${\mathcal{J}}\widehat{\boldsymbol{q}}=\unicode[STIX]{x1D706}\widehat{\boldsymbol{q}}$
. By splitting the eigenvalue into its real and imaginary part
 $\unicode[STIX]{x1D706}=\unicode[STIX]{x1D70E}+\text{i}\unicode[STIX]{x1D714}$
, the equilibrium state
 $\boldsymbol{q}_{b}$
is allowed to bifurcate into another solution if the temporal amplification rate,
 $\unicode[STIX]{x1D70E}$
, of the least damped mode becomes positive (in a linear framework).
3 Numerical strategy
3.1 Phoenix code
All numerical simulations in this paper were run with an in-house solver named Phoenix (Goncalves & Houdeville Reference Goncalves2009), to compute both the linearized and the full N–S equations. The code solves the compressible N–S equations on multi-block structured grids with a finite-volume approach. Roe’s flux difference splitting scheme (Roe Reference Roe1981) is employed to obtain advective fluxes at the cell interface for all equations. The monotonic upwind scheme for conservation laws (MUSCL) approach extends the spatial accuracy to third order and, with reference to the supersonic cases, no flux limiters are used. All viscous terms are differentiated by a second-order centred scheme. For unsteady computations, the dual time-stepping method proposed by Jameson (Reference Jameson1991) is used. The derivatives with respect to the physical time are discretized using a second-order extrapolation. The boundary conditions used for the steady or unsteady nonlinear calculations (to compute both incompressible and compressible base flow solutions and unsteady cases above the Hopf bifurcation) are: no-slip velocity, adiabatic temperature and pressure extrapolation on the sphere; imposed uniform velocity
 $U_{\infty }$
at the inflow of the numerical domain; characteristic boundary conditions at the domain lateral boundaries and outflow to minimize wave reflections.
3.2 Eigenvalue resolution
The same discretization schemes used for the nonlinear N–S equations (2.1) are applied to the set of linearized equations (2.2). However, the spatial schemes as well as boundary conditions need to be adapted to comply to the linearization procedure. As suggested by Crouch et al. (Reference Crouch, Garbaruk and Magidov2007), the Roe scheme is based on the Jacobian matrix of the new flux function associated with the linearized equations. Similarly, the same boundary conditions presented in § 3.1 for the base flow calculations are linearized and used for the stability analysis. While zero-velocity perturbations are enforced on the sphere wall and domain inlet, the characteristic boundary conditions are evaluated on the base flow solution. To solve this eigenproblem a matrix-free method is used (Edwards et al.
Reference Edwards, Tuckerman, Friesner and Sorensen1994; Bagheri et al.
Reference Bagheri, Åkervik, Brandt and Henningson2009). A linear operator
 $\boldsymbol{P}=\exp (\boldsymbol{J}\unicode[STIX]{x0394}T)$
that maps
 $\boldsymbol{q}^{\prime }(t^{n+1})=\boldsymbol{P}\boldsymbol{q}^{\prime }(t^{n})$
is introduced, with
 $t^{n+1}=t^{n}+\unicode[STIX]{x0394}T$
and
 $\boldsymbol{J}$
the discrete form of
 ${\mathcal{J}}$
. In this framework, the action of the operator
 $\boldsymbol{P}$
can be approximated by a time-marching integration of the linearized N–S equations. The dominant eigenmodes of
 $\boldsymbol{P}$
are thus extracted by means of an Arnoldi algorithm (Arnoldi Reference Arnoldi1951; Lehoucq Reference Lehoucq, Sorensen and Yang1997; Barkley, Blackburn & Sherwin Reference Barkley, Blackburn and Sherwin2008) coupled to the linear solver (see Loiseau et al. (Reference Loiseau, Robinet, Cherubini and Leriche2014) and Guiho et al. (Reference Guiho, Alizard and Robinet2016)). While
 $\boldsymbol{P}$
and
 $\boldsymbol{J}$
have the same eigenfunctions, the eigenvalues of
 $\boldsymbol{J}$
are recovered through
 $\unicode[STIX]{x1D706}=\log \unicode[STIX]{x1D6EC}/\unicode[STIX]{x0394}T$
, where
 $\unicode[STIX]{x1D6EC}$
denotes an eigenvalue of
 $\boldsymbol{P}$
. The number of iterations for the Arnoldi technique (
 $N_{s}$
) and
 $\unicode[STIX]{x0394}T$
are chosen to ensure (i) convergence of the algorithm and (ii) that Nyquist criterion is satisfied. Depending on the case and with the objective to obtain a minimal eigenvalue convergence lower than
 $10^{-6}$
, the time step between two consecutive snapshots varies in the range
 $\unicode[STIX]{x0394}T=(10{-}130)\,\unicode[STIX]{x0394}t$
, with
 $\unicode[STIX]{x0394}t=0.01\times U_{\infty }/D_{s}$
,
 $D_{s}$
the diameter of the sphere and
 $U_{\infty }$
the free-stream velocity, with the dimension of the Krylov subspace in the range
 $N_{s}=(80{-}240)$
.
4 Regular and Hopf bifurcations of a nearly incompressible flow past a sphere
The numerical investigations first focus on the onset of the unstable bifurcations for a nearly incompressible flow, i.e. at
 $M=0.1$
. Several Reynolds numbers around the regular and Hopf bifurcations are considered to describe the breaking of the axisymmetry and onset of unsteadiness, respectively. As well as validating the code against experimental and numerical work present in the literature, especially against Citro et al. (Reference Citro, Siconolfi, Fabre, Giannetti and Luchini2017) for the Hopf bifurcation since a fully 3-D analysis is performed without any assumptions for the base flow, this section aims at providing a complete picture of the bifurcations in the incompressible regime and introducing the extension to the compressible one presented in the following section.
4.1 Simulation details
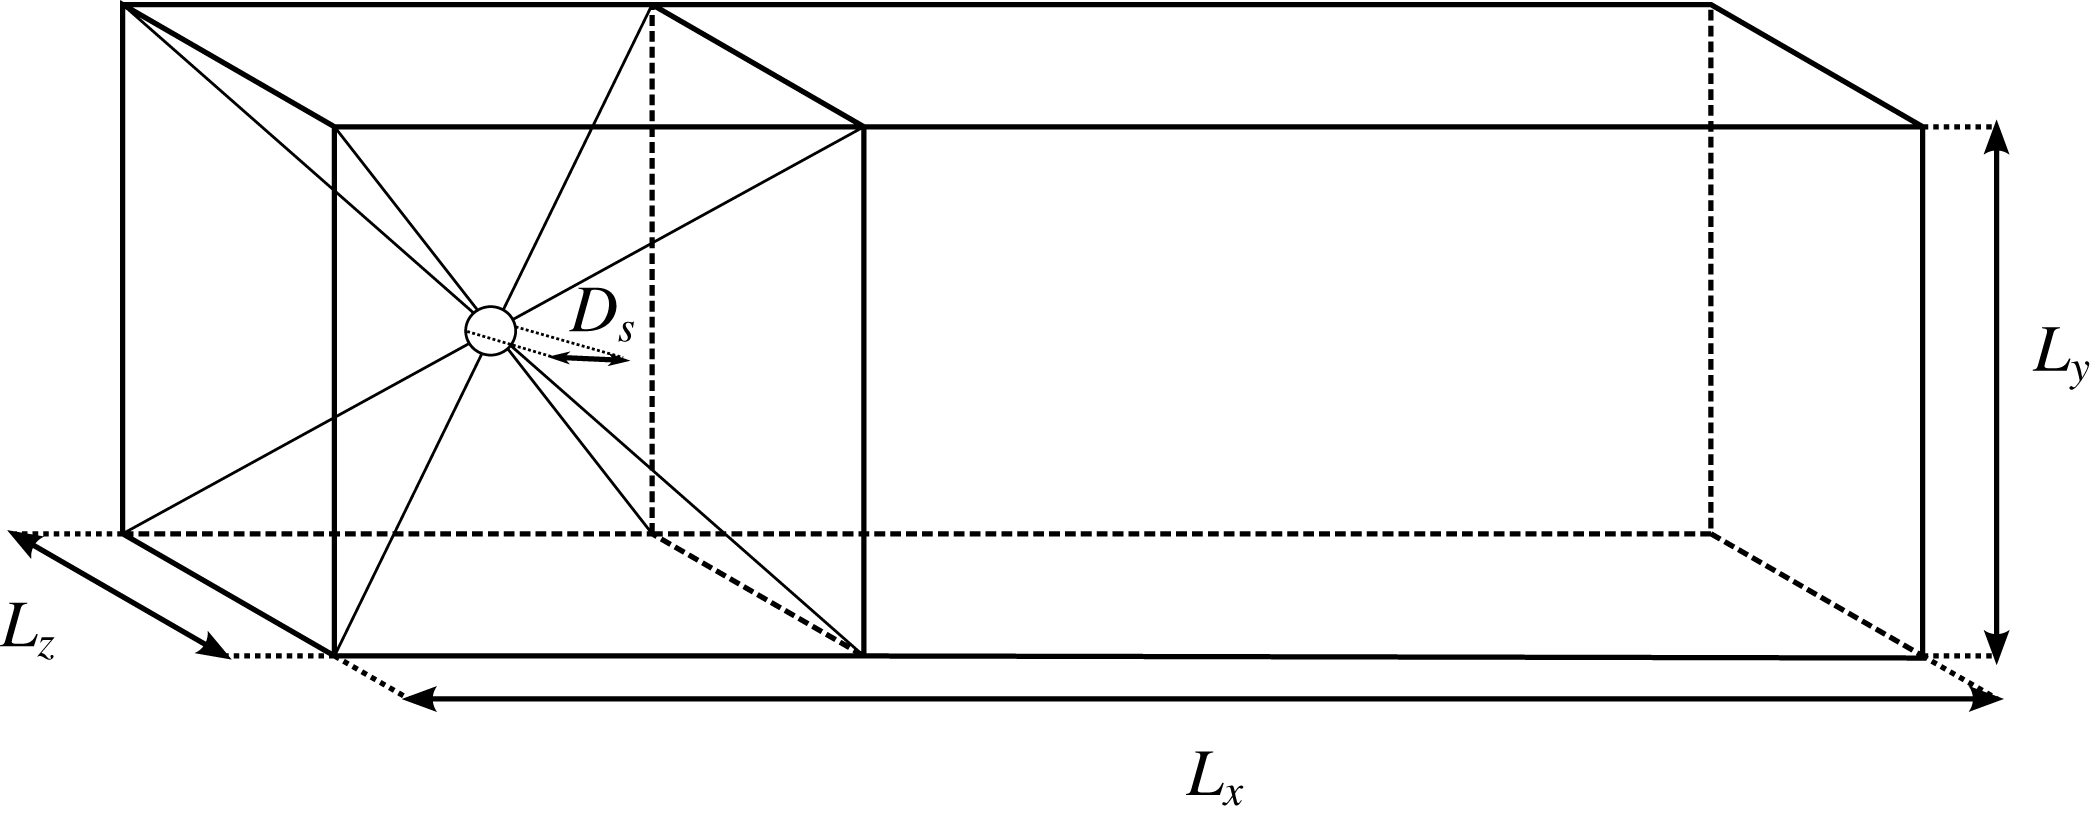
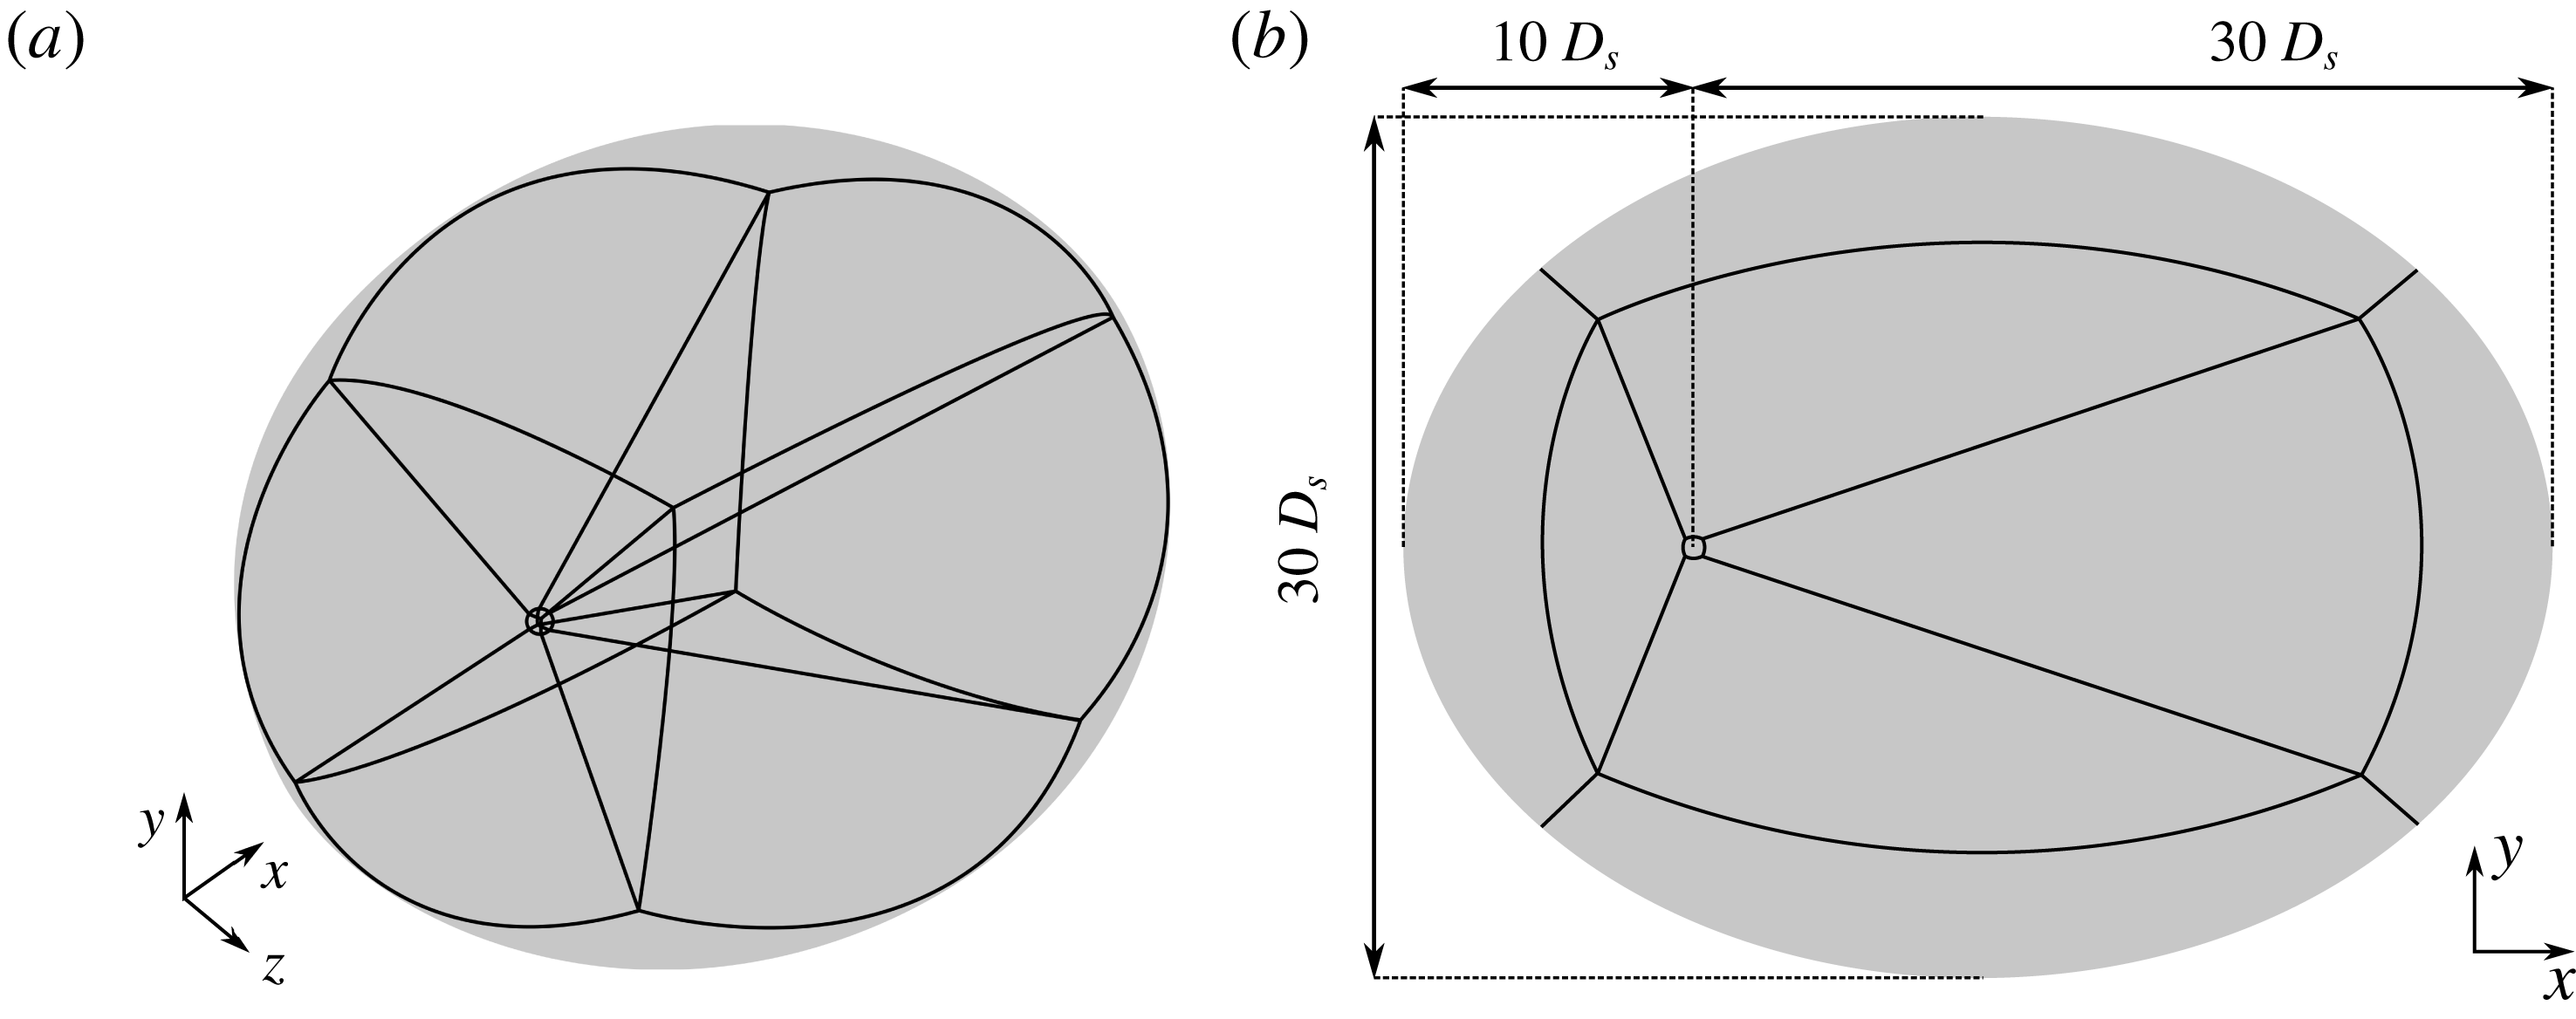
The numerical set-up is displayed in figure 1 where the domain configuration and main characteristic scales are presented. The computational domain is composed of 7 blocks and the grid resolution is selected to be
 $(n_{x},n_{y},n_{z})=(112,112,112)$
for each block. The size of the numerical domain is selected to be
 $(L_{x},L_{y},L_{z})=(20,10,10)$
. A sensitivity study on grid resolution and domain size is presented in appendix A. To avoid any downstream spurious reflection, the grid of the last block is stretched in the streamwise direction downstream of the body. The selected Reynolds numbers are
 $Re=200,210,220$
for the characterization of the regular bifurcation and
 $Re=250,260,270,280,290,300,320$
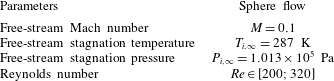
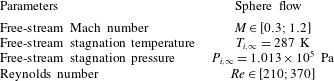
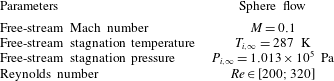
for the Hopf one. The flow conditions are given in table 1. The time and length scales are made dimensionless using
 $U_{\infty }/D_{s}$
and
 $D_{s}$
, respectively. The dimensionless frequency is defined as
 $St=\unicode[STIX]{x1D714}/2\unicode[STIX]{x03C0}$
.
Schematic representation of the computational domain.

Free-stream parameters for the nearly incompressible sphere flow calculations.
4.2 Base flow
The N–S equations are discretized by an implicit scheme and solved by a pseudo-unsteady approach (Jameson Reference Jameson1991). For all the computed base flows the Courant–Friedrichs–Lewy (CFL) number is equal to 10 and the steady solutions are converged until the residuals of the state variables in the
 $L_{2}$
-norm are lower than
 $10^{-8}$
.
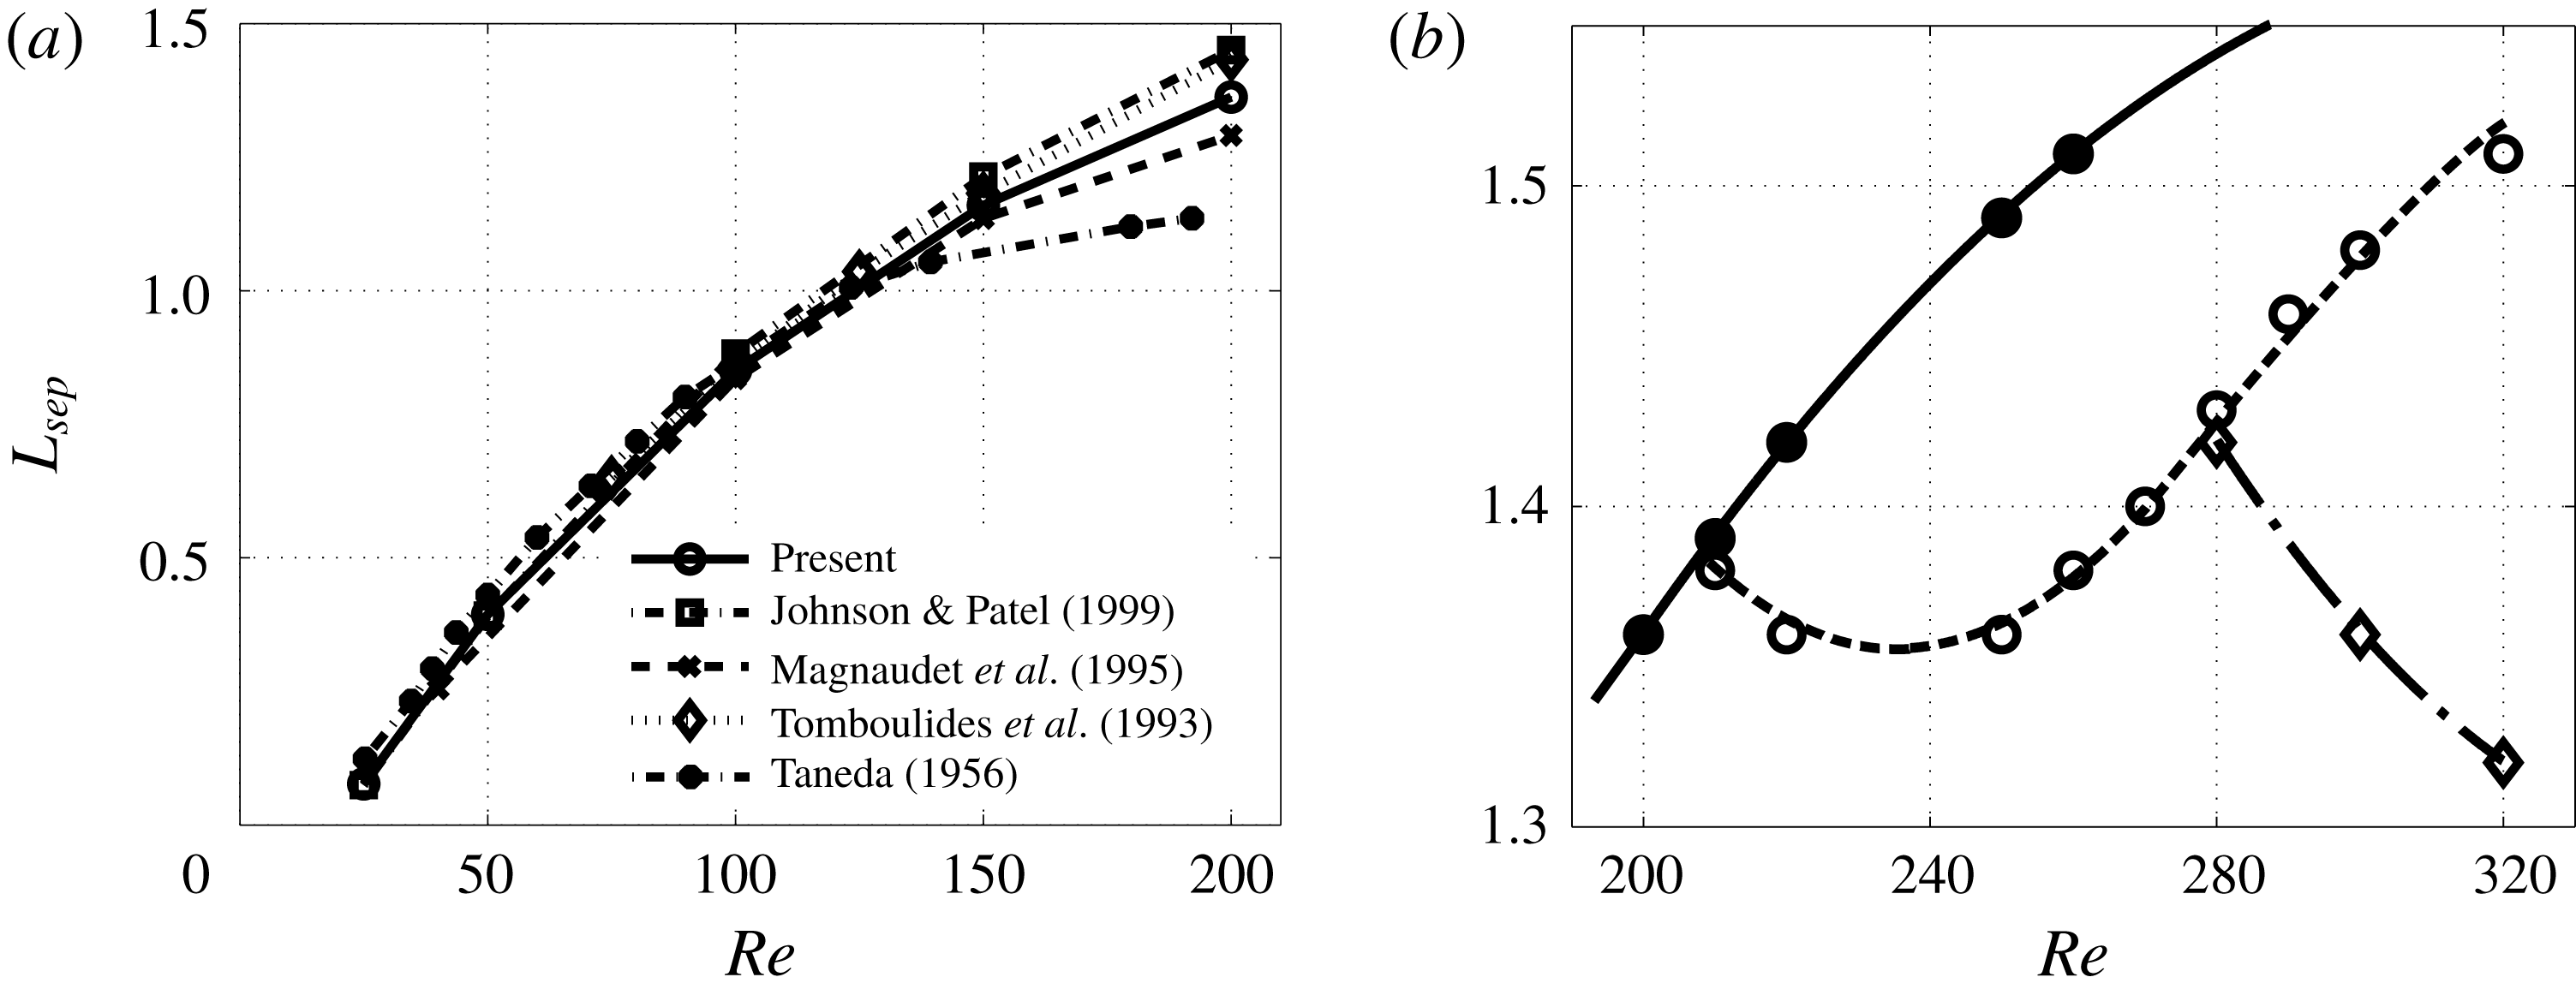
Before investigating the base flow characteristics around the two bifurcations, the evolution of the separation bubble length is compared against the results reported in Taneda (Reference Taneda1956), Tomboulides et al. (Reference Tomboulides, Orszag and Karniadakis1993), Magnaudet, Rivero & Fabre (Reference Magnaudet, Rivero and Fabre1995), Johnson & Patel (Reference Johnson and Patel1999) and Bouchet, Mebarek & Duŝek (Reference Bouchet, Mebarek and Duŝek2006) for Reynolds numbers up to
 $Re=200$
(figure 2
a). Good agreement is shown between the present and aforementioned results and only (globally stable) steady axisymmetric solutions exist.
(a) The separation length
 $L_{sep}$
is plotted as a function of the Reynolds number up to
 $Re=200$
and compared against both numerical simulations and experiments. (b) Separation lengths around the two unstable bifurcations for steady axisymmetric (full circles), steady planar-symmetric (empty circles) and time-averaged planar-symmetric (empty diamonds) solutions.
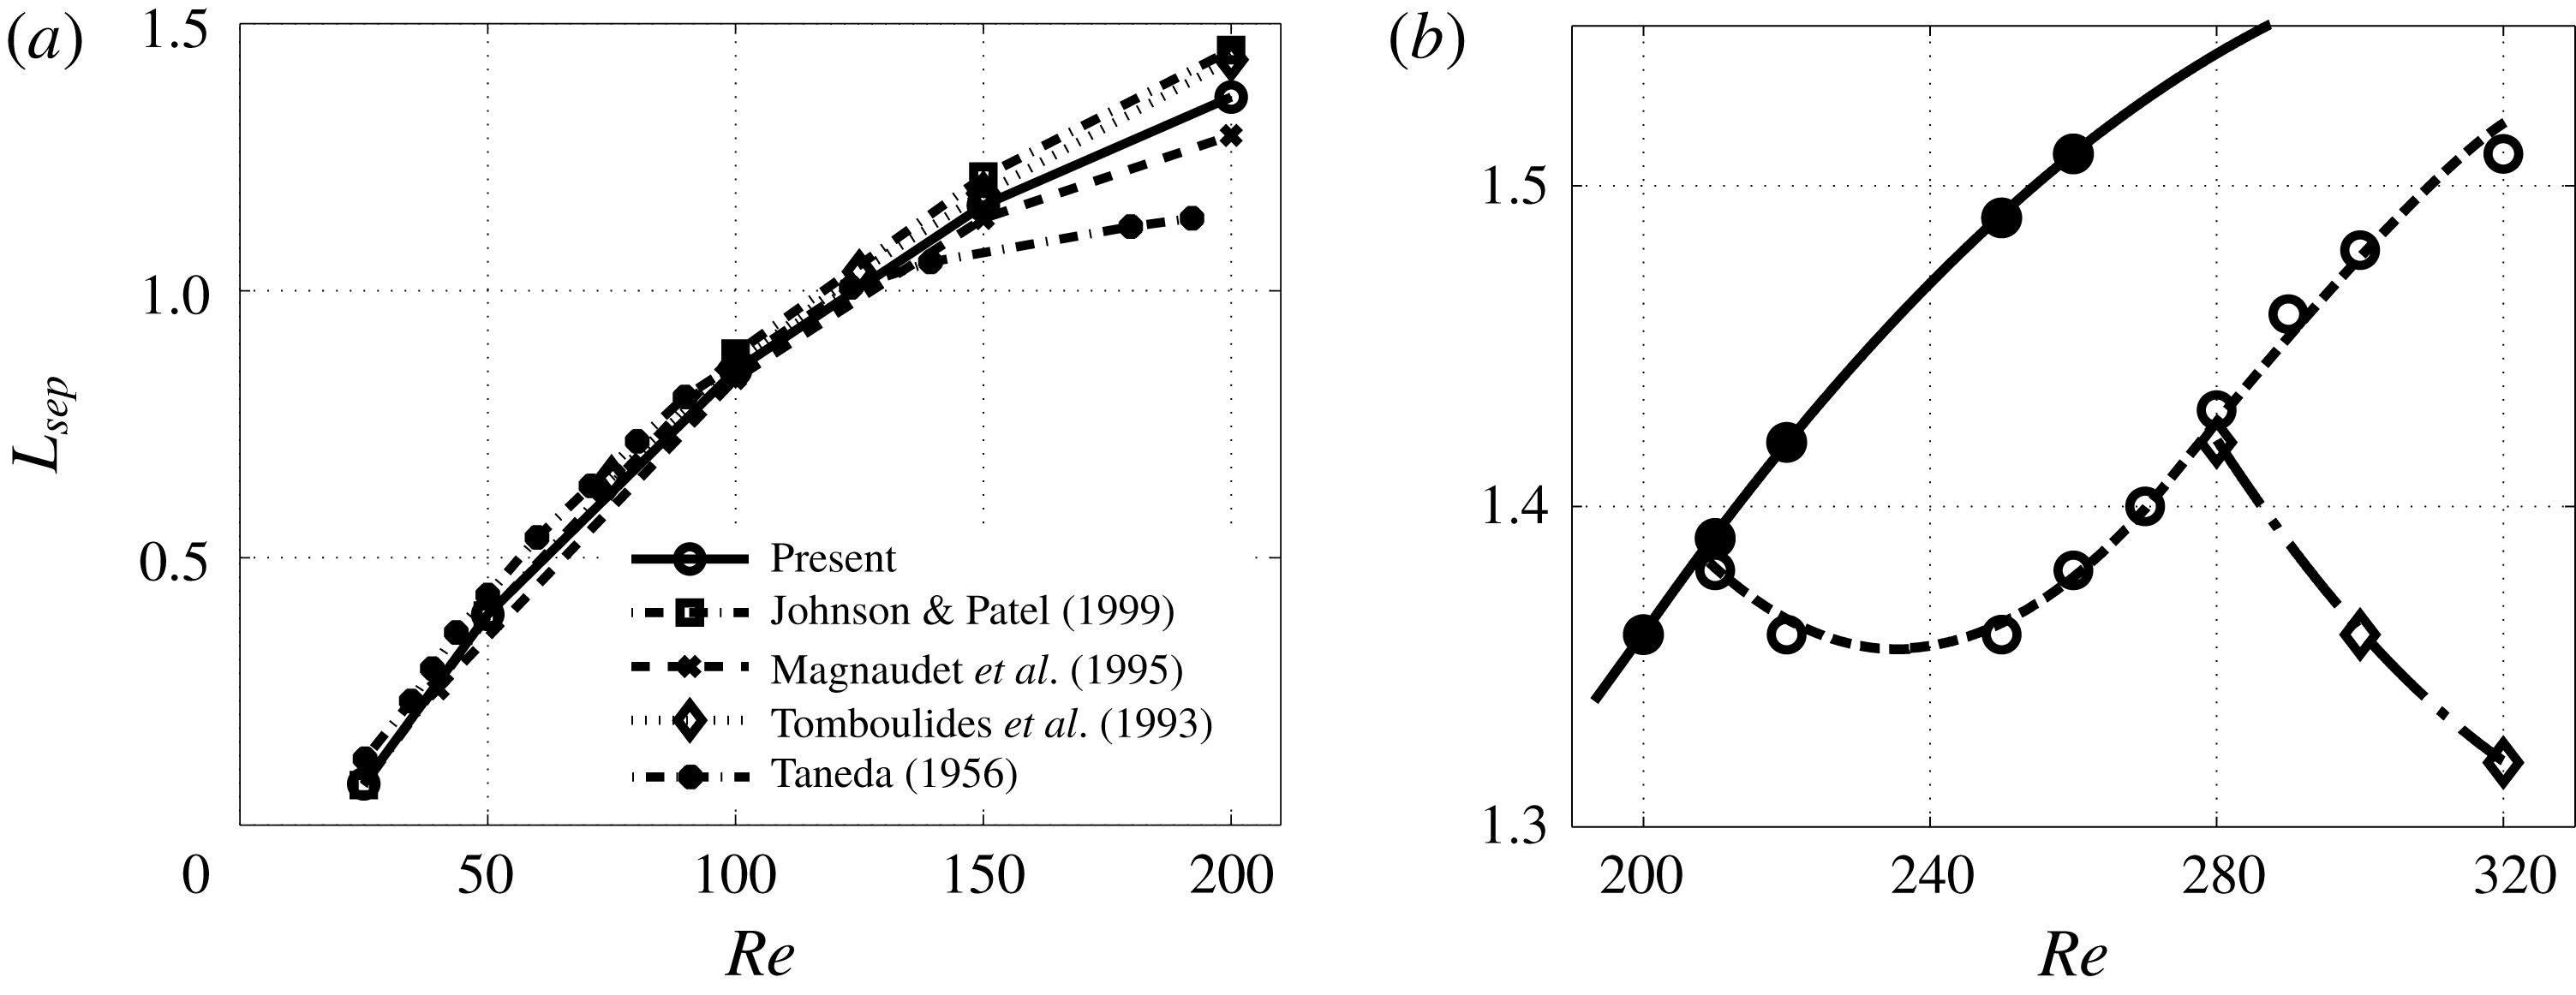
Similarly to Bouchet et al. (Reference Bouchet, Mebarek and Duŝek2006), the calculated separation lengths associated with the Reynolds numbers around the two bifurcations are plotted in figure 2(b).
Above
 $Re=210$
, an implicit method is used (Lomax & Steger Reference Lomax and Steger1975) where steady axisymmetric flows (full circles fitted by a solid line) are obtained by starting from a very well converged axisymmetric solution (with the residuals of the state variables in the
 $L_{2}$
-norm below
 $10^{-8}$
) and progressively increasing the Reynolds number. Thus, the solution quickly converges to an axisymmetric one with a longer separation region. However, this strategy does not allow us to calculate well converged solutions far from the threshold of the regular bifurcation and axisymmetric flows could only be obtained up to
 $Re=260$
with this method. These solutions constitute unstable fix points that, through a regular bifurcation, cause the steady wake behind the sphere to become planar-symmetric and are selected to study the evolution of the regular bifurcation with the Reynolds number in § 4.3.
Different methods, such as the Newton–Krylov (Edwards et al.
Reference Edwards, Tuckerman, Friesner and Sorensen1994) or selective frequency damping method (Åkervik et al.
Reference Åkervik, Brandt, Henningson, Hoefpffner, Marxen and Schlatter2006), can be used to obtain the equilibrium solution of the system in (2.1) when unsteady solutions exist above the secondary Hopf bifurcation. However, the implicit scheme combined to a pseudo-unsteady approach at high CFL number used in the present study allows us to filter the unsteadiness and obtain converged steady fixed points. Above the regular bifurcation, the steady wake behind the sphere becomes planar-symmetric and the corresponding length, averaged in the azimuthal direction, is represented by empty circles and fitted by a dashed line. These flows represent nonlinearly saturated solutions with respect to the regular bifurcation and for
 $Re>270$
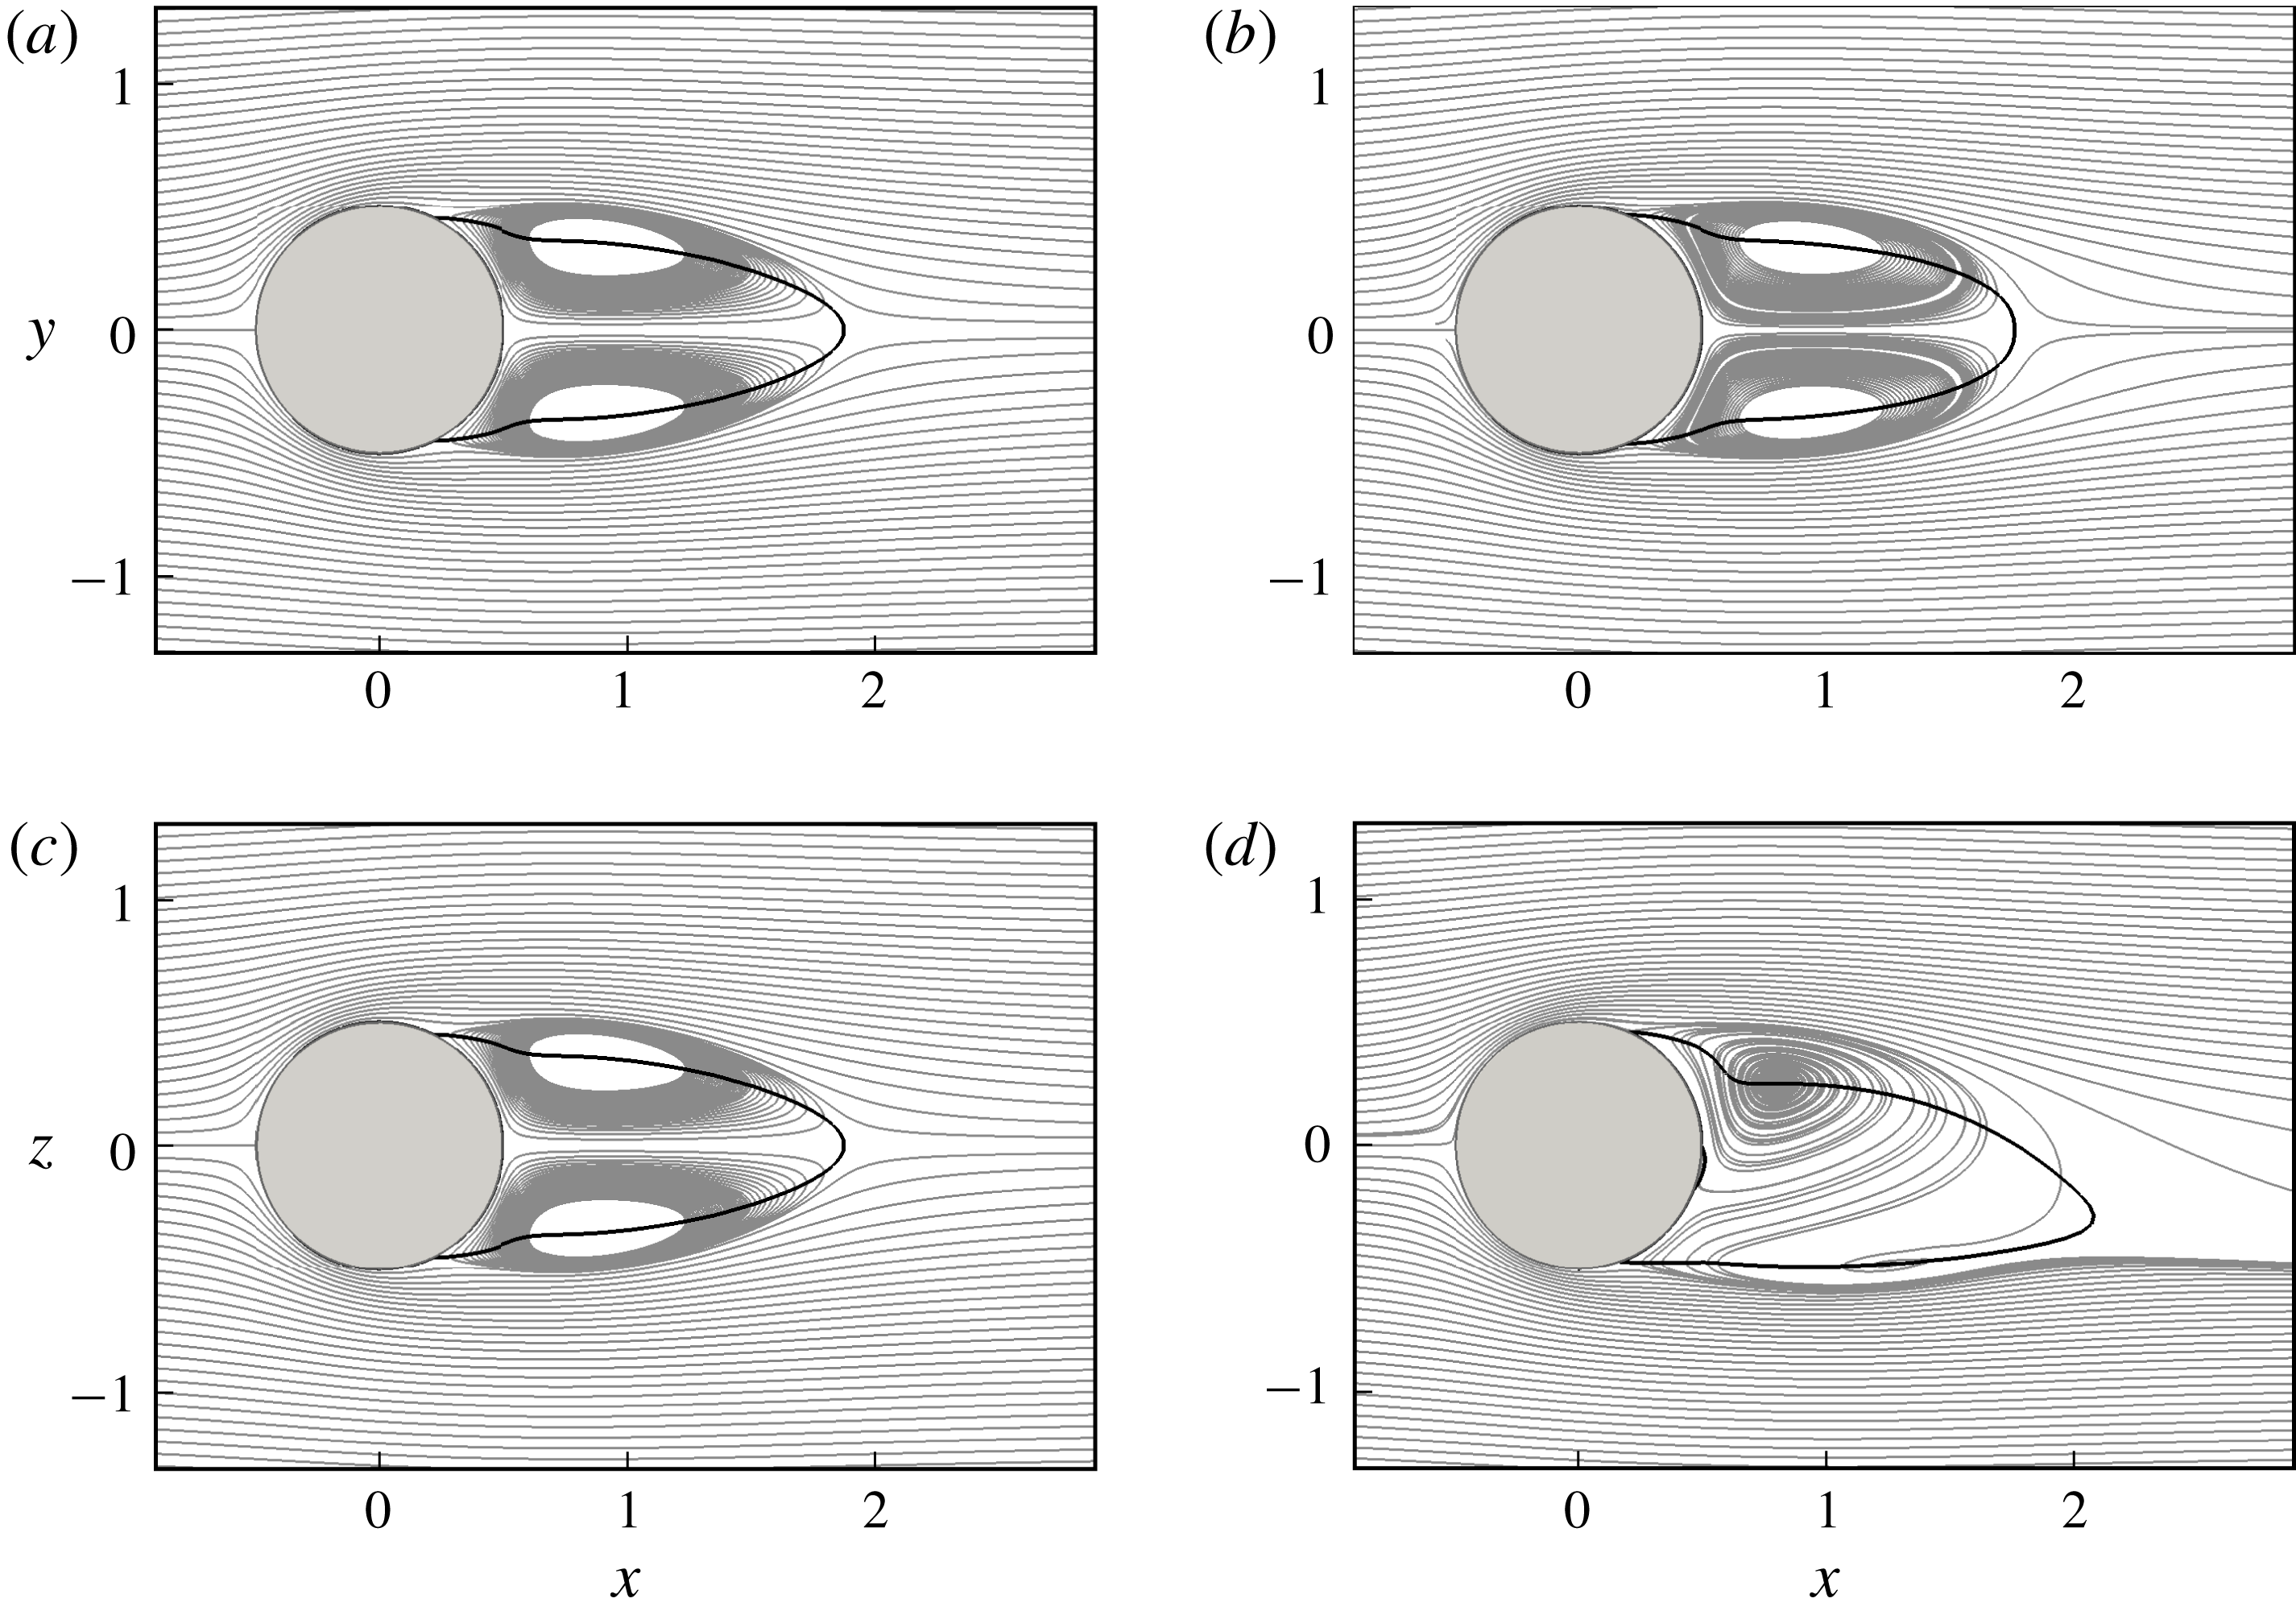
constitute unstable fix points that become unsteady through a supercritical Hopf bifurcation. Differently from previous studies that relied on the assumption of axisymmetric base flow for the linear stability analysis, these 3-D planar-symmetric base flows are selected to study the evolution of the secondary Hopf bifurcation in § 4.4, as done by Citro et al. (Reference Citro, Siconolfi, Fabre, Giannetti and Luchini2017). The breaking of the axisymmetry of the base flow solution can be better appreciated in figure 3, where the projections of the 3-D streamlines in the
 $x$
–
 $y$
(figure 3
a,b) and
 $x$
–
 $z$
(figure 3
c,d) planes are shown for the
 $Re=210$
(figure 3
a,c) and
 $Re=280$
(figure 3
b,d) cases. The solid black lines indicate the separation region by plotting the contours of the zero-streamwise velocity. While the flow is axisymmetric at
 $Re=210$
, planar symmetry can be observed for the
 $Re=280$
case. Around the secondary Hopf bifurcation, the flow remains symmetric in the
 $x$
–
 $y$
plane but the streamlines in the
 $x$
–
 $z$
plane spiral asymmetrically downstream of the body and the corresponding wake results slightly bent. These observations are in full agreement with the DNS results provided by Johnson & Patel (Reference Johnson and Patel1999) for subcritical Reynolds numbers.
Three-dimensional streamlines projected onto (a,b)
 $x$
–
 $y$
and (c,d)
 $x$
–
 $z$
planes for the (a,c)
 $Re=210$
and (b,d)
 $Re=280$
cases. The separated region is indicated by the solid black line.

Unsteady nonlinear calculations are performed for
 $Re=280,300$
and 320. Above the supercritical Hopf bifurcation, the flow becomes unsteady and self-sustained hairpin vortices are shed behind the sphere. This solution is time averaged (32 samples in one period at saturation) and a mean flow field is obtained. Although not a fixed point of the system under consideration and mathematically not sound, this solution is used as a base flow in § 4.5 to address the issue concerning the correctness of the global stability performed on a fixed point solution in predicting the shedding frequency (Barkley Reference Barkley2006). The size of the recirculation region of the mean flow solution is calculated by further averaging in the azimuthal direction and is represented in figure 2(b) with empty diamonds fitted by a dash-dotted line.
4.3 Regular bifurcation
To study the regular bifurcation, several stability analyses are carried out at
 $Re=200,210$
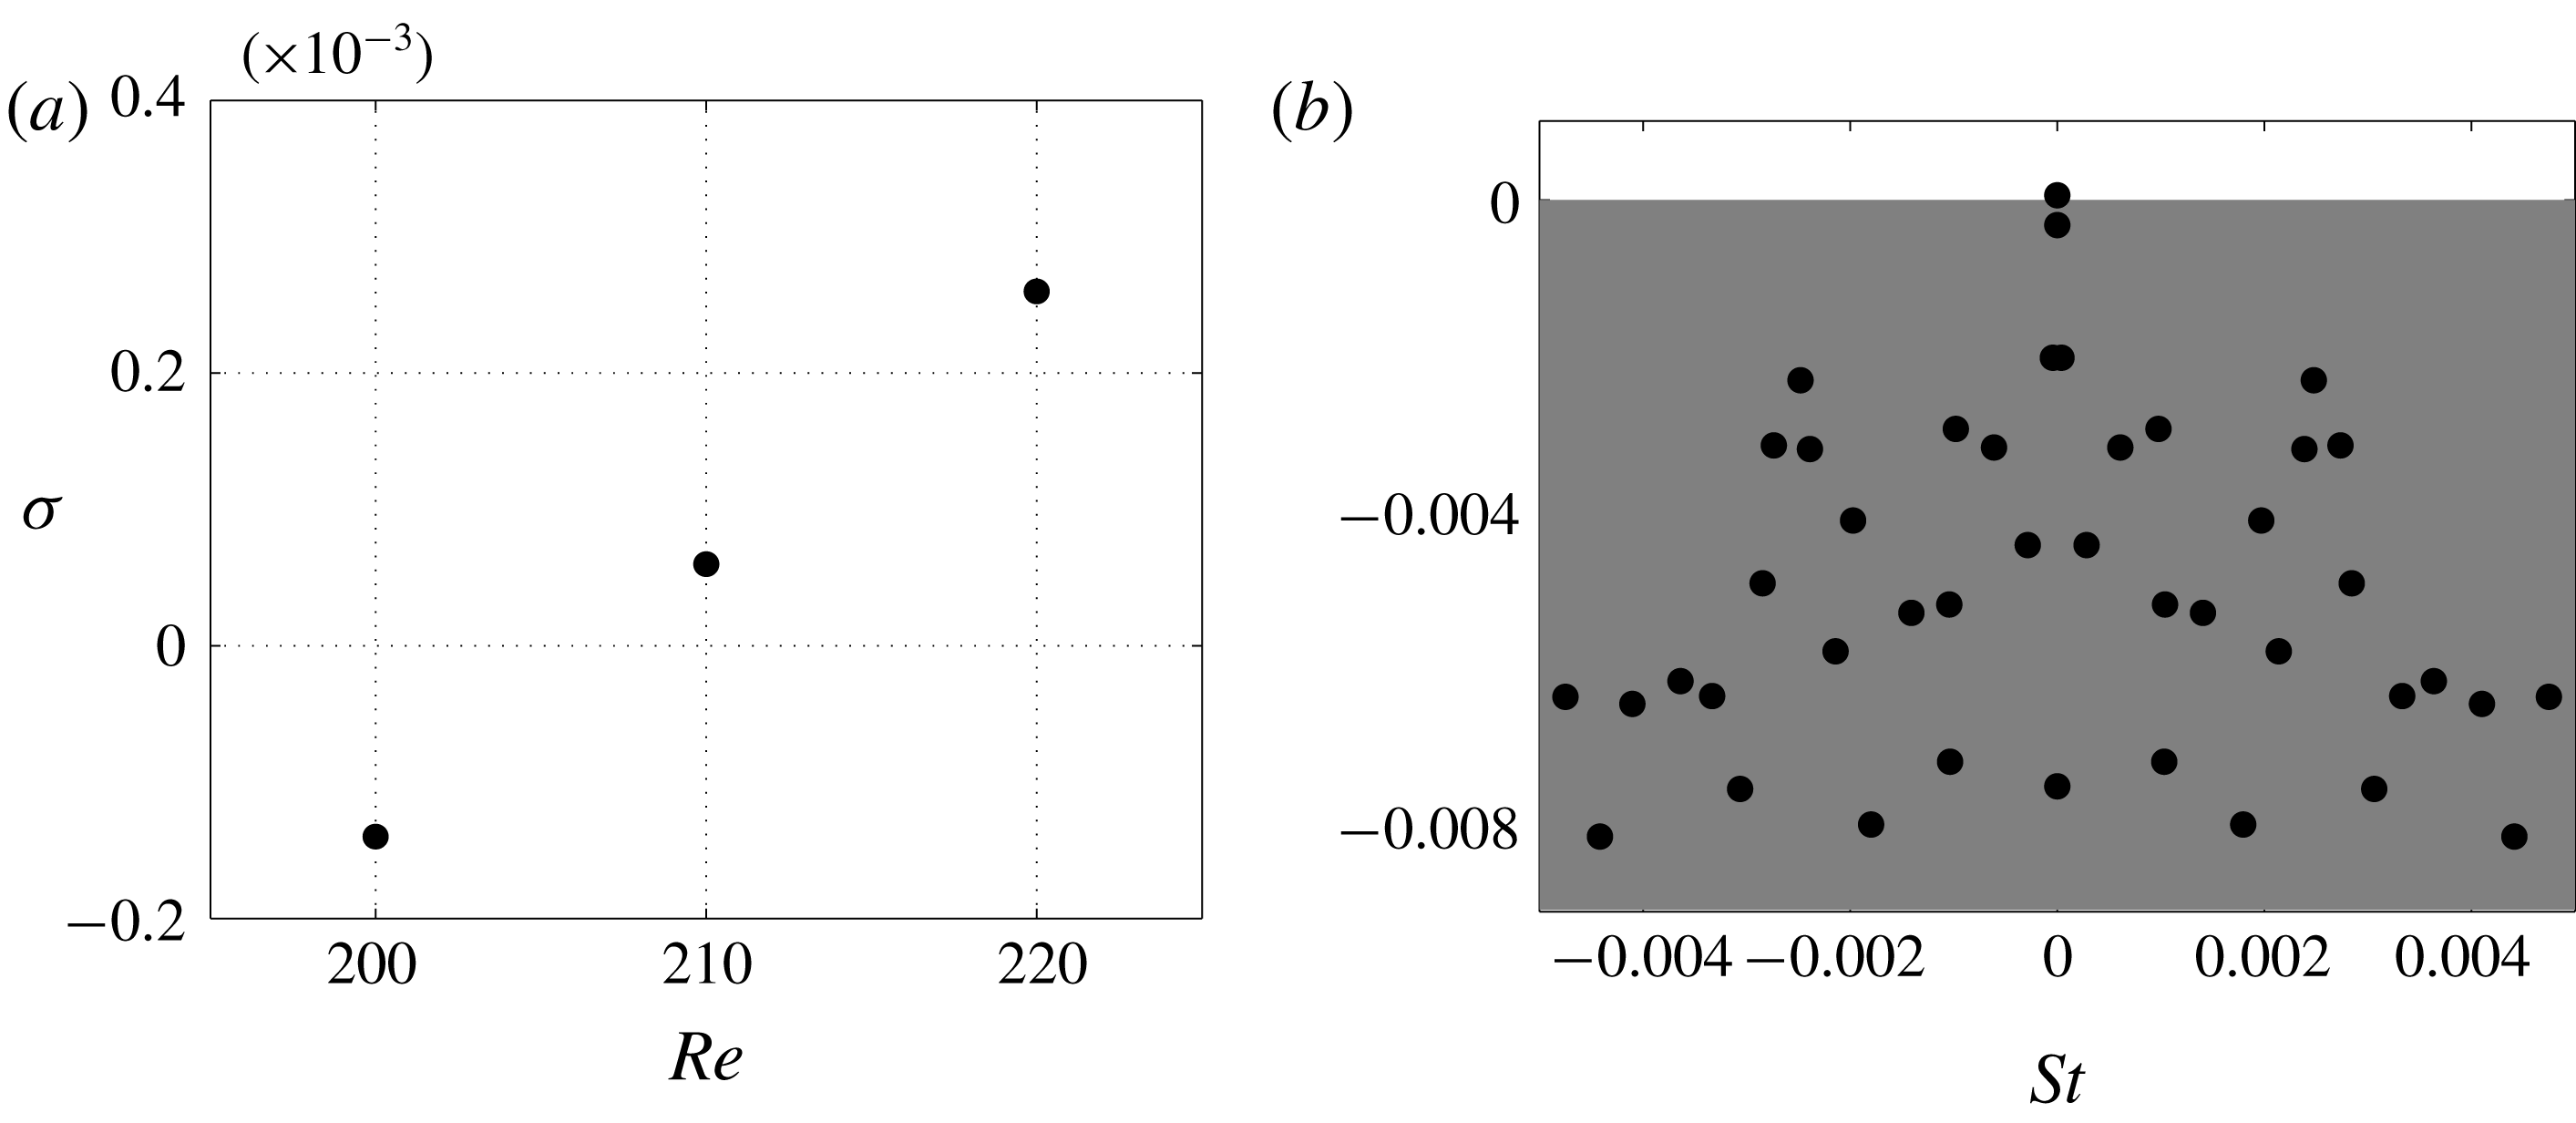
and 220. The resulting temporal amplification rate distribution as a function of the Reynolds number in figure 4(a) shows that the axisymmetric base flow is unstable for Reynolds number
 $Re=210$
. Small differences of within 5 % are found with respect to the work of Tomboulides & Orszag (Reference Tomboulides and Orszag2000), Fabre et al. (Reference Fabre, Auguste and Magnaudet2008) and Meliga, Sipp & Chomaz (Reference Meliga, Sipp and Chomaz2009) who found the critical value to vary between 210 and 212 (see appendix A). The eigenvalue spectrum for the case at
 $Re=210$
is shown in figure 4(b), where the positive growth rate at
 $St=0$
indicates that the corresponding base flow has become unstable and a non-oscillatory mode is temporally amplified.
Regular bifurcation: (a) temporal amplification rate versus the Reynolds number for the least temporally damped/most temporally amplified non-oscillatory global mode; (b) flow case at
 $Re=210$
; eigenspectrum in the
 $St$
–
 $\unicode[STIX]{x1D70E}$
plane.

To better appreciate the azimuthal character of the eigenfunctions and to directly compare with Natarajan & Acrivos (Reference Natarajan and Acrivos1993), Tomboulides & Orszag (Reference Tomboulides and Orszag2000) and Tezuka & Suzuki (Reference Tezuka and Suzuki2006), a transformation of coordinates – from Cartesian
 $(x,y,z)$
to cylindrical
 $(x,r,\unicode[STIX]{x1D703})$
– has been applied to transform the streamwise, vertical and transversal
 $(u^{\prime },v^{\prime },w^{\prime })$
perturbation velocities into streamwise, radial and azimuthal
 $(v_{x}^{\prime },v_{r}^{\prime },v_{\unicode[STIX]{x1D703}}^{\prime })$
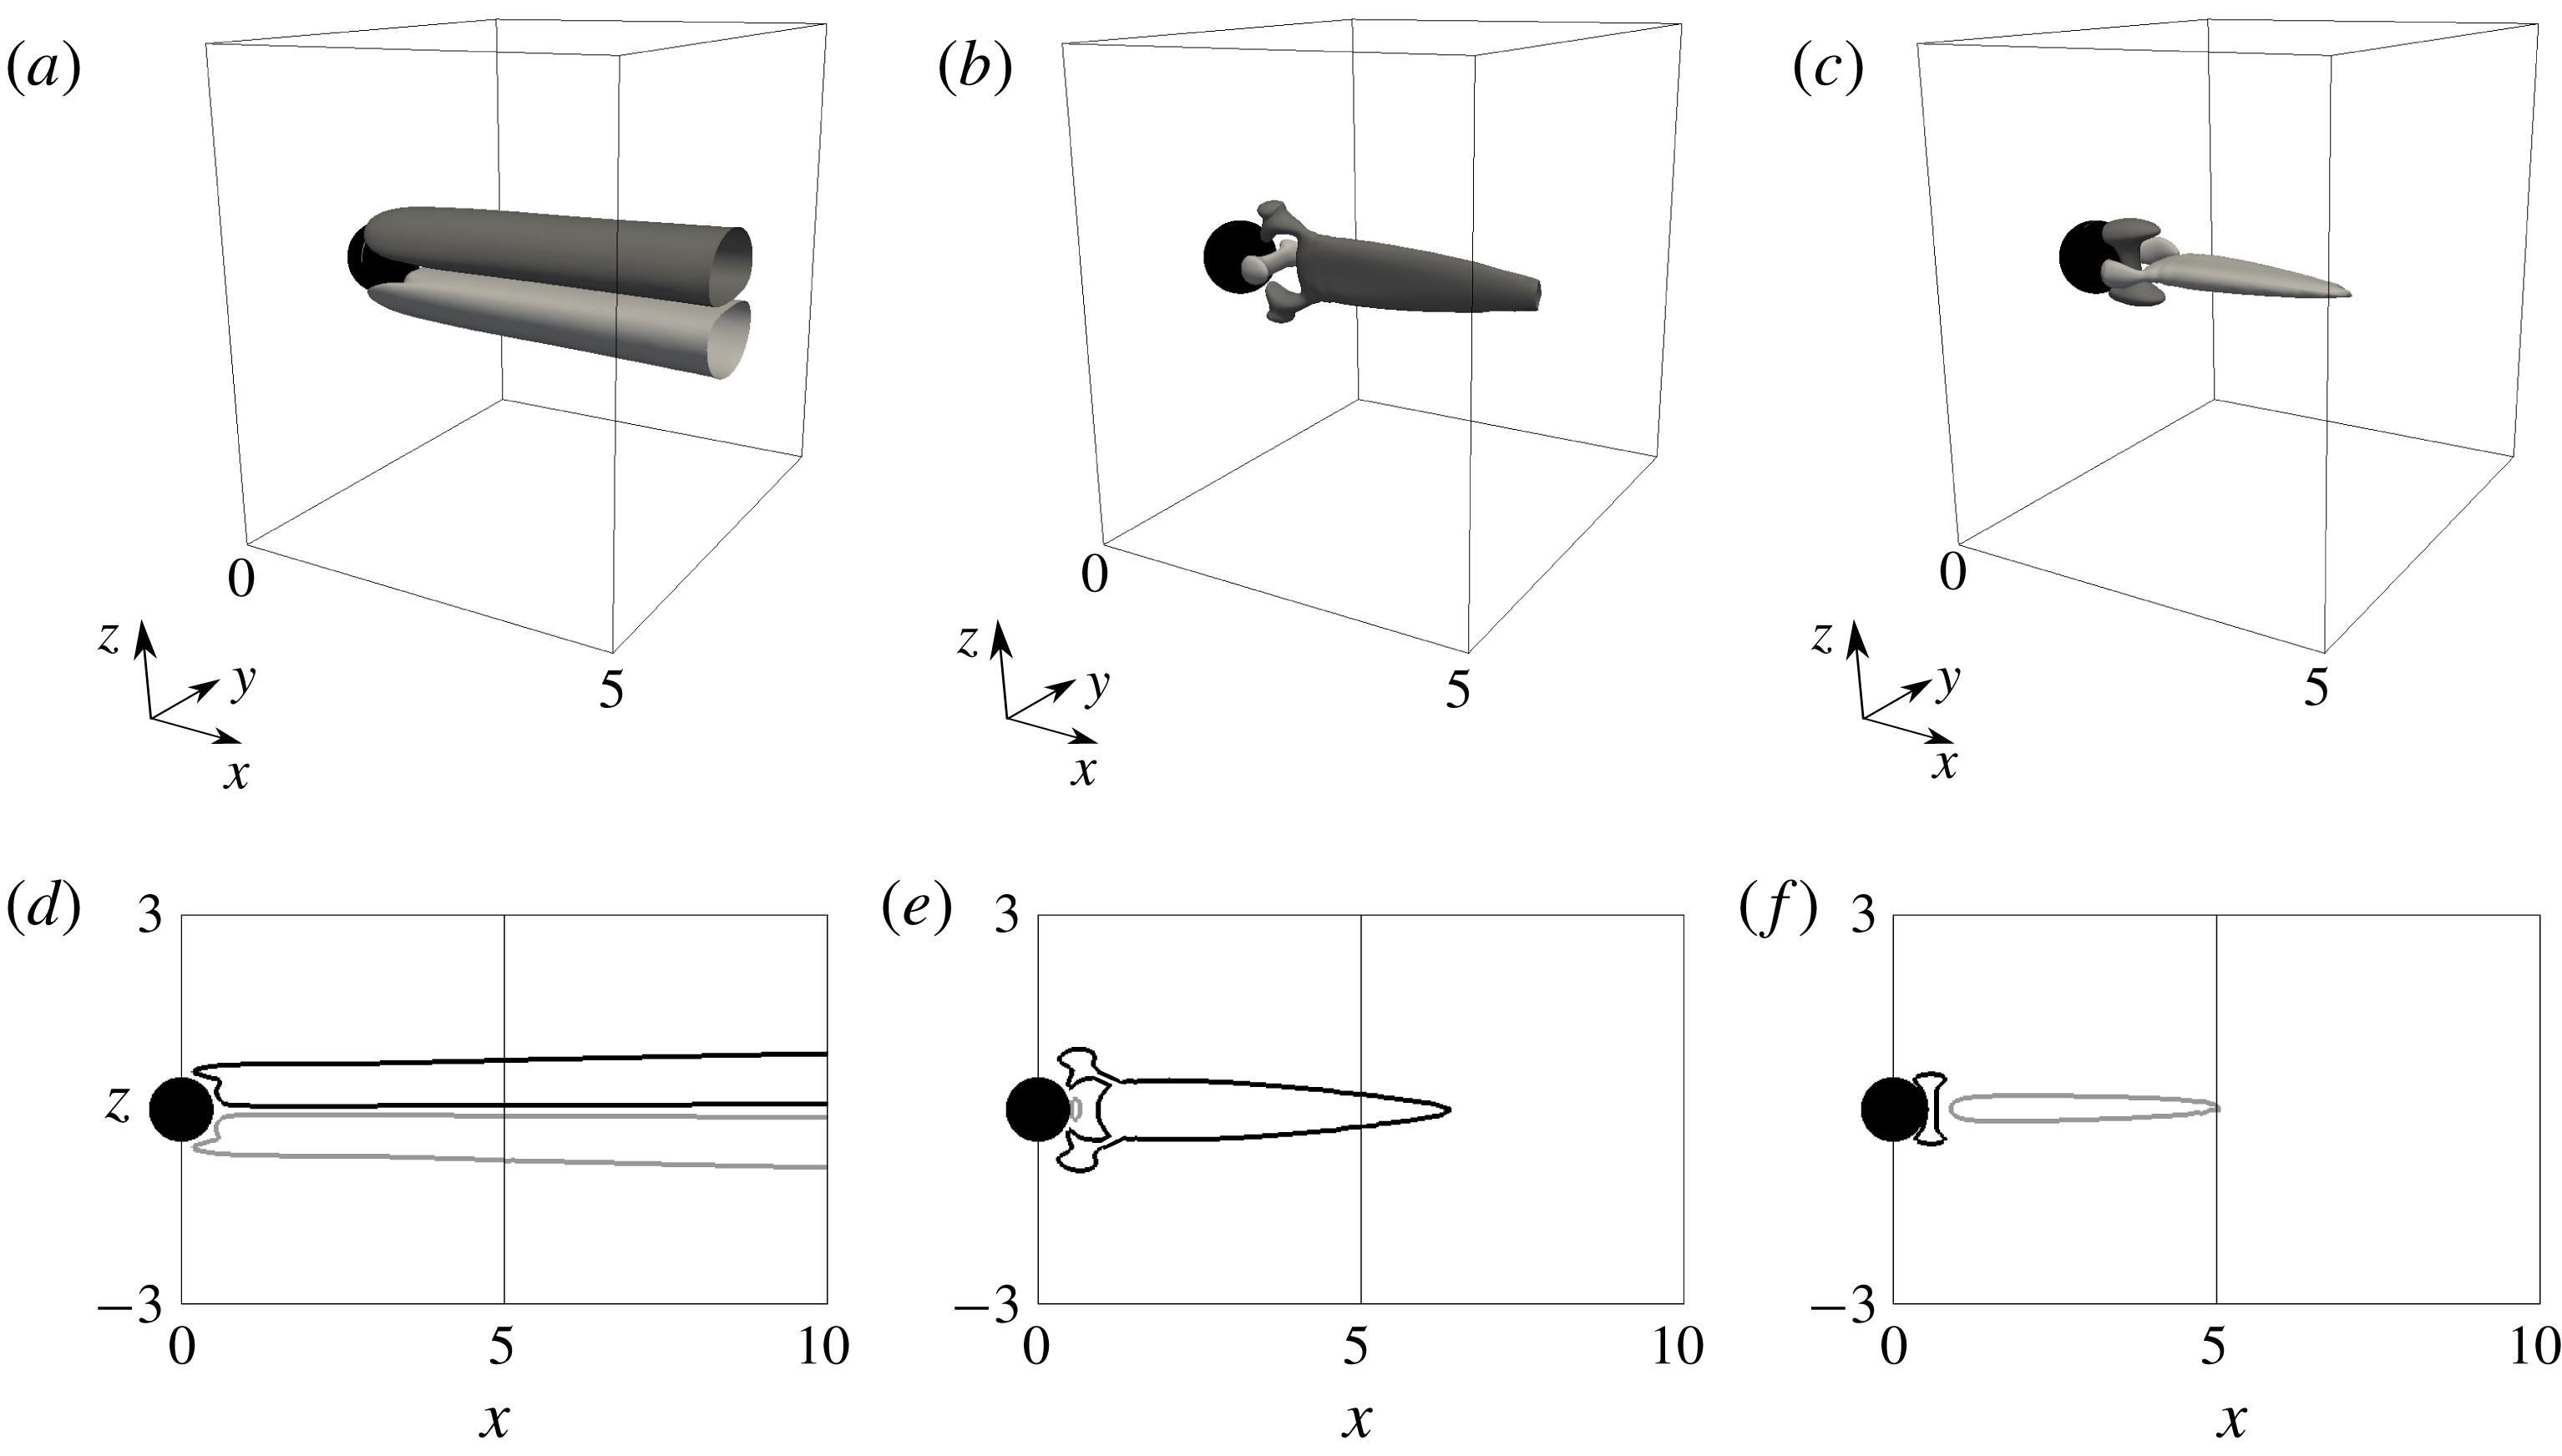
ones. Figure 5 shows the iso-surfaces (figure 5
a–c) and the projected contours onto 2-D
 $x$
–
 $z$
planes (figure 5
d–f) of the components of the perturbation velocity field (normalized by the maximum of the streamwise velocity component) in the streamwise, radial and azimuthal coordinates associated with this mode. Although in our analysis the hypothesis of axisymmetric base flow is not assumed, the figure shows good agreement with the least stable (
 $m=1$
) mode shape reported by Natarajan & Acrivos (Reference Natarajan and Acrivos1993), Tomboulides & Orszag (Reference Tomboulides and Orszag2000), Tezuka & Suzuki (Reference Tezuka and Suzuki2006) and many other authors who adopted a Fourier mode decomposition as
 $\boldsymbol{q}=\sum _{m=0}^{M-1}\boldsymbol{q}_{m}(x,r,t)\text{e}^{\text{i}m\unicode[STIX]{x1D703}}$
, with
 $x$
,
 $r$
and
 $\unicode[STIX]{x1D703}$
the streamwise, radial and azimuthal components. The stationary mode is seen to be dominated by the streamwise velocity disturbances that are located downstream of the sphere and extend up to
 ${\approx}20D_{s}$
. Since the selection of the plane where the symmetry breaks is equiprobable, the anti-symmetry plane of the eigenmode structures has been rotated to match the
 $x$
–
 $y$
plane.
Flow case at
 $Re=210$
for the unstable axisymmetric base flow. Three-dimensional view of the mode at
 $(\unicode[STIX]{x1D70E},St)=(0.683\times 10^{-4},0.0)$
. The iso-surfaces of the (a) streamwise, (b) radial and (c) azimuthal perturbation velocities are plotted for the levels
 $v_{x}^{\prime }=\pm 0.01$
,
 $v_{r}^{\prime }=\pm 0.01$
and
 $v_{\unicode[STIX]{x1D703}}^{\prime }=\pm 0.005$
, respectively. The contours of the (d) streamwise, (e) radial and (f) azimuthal perturbation velocities are plotted on the
 $x$
–
 $z$
plane for the levels
 $v_{x}^{\prime }=\pm 0.01$
,
 $v_{r}^{\prime }=\pm 0.01$
and
 $v_{\unicode[STIX]{x1D703}}^{\prime }=\pm 0.005$
, respectively. Light and dark grey colours for positive and negative perturbation velocities, respectively. The sphere is represented in black.

4.4 Supercritical Hopf bifurcation
The characterization of the supercritical Hopf bifurcation is done by carrying out several linear stability analyses around
 $Re=280$
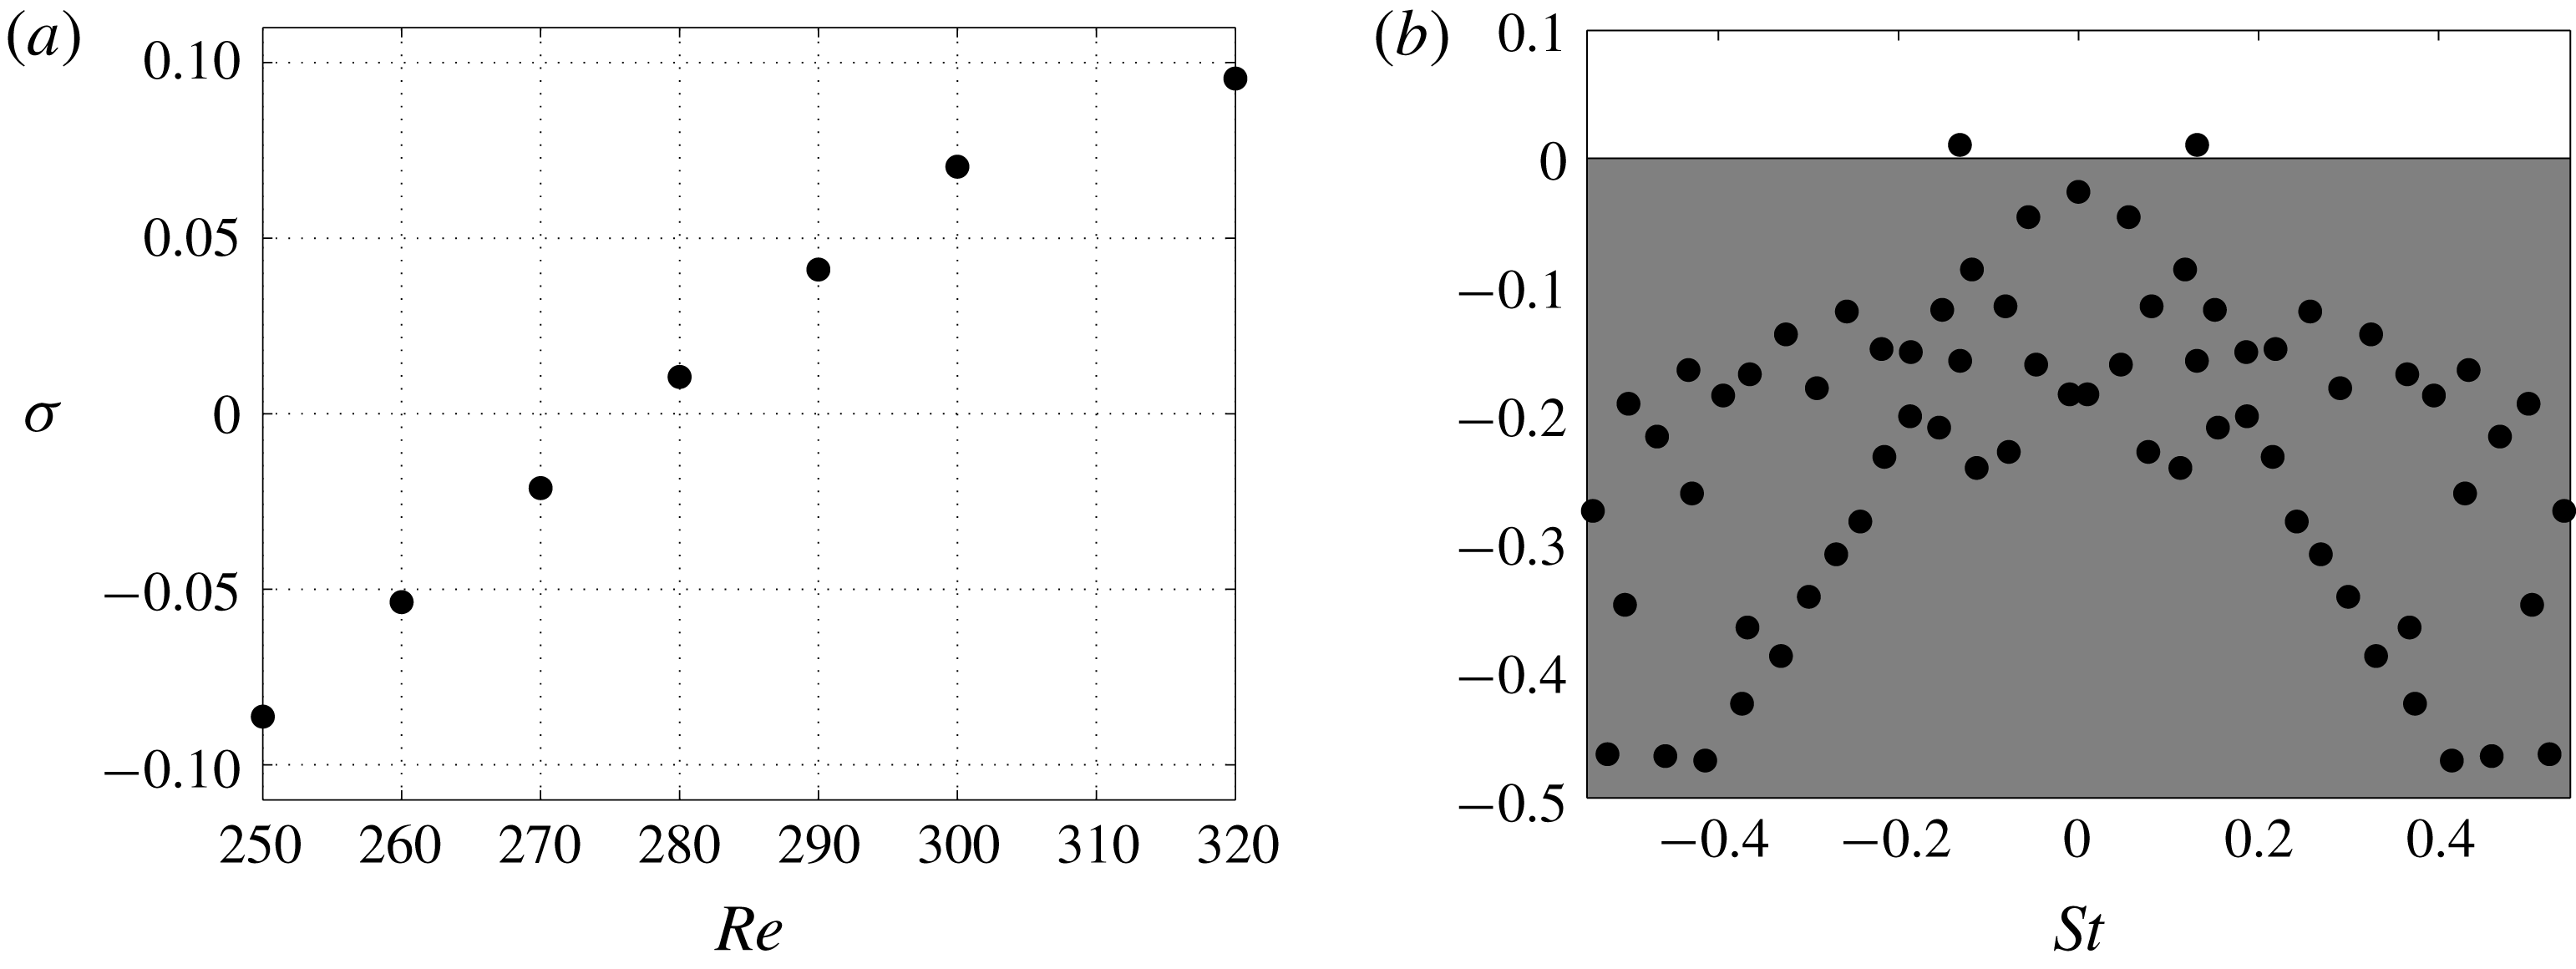
. It is important to recall that the base flows selected for this analysis are 3-D planar-symmetric solutions and represent unstable fixed points above the secondary Hopf bifurcation. Figure 6(a) reports the evolution of the temporal amplification rate as a function of the Reynolds number and shows that the transition to a time-dependent flow occurs between
 $Re=270$
and 280, consistently with what found experimentally by Ormières & Provansal (Reference Ormières and Provansal1999) and Schouveiler & Provansal (Reference Schouveiler and Provansal2002) (
 $Re_{c}^{(2)}\approx 280$
) and via DNS by Johnson & Patel (Reference Johnson and Patel1999), Tomboulides & Orszag (Reference Tomboulides and Orszag2000), Pier (Reference Pier2008) (
 $Re_{c}^{(2)}\approx 270$
–272). The eigenspectrum at
 $Re=280$
is presented in figure 6(b) and shows that, while the steady mode is temporally damped, a pair of complex conjugate oscillating eigenmodes of dimensionless frequency
 $St=0.132$
is seen to cross the upper unstable half-plane. The frequency of the latter modes agrees with the Strouhal number
 $St\approx 0.13$
obtained via DNS by Tomboulides & Orszag (Reference Tomboulides and Orszag2000) and experimentally by Schouveiler & Provansal (Reference Schouveiler and Provansal2002).
Secondary Hopf bifurcation: (a) temporal amplification rate versus the Reynolds number for the least temporally damped/most temporally amplified global mode; (b) flow case at
 $Re=280$
; eigenspectrum in the
 $St$
–
 $\unicode[STIX]{x1D70E}$
plane.

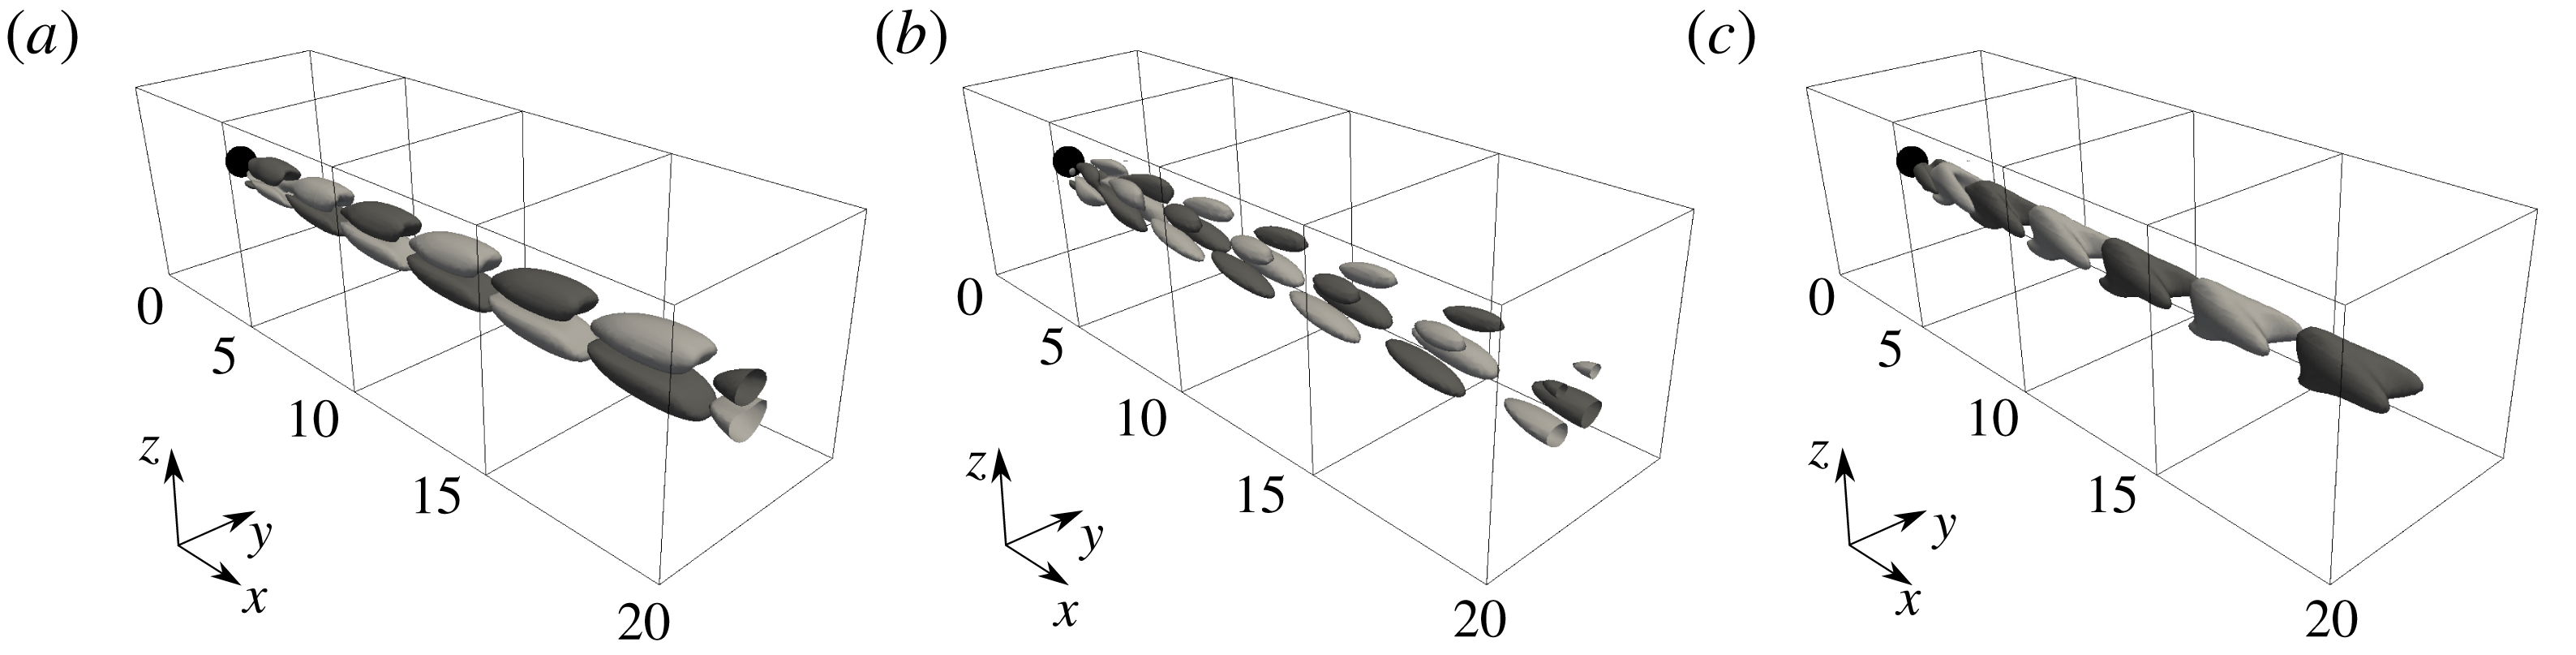
The global mode at
 $(\unicode[STIX]{x1D70E},St)=(0.0105,0.1317)$
associated with the unstable planar-symmetric base flow at
 $Re=280$
is visualized by plotting the corresponding iso-surfaces of the streamwise, vertical and transverse perturbation velocities in figure 7. The unstable eigenmode exhibits a symmetric pattern with respect to the
 $x$
–
 $z$
centre plane. This is seen to be associated with a vortical motion with a more compact shape than that of the steady mode observed for the regular bifurcation, where its perturbation velocities are almost of the same order.
Flow case at
 $Re=280$
for the unstable planar-symmetric base flow. Three-dimensional view of the mode at
 $(\unicode[STIX]{x1D70E},St)=(0.0105,0.1317)$
. The iso-surfaces of the (a) streamwise, (b) vertical and (c) transverse perturbation velocities are plotted for the levels
 $u^{\prime }=\pm 0.25$
,
 $v^{\prime }=\pm 0.15$
and
 $w^{\prime }=\pm 0.25$
, respectively. Light and dark grey iso-surfaces for positive and negative perturbation velocities, respectively. The sphere is represented in black.

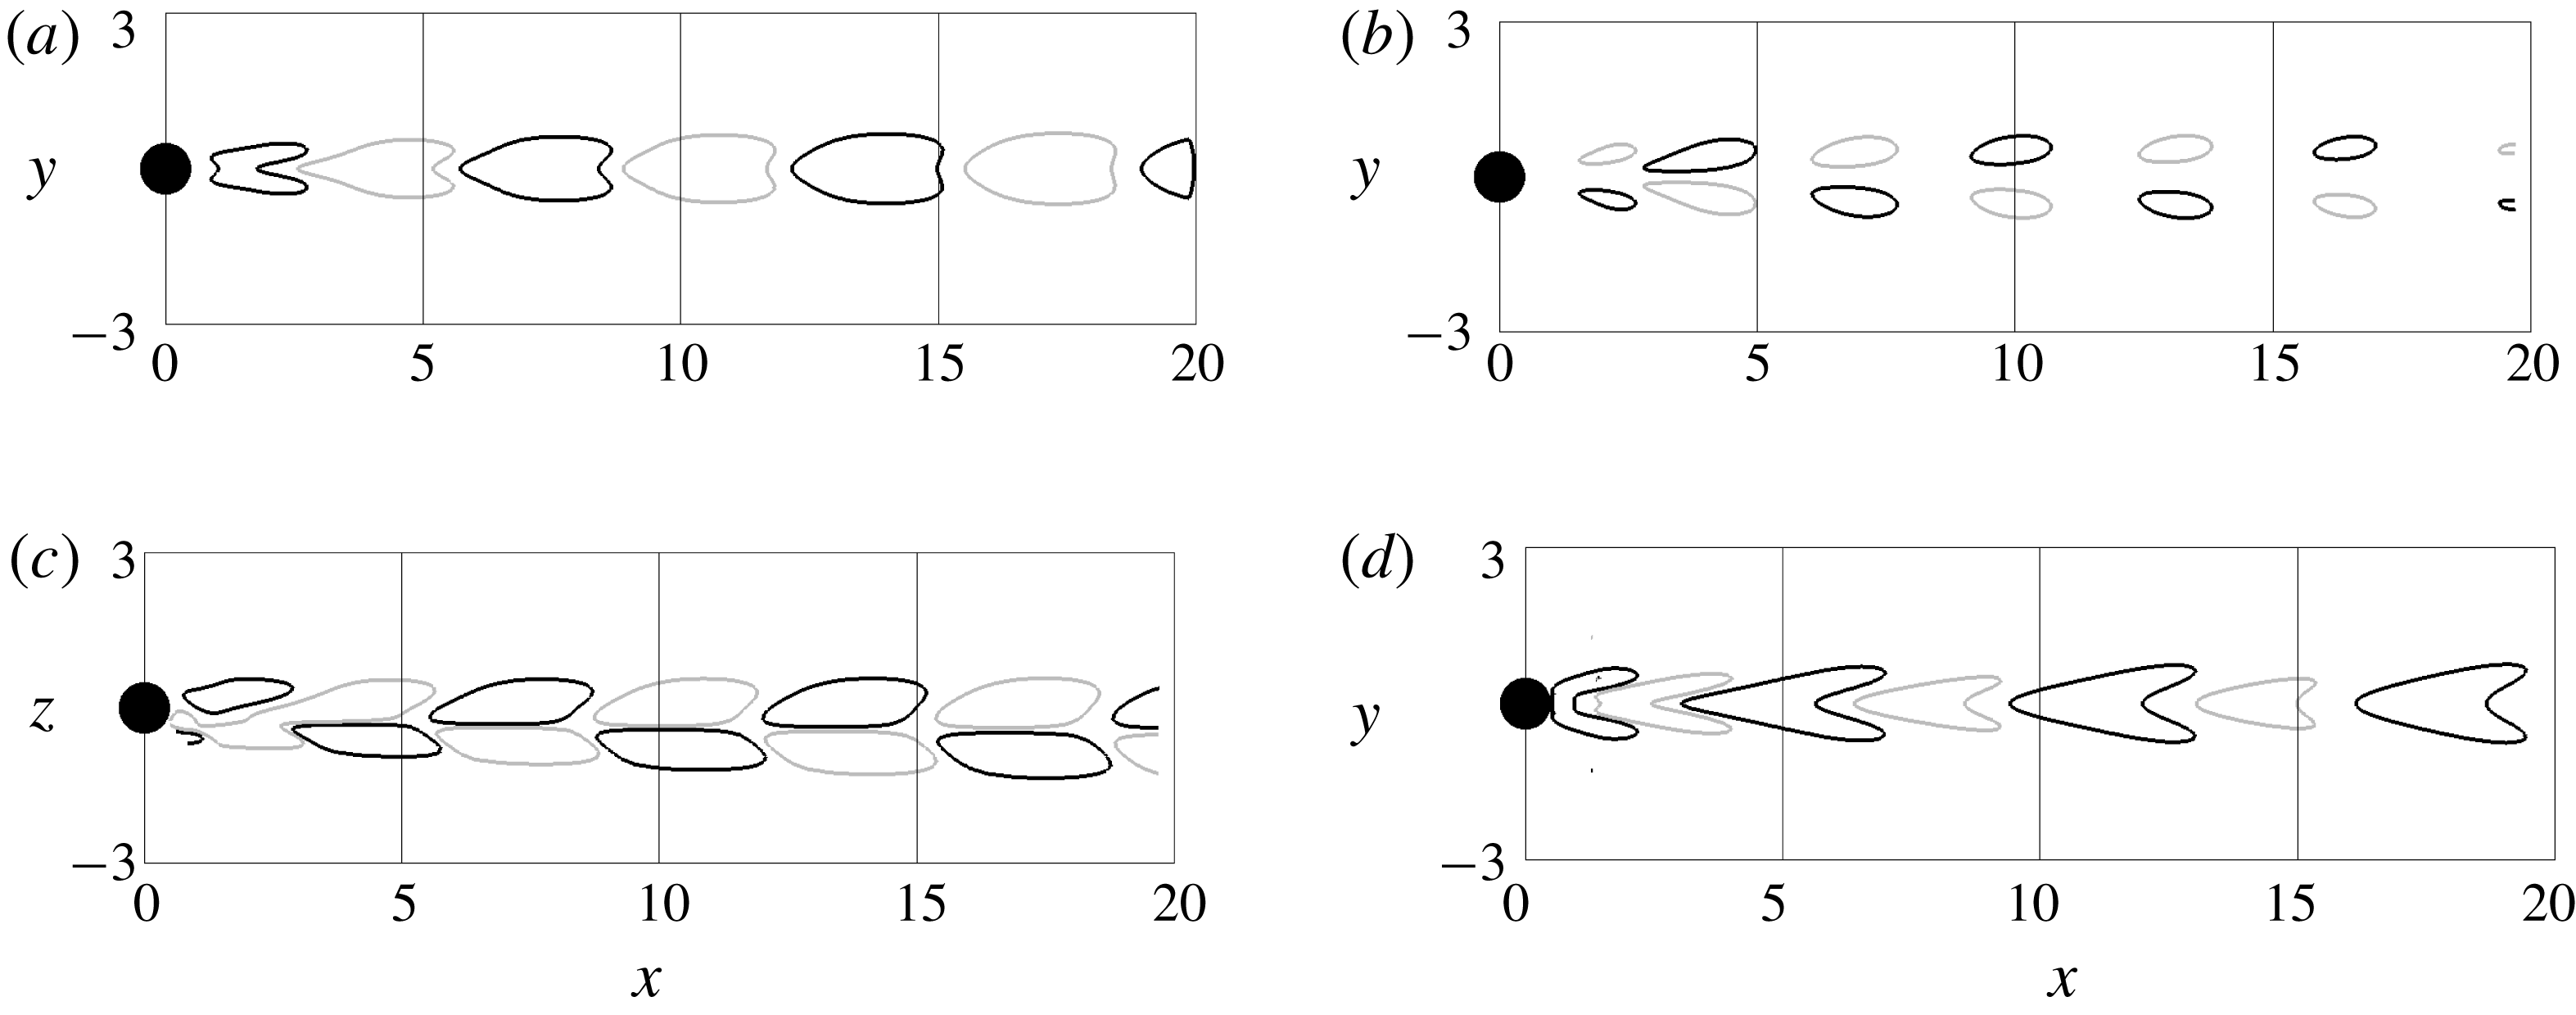
This symmetry property is further identified through the cross-sections in the
 $x$
–
 $z$
and
 $y$
–
 $z$
planes reporting the contours of the velocity components (figure 8). In particular, the symmetric solutions of the eigenvalue problem are found to verify:
 $u(x,-y,z)=u(x,y,z),v(x,-y,z)=-v(x,y,z),w(x,-y,z)=w(x,y,z)$
, similar to a varicose instability with respect to symmetry plane associated with the base flow. Figure 8 also shows that the characteristic wavelength of the mode in the streamwise direction varies from
 $\unicode[STIX]{x1D706}_{x}\approx 2D_{s}$
inside the bubble to
 $\unicode[STIX]{x1D706}_{x}\approx 7D_{s}$
in the wake region, indicating that
 $\unicode[STIX]{x1D706}_{x}$
is of the same order as the recirculation length and its phase velocity increases as it propagates downstream. This gives some further concerns on the inherent difficulty of local stability analysis to provide accurate results for determining critical parameters associated with the Hopf bifurcation (see Pier Reference Pier2008). Consistently with the shedding of hairpin structures observed in the DNS carried out by Tomboulides & Orszag (Reference Tomboulides and Orszag2000) and similarly to the stability analysis of Citro et al. (Reference Citro, Siconolfi, Fabre, Giannetti and Luchini2017), the eigenmode exhibits a wave shape that moves away from the sphere with the same inclination of the recirculation region and more specifically leaving the region of the maximum shear associated with the transverse direction. This gives further support to the idea that the unstable mode is linked to the linear onset of periodic shedding of hairpin vortices observed both experimentally and numerically by Johnson & Patel (Reference Johnson and Patel1999) and Szaltys et al. (Reference Szaltys, Chrust, Goujon-Durand, Tuckerman and Wesfreid2012).
Flow case at
 $Re=280$
for the unstable planar-symmetric base flow. Cross-sections of the mode at
 $(\unicode[STIX]{x1D70E},St)=(0.0105,0.1317)$
. The contours of the streamwise perturbation velocity are plotted on the (a)
 $x$
–
 $y$
and (c)
 $x$
–
 $z$
planes for the levels
 $u^{\prime }=\pm 0.25$
. The contours of the (b) vertical and (d) transverse perturbation velocities are plotted for the levels
 $v^{\prime }=\pm 0.15$
and
 $w^{\prime }=\pm 0.25$
, respectively. Light and dark grey iso-lines for positive and negative perturbation velocities, respectively. The sphere is represented in black.

The conjugate complex pair of unstable eigenvalues is very isolated but it can be interesting to look at the stable sub-dominant mode at
 $(\unicode[STIX]{x1D70E},St)=(-0.06882,0.1184)$
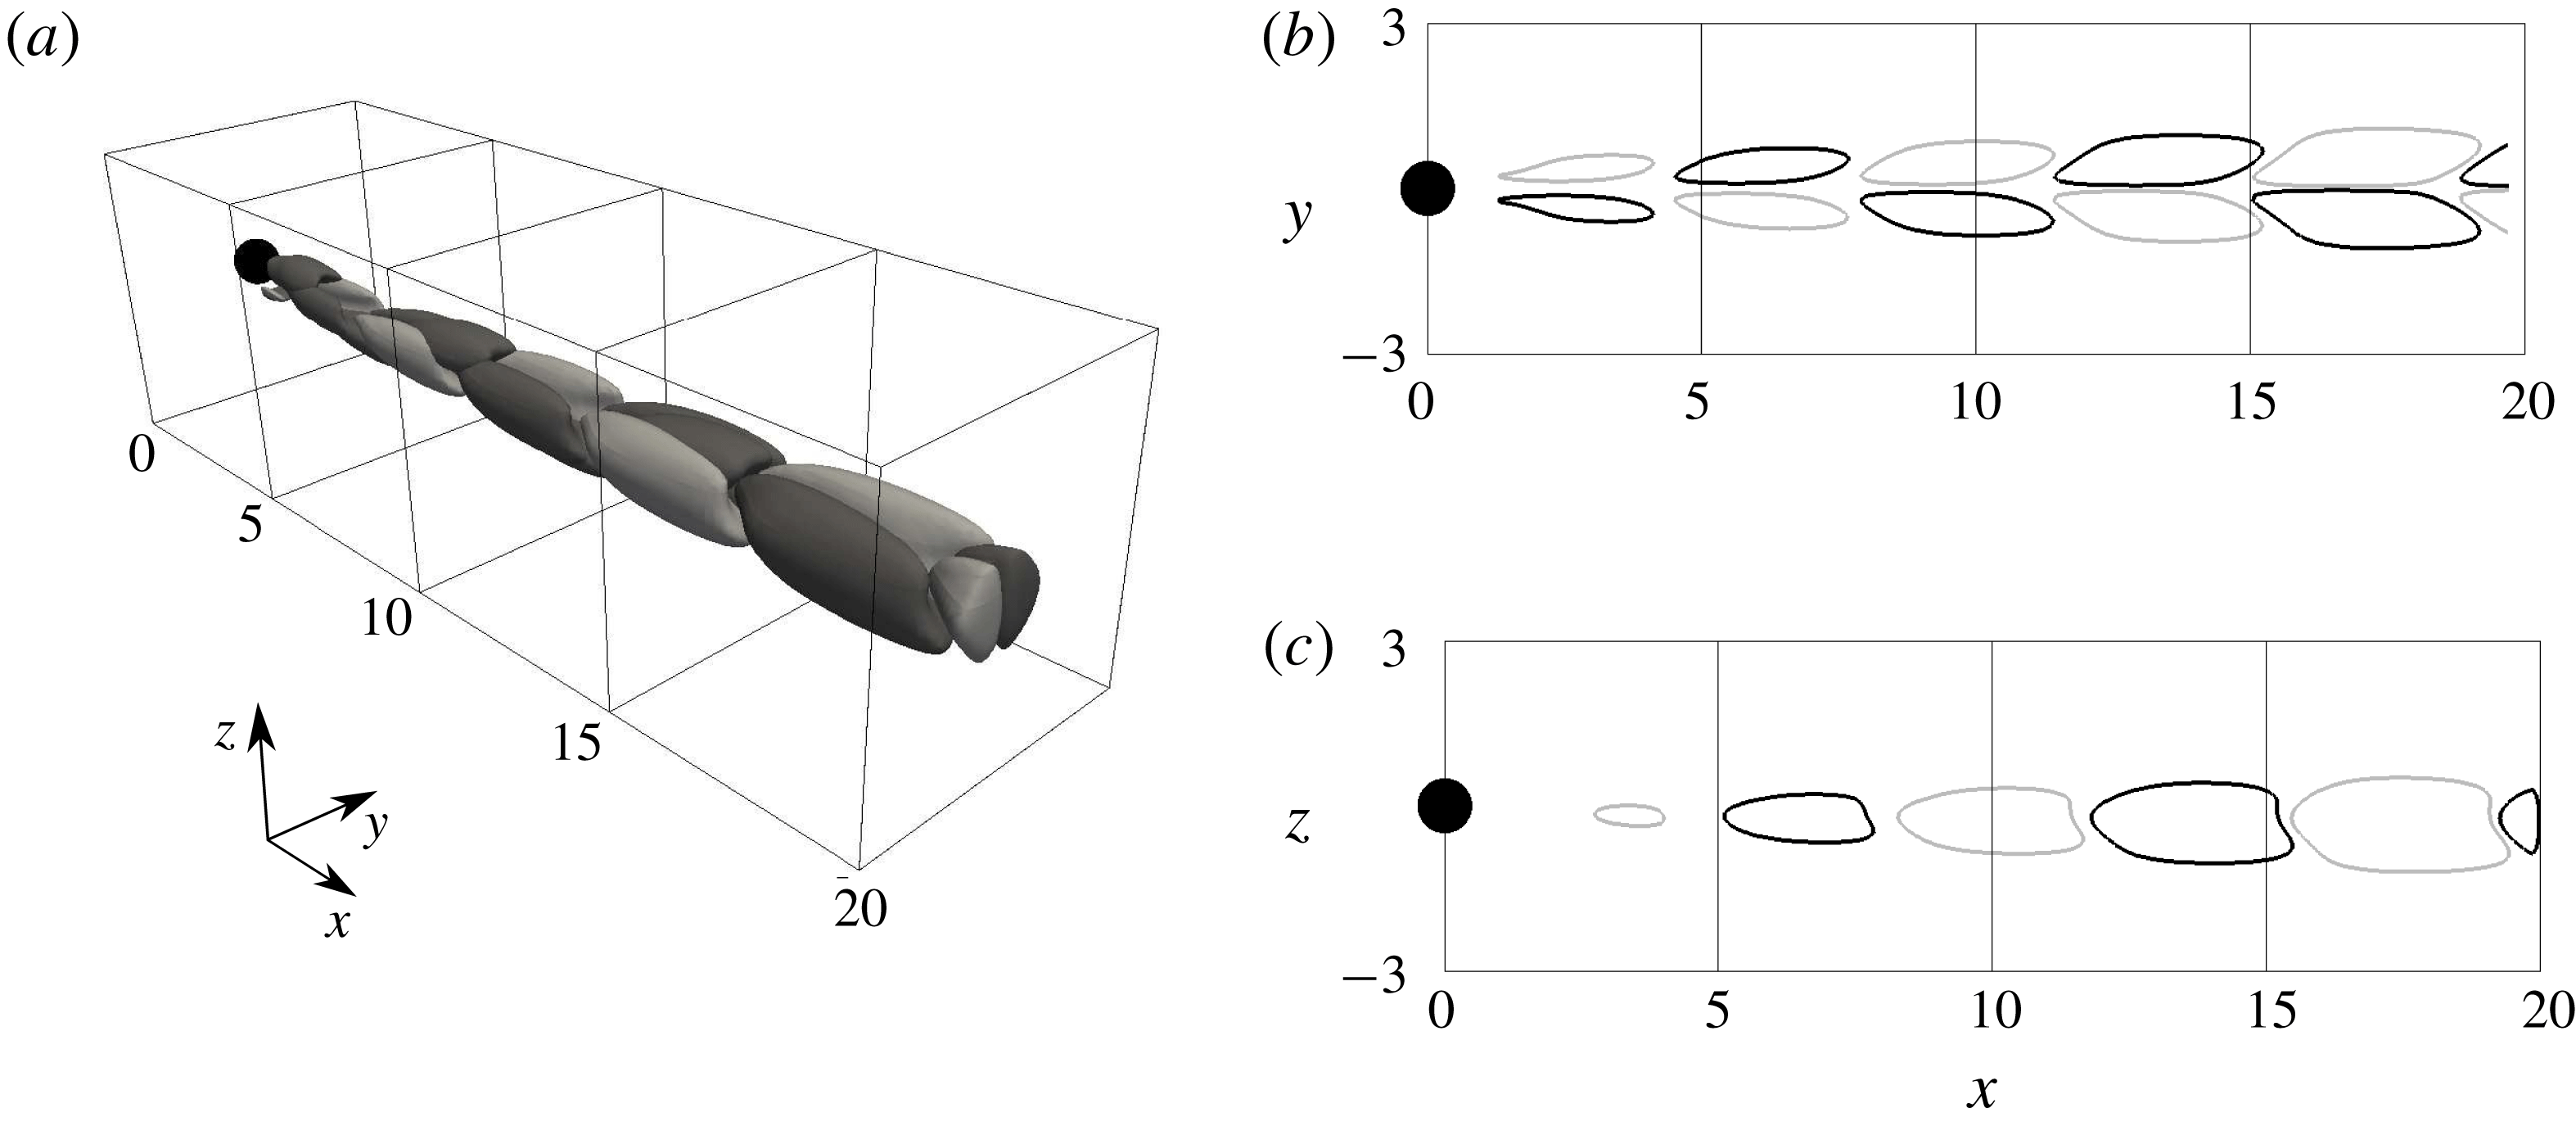
found in figure 6(b). Fabre et al. (Reference Fabre, Auguste and Magnaudet2008) argues the existence of an anti-symmetric sub-dominant mode that might become temporally amplified for increasing Reynolds numbers. The global sub-dominant mode is visualized by plotting the corresponding streamwise perturbation velocity in figure 9. The eigenmode structure is still planar-symmetric but rotated by
 $90^{\circ }$
with respect to the dominant unstable eigenmode and very little differences exist in terms of the streamwise wavelength. This sub-dominant mode moves towards the unstable region for increasing Reynolds number but, for the Reynolds number range considered, the mode remains temporally damped and its evolution is not shown.
Flow case at
 $Re=280$
for the unstable planar-symmetric base flow. (a) Three-dimensional view of the iso-surfaces of the streamwise perturbation velocity associated with the mode at
 $(\unicode[STIX]{x1D70E},St)=(-0.08682,0.1184)$
plotted for the levels
 $u^{\prime }=\pm 0.25$
. The contours of the streamwise perturbation velocity are plotted on the (b)
 $x$
–
 $y$
and (c)
 $x$
–
 $z$
planes for the levels
 $u^{\prime }=\pm 0.25$
. Light and dark grey colours for positive and negative perturbation velocities, respectively. The sphere is represented in black.

4.5 Fixed point versus mean flow stability analysis
To further elucidate the connection between the shedding of hairpin structures and the temporally amplified eigenmode, unsteady nonlinear calculations are carried out for the cases at
 $Re=280,300$
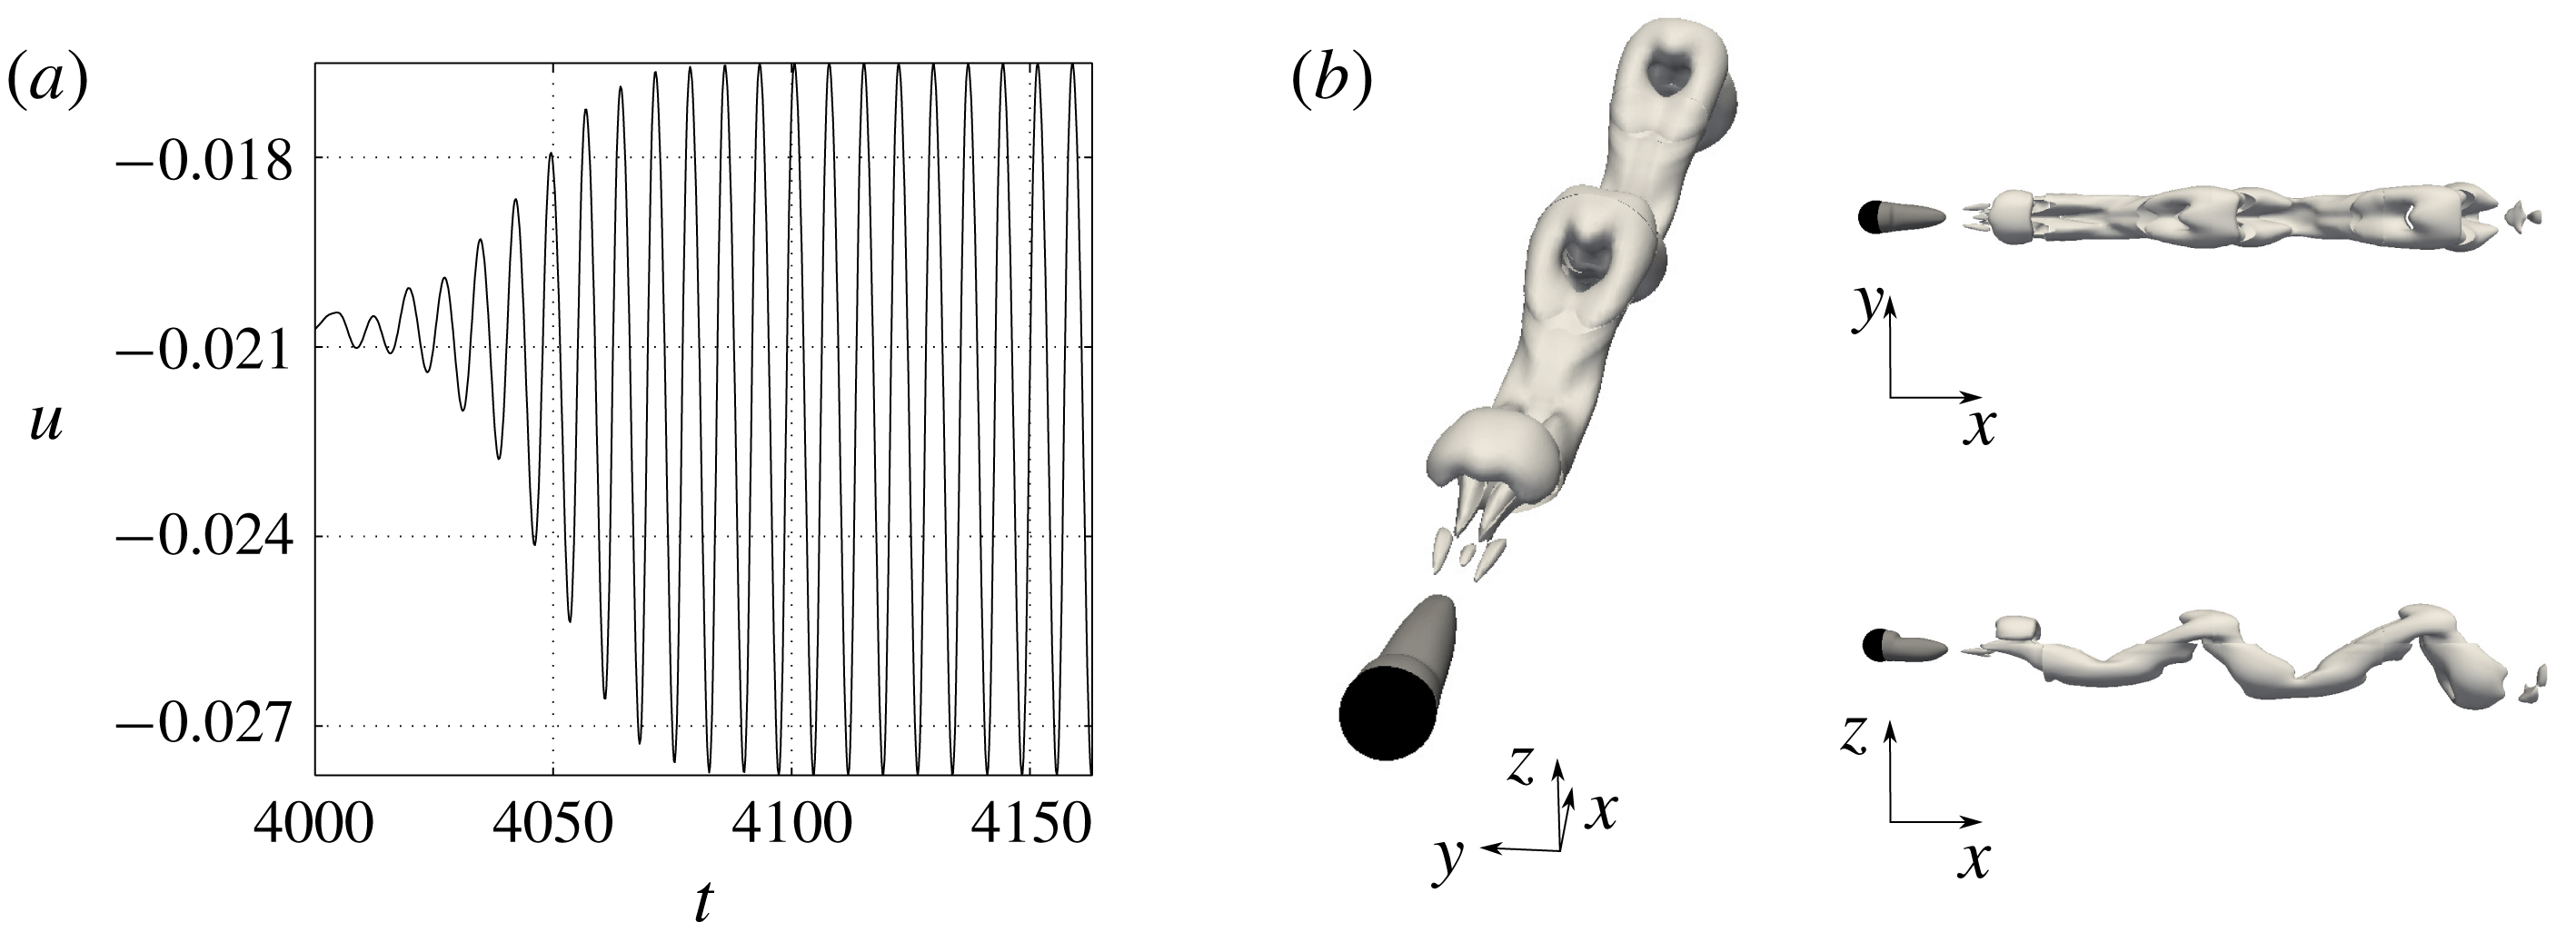
and 320. The nonlinear calculations are initialized with the steady planar-symmetric base flow solution and allowed to evolve in time until saturation. The time history of a probe located in the sphere wake at
 $Re=300$
is reported in figure 10(a). A 3-D view of the unsteady dynamics is shown in figure 10(b), where the instantaneous iso-surfaces of the
 $Q$
-criterion at a level of
 $Q=0.5$
show the legs of the shed hairpin vortices at a Strouhal number of
 $St=0.1345$
. The observed coherent motion presents strong similarities with both the DNS by Johnson & Patel (Reference Johnson and Patel1999) and the dye pattern in water experimentally reported by Schouveiler & Provansal (Reference Schouveiler and Provansal2002) and indicates the temporally amplified mode is responsible for the bifurcation from the double-threaded steady wake with very long streamwise extent to the time-dependent flow characterized by a succession of interconnected vortices behind the sphere.
Unsteady nonlinear calculations at
 $Re=300$
: (a) streamwise velocity time history of the probe located in the sphere wake; (b) three-dimensional view of the unsteady nonlinear calculations. Iso-surfaces of the
 $Q$
-criterion at a level of
 $Q=0.5$
. The zero-streamwise velocity iso-surface in dark grey shows the planar-symmetric separation region behind the sphere (represented in black).

The important issue concerning the capability of the global linear stability analysis performed on a fixed point solution in correctly predicting the Strouhal number of the shedding frequency is here addressed. For a 2-D cylinder flow, Barkley (Reference Barkley2006) shows that while linear stability on the mean flow correctly captures the shedding frequency, when the stability is performed on the fixed point solution the predicted frequency rapidly diverges with the Reynolds number once past the bifurcation. The same analysis can be done by performing the stability analysis on the mean flows calculated over 32 snapshots taken during one period at saturation for the aforementioned cases. Table 2 reports the separation length and eigenvalues calculated by performing global linear stability on the fixed point (FP) and mean flow (MF) solutions. The Strouhal number associated with the nonlinear DNS calculations (
 $St^{NL}$
) is also reported. Since the mean flow is viewed as a marginally stable solution when considered as a steady solution, the growth rate predicted by the linear stability is about zero and no further information can be extracted. As seen for the 2-D cylinder case, the global stability analysis performed around the mean flow better predicts the shedding frequency of the nonlinear DNS calculations. However, it is interesting to see that the shedding frequencies predicted by the stability analysis on fixed point and mean flow do not diverge as quickly. For the same
 $\unicode[STIX]{x0394}Re=40$
above the supercritical bifurcation Reynolds value, this difference is approximately 25 % for the 2-D cylinder and approximately 3 % for the sphere.
Comparisons between global linear stability analysis carried out on the fixed point (FP) and mean flow (MF). The Strouhal number of the nonlinear DNS calculations (
 $St^{NL}$
) is also reported.

5 Mach evolution of the regular and Hopf bifurcations
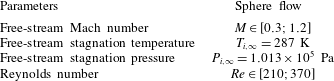
Extending the work of Meliga et al. (Reference Meliga, Sipp and Chomaz2010) with the objective of explaining the study of Nagata et al. (Reference Nagata, Nonomura, Takahashi and Fukuda2016, Reference Nagata, Nonomura, Takahashi, Mizuno and Fukuda2018), the evolution of the regular and Hopf bifurcations with Mach and Reynolds number is tracked. A fully 3-D global stability analysis is performed for each case investigated to follow the bifurcations and explain the appearance, or better the disappearance, of temporally amplified global modes. Low Reynolds number and low-supersonic cases are selected (see table 3) and the same analysis carried out for the nearly incompressible study is repeated.
Free-stream parameters for the bifurcation Mach evolution analysis.
5.1 Simulation details
While for all the subsonic cases up to
 $M=0.75$
the numerical set-up used for the nearly incompressible analysis is unchanged, for the
 $M=0.9$
and supersonic cases a different domain configuration is selected and reported in figure 11. The computational domain is composed of 6 blocks in an ellipsoidal configuration to better follow the bow shock that forms in front of the sphere. Although adapted to the new domain configuration, the same boundary conditions for the nearly incompressible case are used for both fixed point and linear stability calculations (see §§ 3.1 and 3.2, respectively). To confirm the grid capability to reproduce the correct physics, the nearly incompressible case at
 $Re=280$
is repeated on the new domain configuration and good agreement with the previous numerical set-up is obtained. Furthermore, the base flow at
 $Re=300$
and
 $M=1.2$
is also compared with the numerical results by Nagata et al. (Reference Nagata, Nonomura, Takahashi and Fukuda2016) and good match in terms of shock shape and shock stand-off distance is achieved. The chosen grid resolution is
 $(n_{x},n_{y},n_{z})=(224\times 112\times 112)$
for each block.
Three-dimensional (a) and lateral (b) views of the numerical domain for the
 $M=0.9$
and supersonic flow cases.

5.2 Base flow Mach evolution
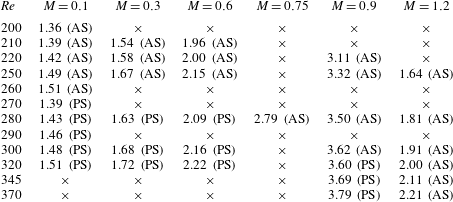
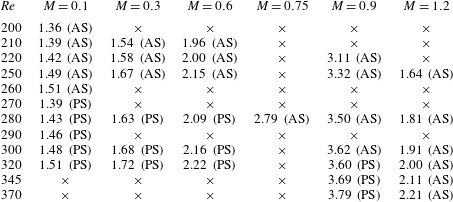
As shown by Nagata et al. (Reference Nagata, Nonomura, Takahashi and Fukuda2016, Reference Nagata, Nonomura, Takahashi, Mizuno and Fukuda2018) in their nonlinear unsteady calculations, the large-scale effect of the increasing Mach number on the base flow is to cause the axisymmetrization of the separated region behind the sphere. Table 4 reports separation lengths and information on the base flow symmetry characteristics, whether it is axisymmetric (AS) or planar-symmetric (PS), for each case investigated. The symbol ‘
 $\times$
’ is used to indicate the cases that have not been analysed. For the case at
 $Re=280$
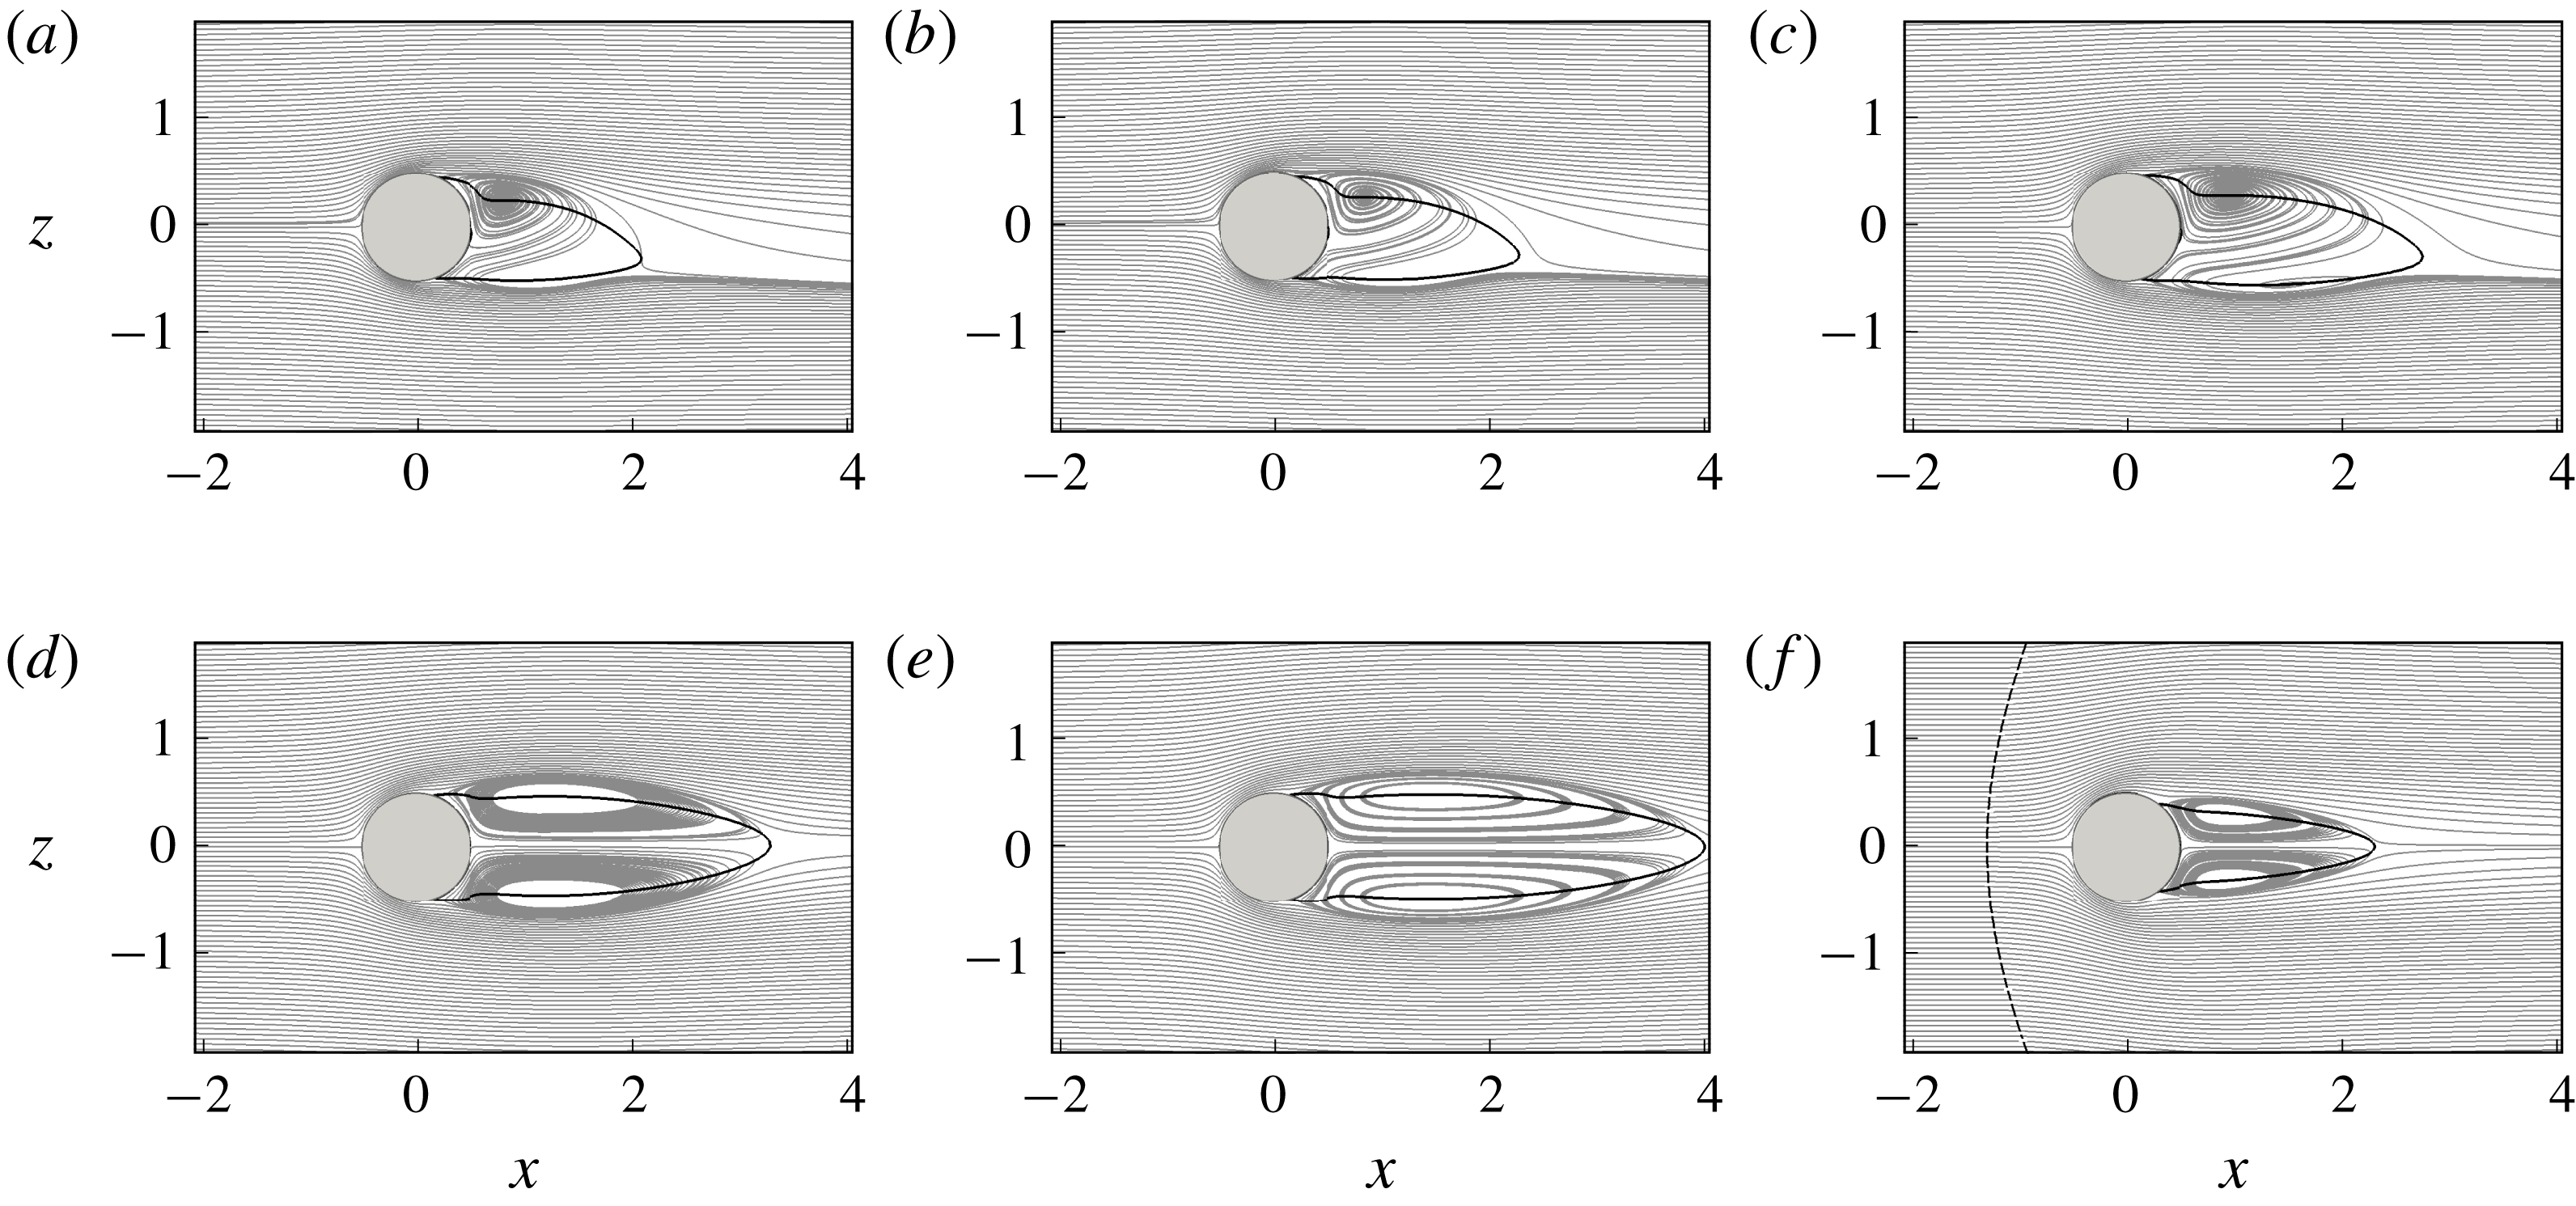
, the base flow Mach evolution is shown in figure 12 by the projections of the 3-D streamlines on the
 $x$
–
 $z$
plane for the cases at (a)
 $M=0.1$
, (b)
 $M=0.3$
, (c)
 $M=0.6$
, (d)
 $M=0.75$
, (e)
 $M=0.9$
and (f)
 $M=1.2$
. The solid black lines indicate the separation region by plotting the contours of the zero-streamwise velocity. The presence of the bow shock in front of the sphere is highlighted by the dashed black line, upstream of which the flow is undisturbed and the streamlines are parallel to the
 $x$
-axis. In the subsonic regime, when the same configuration of azimuthal symmetry is kept the effect of the Mach number on the base flow is the same as that of the Reynolds number and the size of the separation region increases with the Mach number (figure 12
a–c). When a change from planar to axisymmetry occurs for increasing Mach number and fixed Reynolds number (figure 12
c,d) the separated region ‘bursts’ into a much larger one. It is important to specify that for all these cases the flow is everywhere subsonic and no shocks are formed either in front or on the sphere. On the contrary, particular attention needs to be given to the base flow of the supersonic cases, for which a bow shock is formed. When passing from subsonic to supersonic flow conditions, either if the azimuthal symmetry changes or not, the separated region behind the sphere becomes significantly shorter (figure 12
e,f). However, also for the supersonic case at
 $M=1.2$
, the effect of the Reynolds number on the separation length is the same as in the subsonic case and the separated region increases in size with the Reynolds number (see the column at
 $M=1.2$
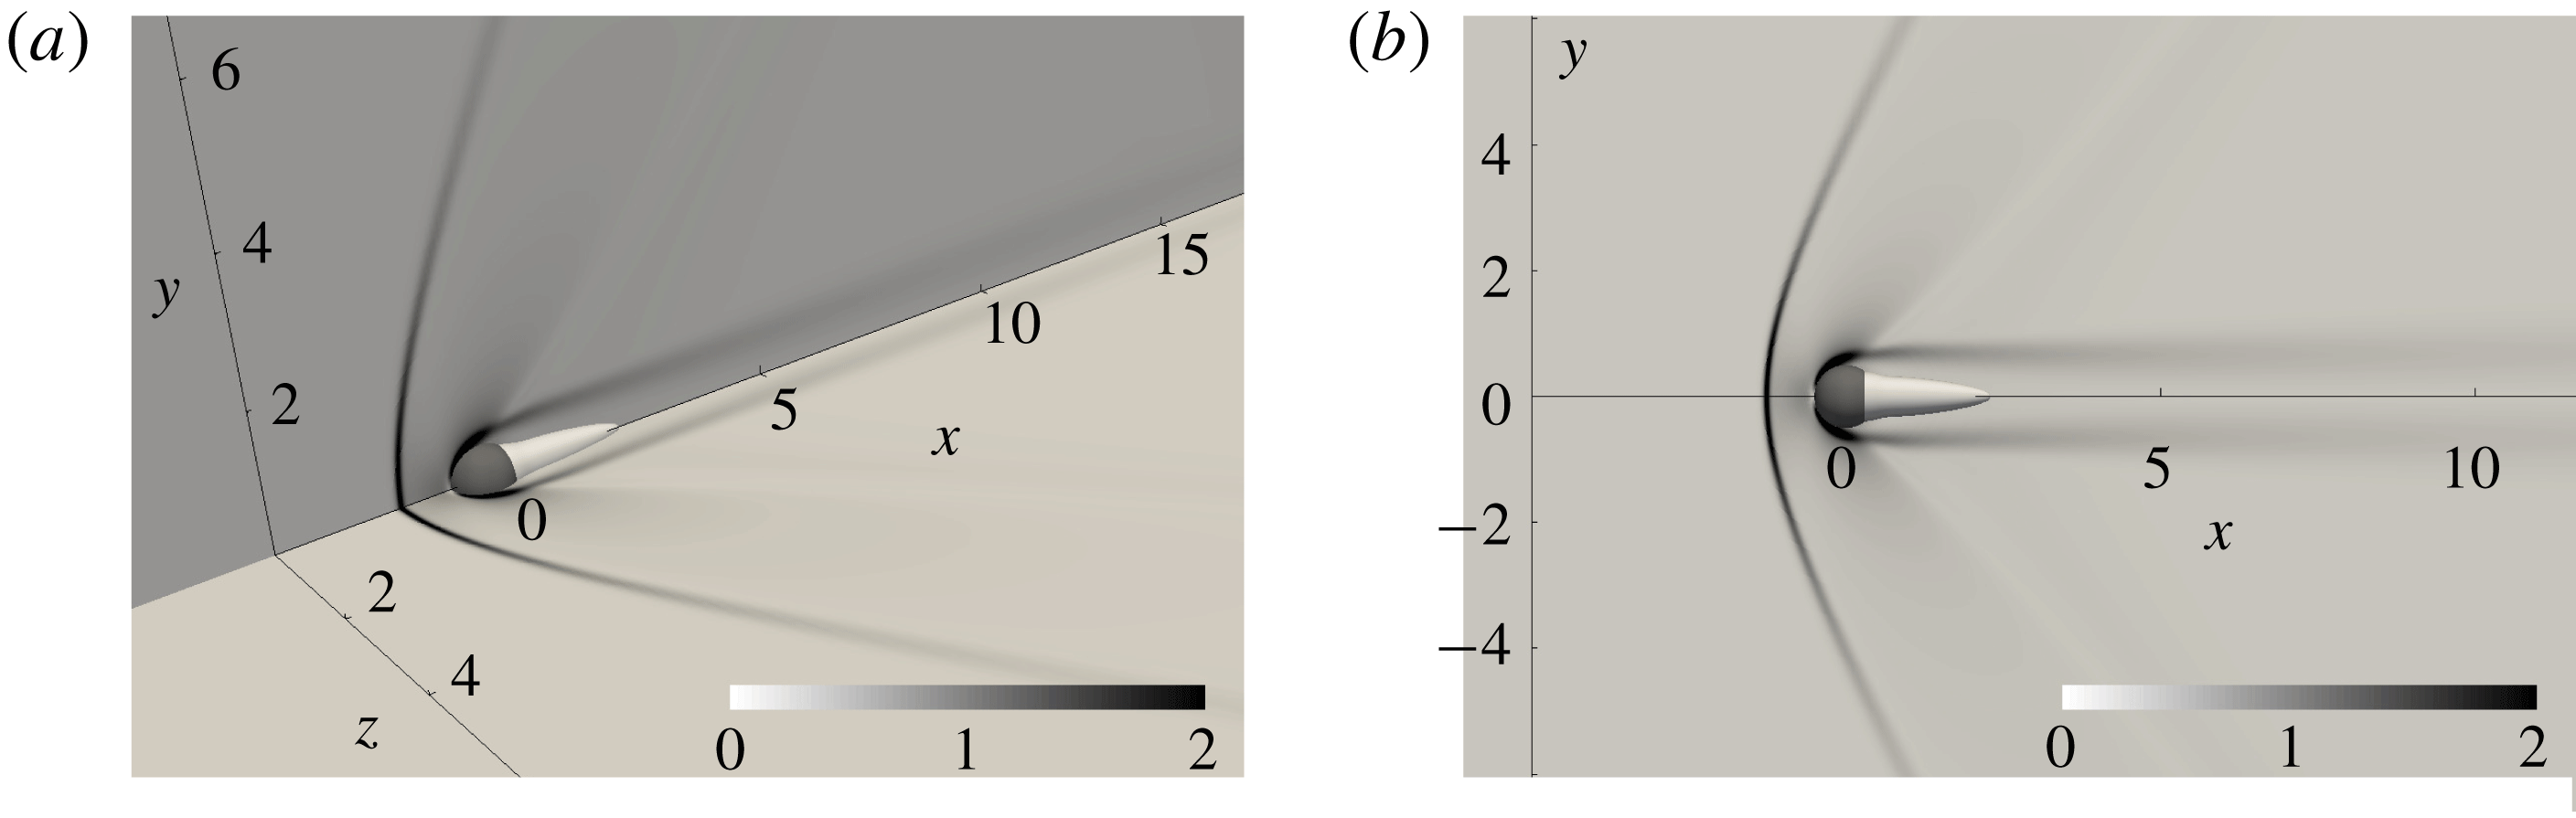
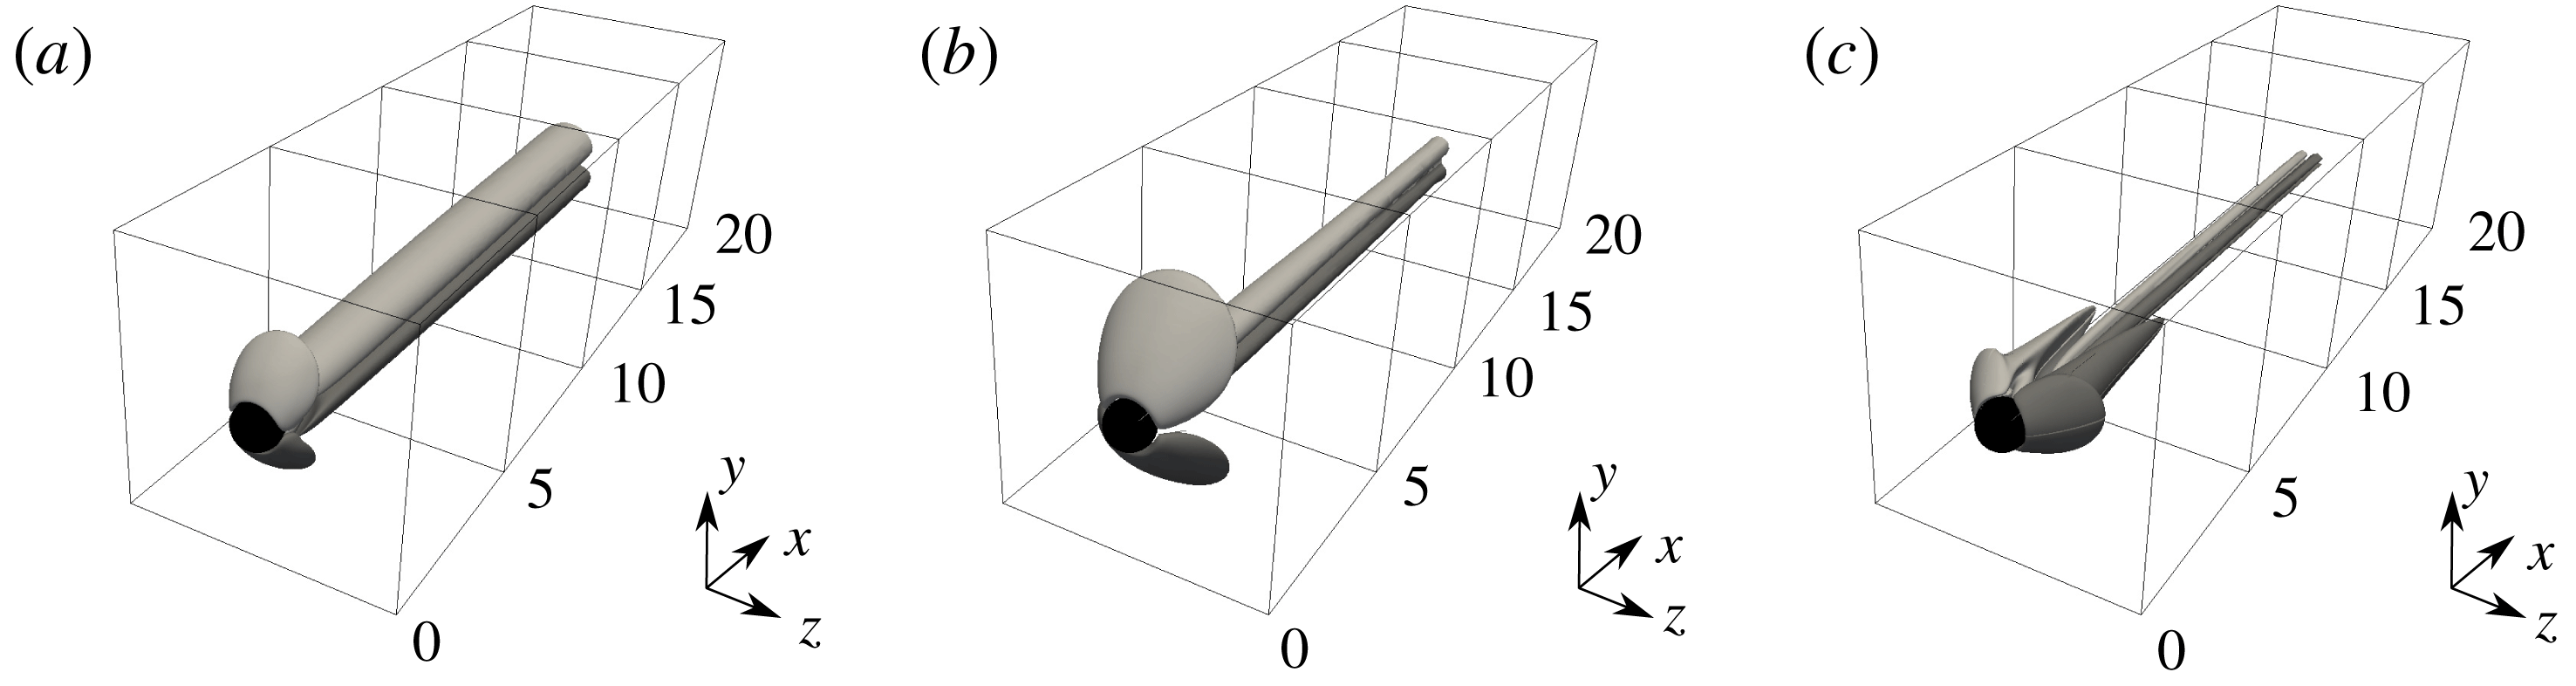
in the table 4). Figure 13 shows the contours of the density gradients in a 3-D view in (a) the two perpendicular
 $x$
–
 $y$
and
 $x$
–
 $z$
planes and (b) in a 2-D view of the
 $x$
–
 $y$
plane. The bow shock that forms in front of the sphere forces the axisymmetry of the separated region behind the sphere. The Schlieren-like contours also show the expansion fans that generate on the sphere and diverge while moving downstream. These obtained base flows are used to perform global stability analysis and investigate the evolution of the regular and Hopf unstable bifurcations.
Base flow Mach evolution at
 $Re=280$
. Three-dimensional streamlines projected onto the
 $x$
–
 $z$
plane for the (a)
 $M=0.1$
, (b)
 $M=0.3$
, (c)
 $M=0.6$
, (d)
 $M=0.75$
, (e)
 $M=0.9$
and (f)
 $M=1.2$
cases. The separated region is indicated by the solid black line. For the supersonic case, the shock is represented by the dashed black line.

Schlieren-like visualization of the base flow at
 $Re=280$
and
 $M=1.2$
. Contours of the density gradient on (a) the two perpendicular
 $x$
–
 $y$
and
 $x$
–
 $z$
planes and (b) a 2-D view on the
 $x$
–
 $y$
plane.

Hopf bifurcation. Mach evolution of the (a) temporal amplification rate and (b) Strouhal number for the least temporally damped/most temporally amplified oscillatory global mode at
 $Re=280$
.

5.3 Bifurcation Mach evolution
The Hopf bifurcation is first analysed for
 $Re=280$
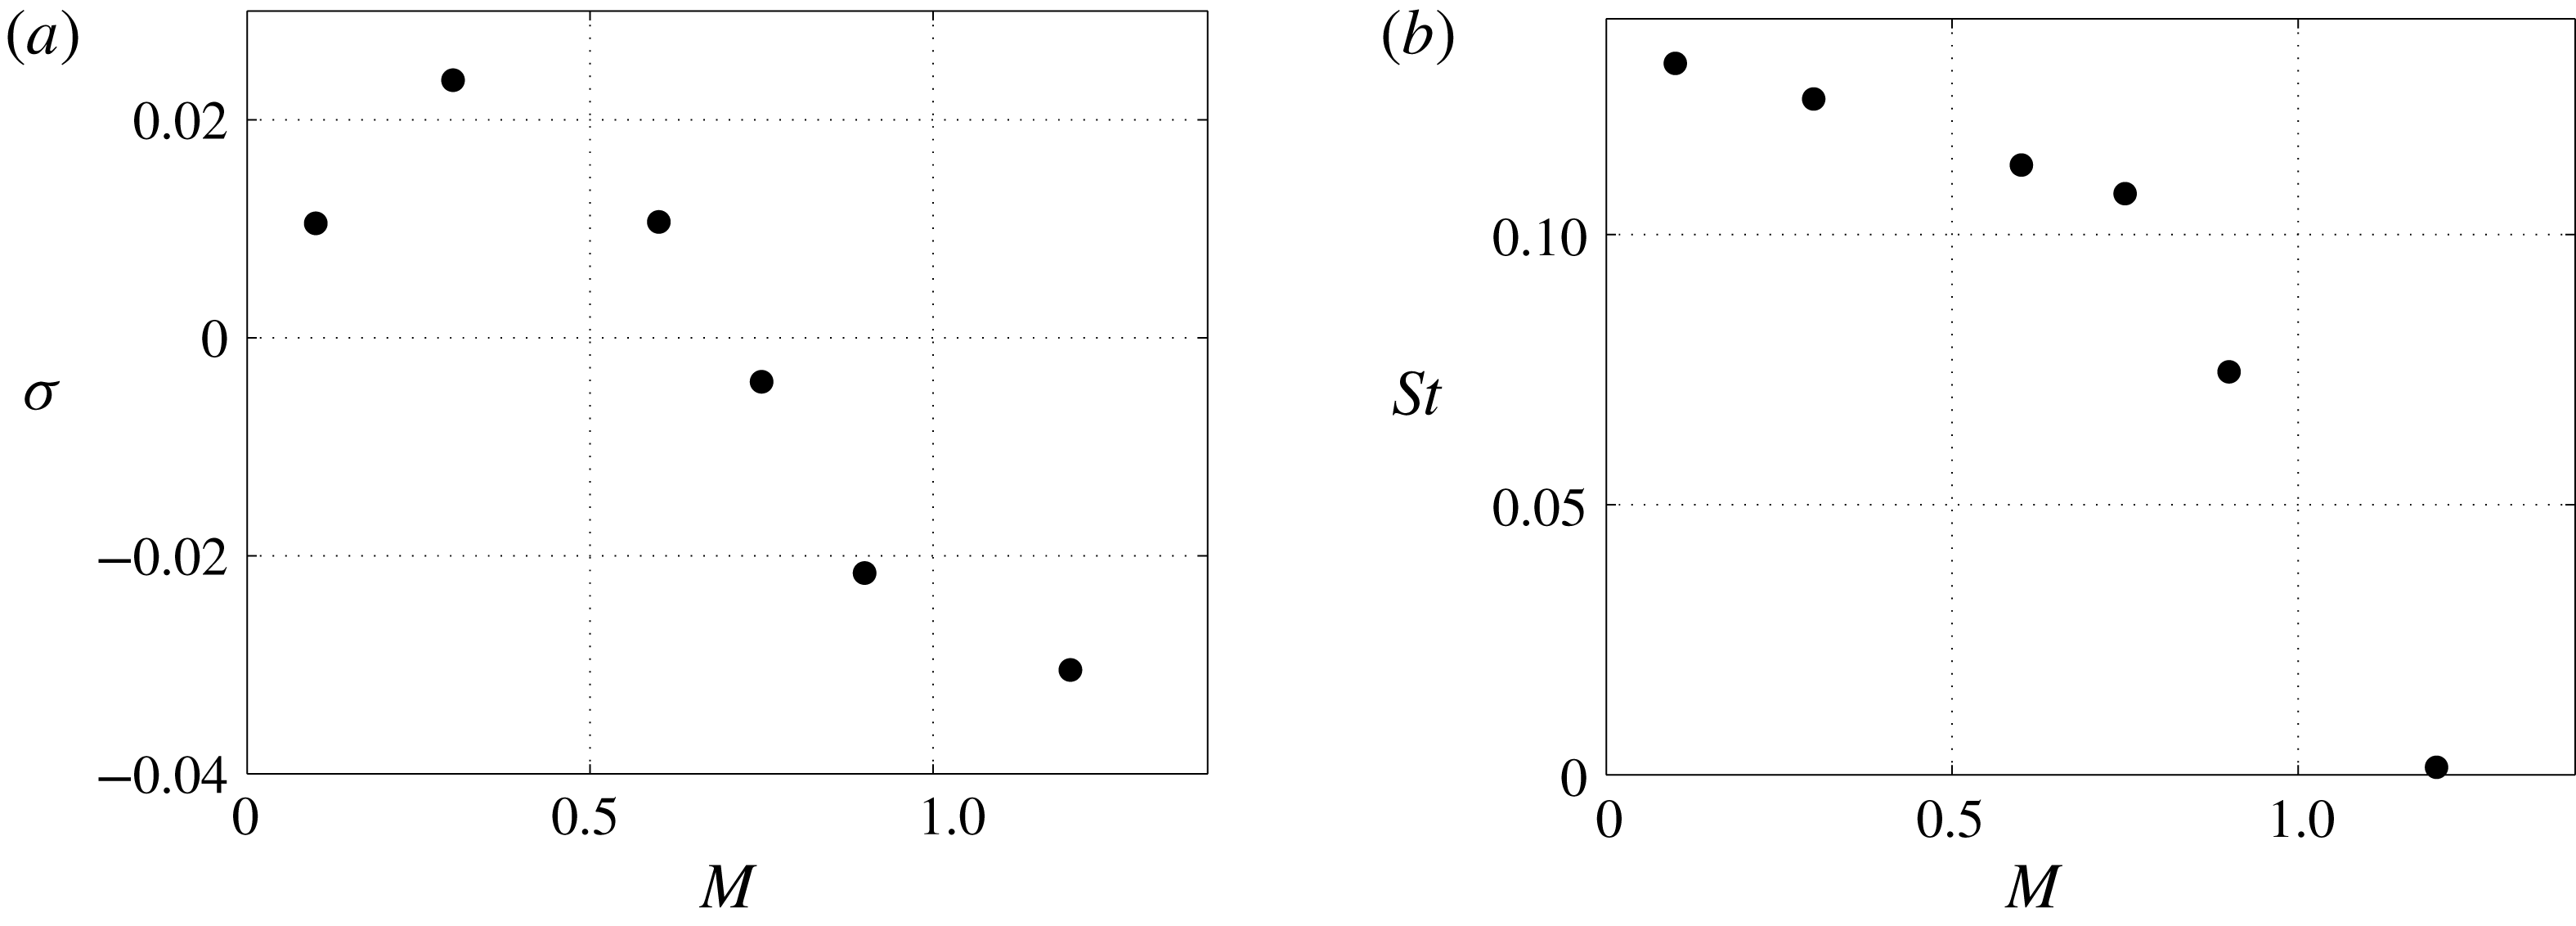
. The Mach evolution of the most temporally amplified global mode is reported in figure 14 in terms of (a) growth rate and (b) Strouhal number. Despite some differences with the findings of Meliga et al. (Reference Meliga, Sipp and Chomaz2010) that may be well due to either their base flow axisymmetry hypothesis or the constant molecular viscosity and thermal conductivity assumption, the present results confirm that the Mach number initially shows a destabilizing effect on the sphere wake and the growth rate of the global mode increases for
 $M=0.3$
. However, when the Mach number is further increased the global mode is damped and its growth rate that still has a positive sign at
 $M=0.6$
becomes negative at
 $M=0.75$
, individuating the threshold of the Hopf bifurcation. Similarly to what found by Nagata et al. (Reference Nagata, Nonomura, Takahashi and Fukuda2016, Reference Nagata, Nonomura, Takahashi, Mizuno and Fukuda2018), accordingly with the increasing size of the separation, the frequency of the most temporally amplified mode decreases with the Mach number. It is interesting to see that at
 $M=0.75$
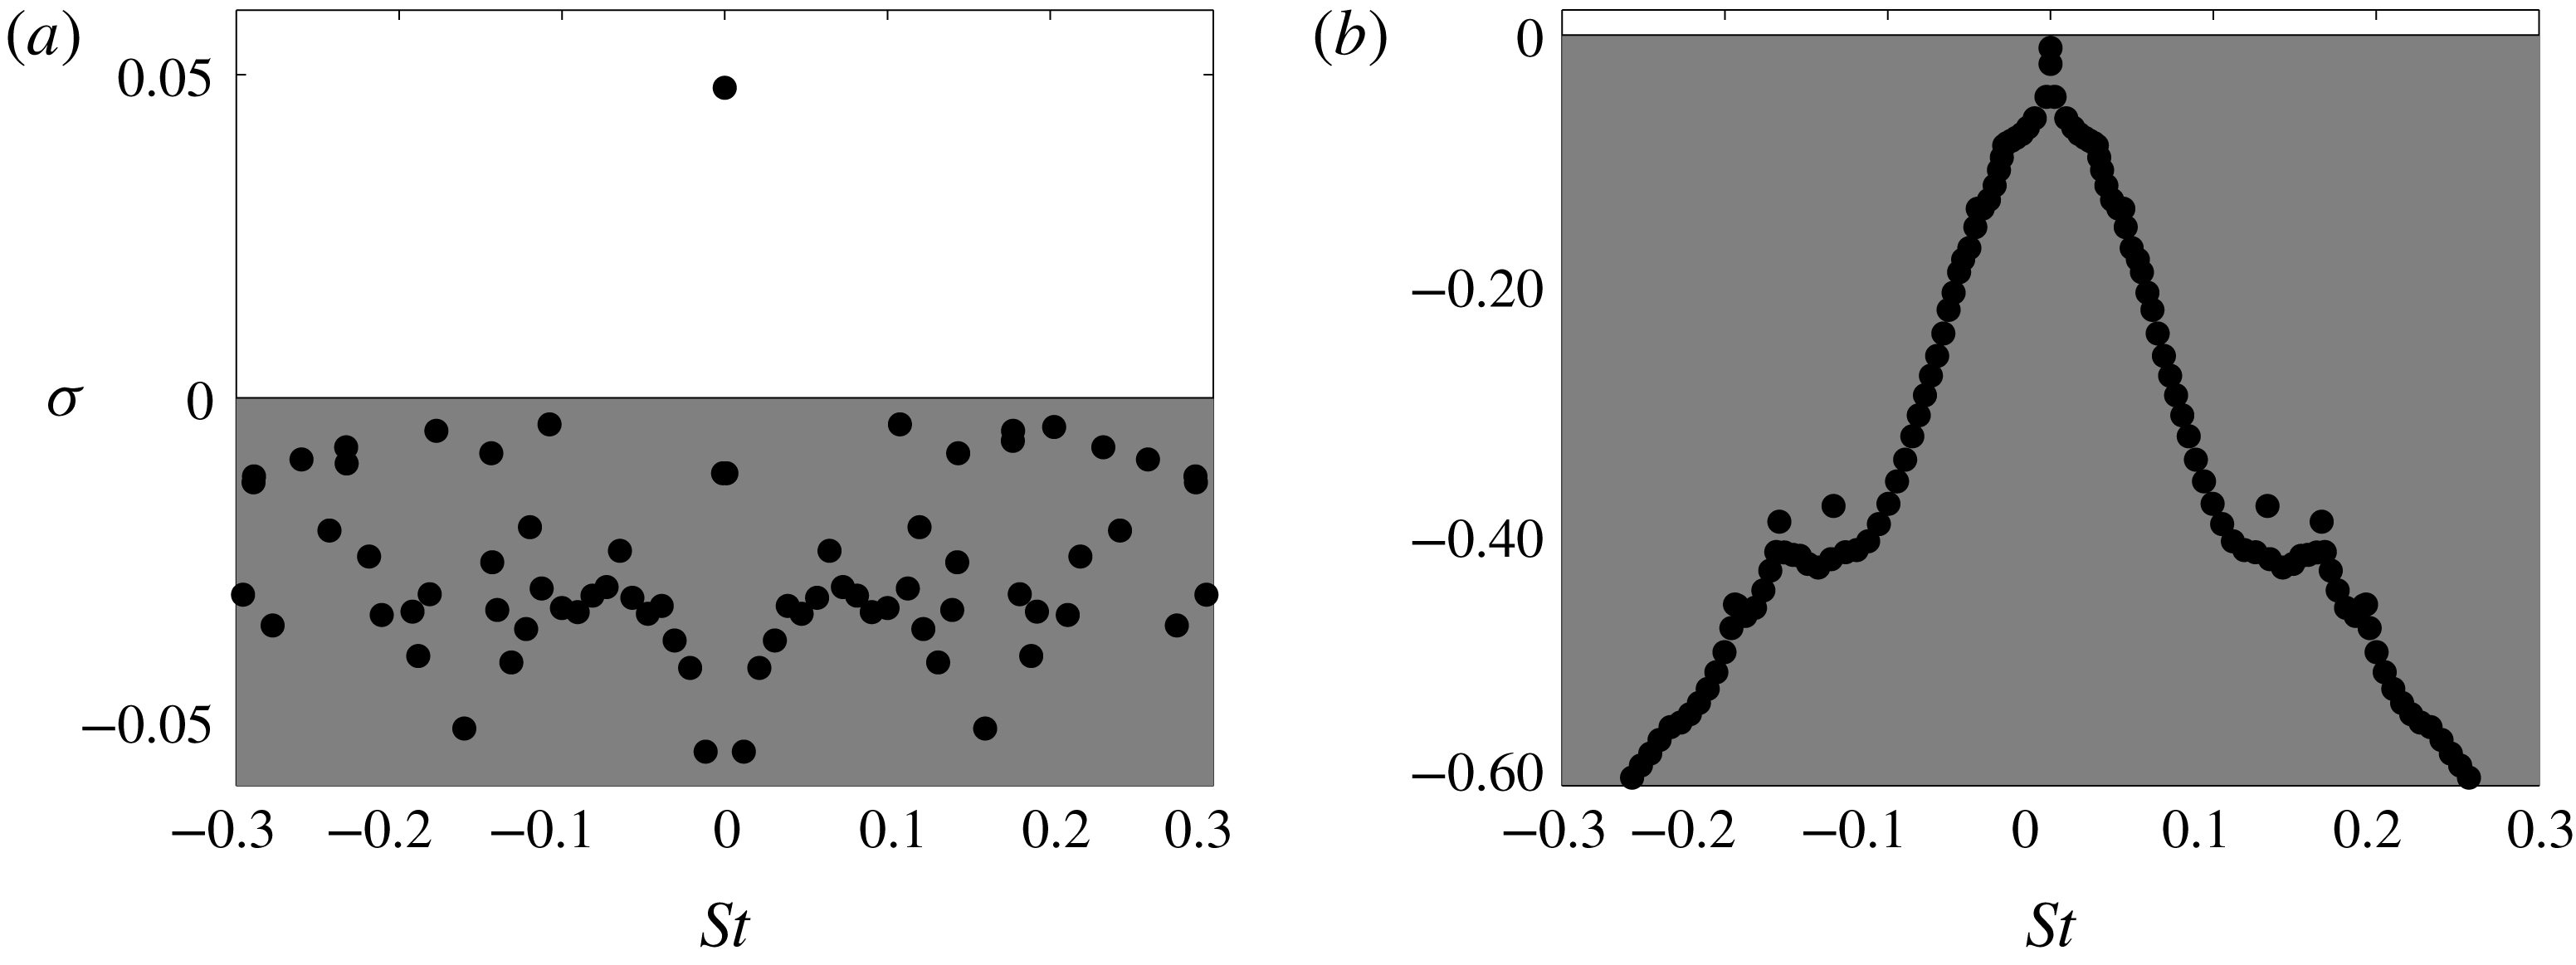
the axisymmetric base flow is unstable and a temporally amplified non-oscillatory mode appears, as shown in figure 15(a).
Reynolds and Mach number base flow separation lengths and symmetry characteristics (AS
 $=$
axisymmetric, PS
 $=$
planar-symmetric) evolution.
Eigenspectra in the
 $St$
–
 $\unicode[STIX]{x1D70E}$
plane for the cases at
 $Re=280$
and (a)
 $M=0.75$
and (b)
 $M=1.2$
. The axisymmetric base flows shown in figure 12(d,f) are used, respectively.

Flow case at
 $Re=280$
and
 $M=0.75$
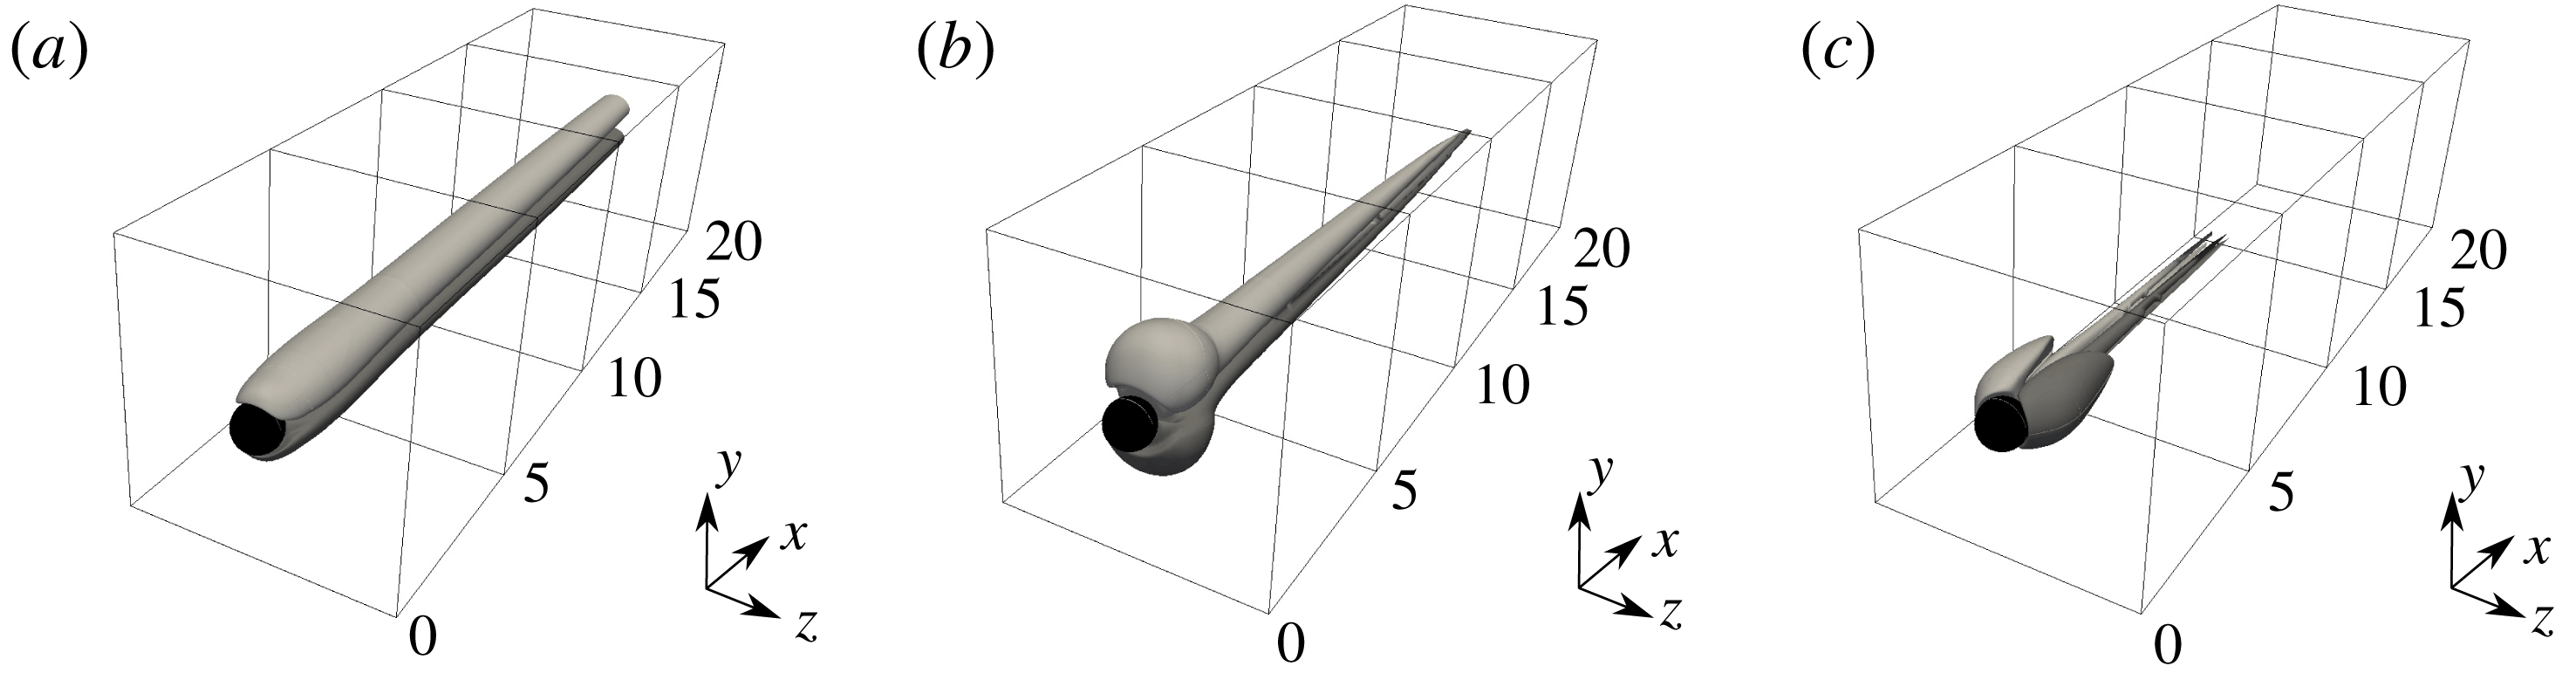
for the unstable axisymmetric base flow. Three-dimensional view of the iso-surfaces of the (a) streamwise, (b) radial and (c) azimuthal perturbation velocities associated with the mode at
 $(\unicode[STIX]{x1D70E},St)=(0.04799,0.0)$
plotted for the levels
 $v_{x}^{\prime }=\pm 0.10$
,
 $v_{r}^{\prime }=\pm 0.03$
and
 $v_{\unicode[STIX]{x1D703}}^{\prime }=\pm 0.03$
, respectively.

Similarly to what done for the incompressible modes around the first bifurcation, a transformation of coordinates (from Cartesian to cylindrical) has been applied to transform the streamwise, vertical and transversal
 $(u^{\prime },v^{\prime },w^{\prime })$
perturbation velocities into streamwise, radial and azimuthal
 $(v_{x}^{\prime },v_{r}^{\prime },v_{\unicode[STIX]{x1D703}}^{\prime })$
ones. The iso-surfaces of the perturbation velocities associated with the mode at
 $(\unicode[STIX]{x1D70E},St)=(0.04799,0.0)$
reported in figure 16 show the resemblance to the temporally amplified non-oscillatory mode found in the nearly incompressible analysis, i.e. at
 $Re=210$
(see figure 5), that similarly causes the loss of axisymmetry due to an azimuthal mode with wavenumber
 $m=1$
. When the Mach number is further increased up to
 $M=1.2$
, the axisymmetric base flow solution becomes stable, identifying the threshold of the regular bifurcation. Figure 15(b) shows the eigenspectrum for the globally stable axisymmetric base flow at
 $M=1.2$
and the corresponding iso-surfaces of the perturbation velocities (streamwise, radial and azimuthal) associated with the non-oscillatory mode at
 $(\unicode[STIX]{x1D70E},St)=(-0.0101,0.0)$
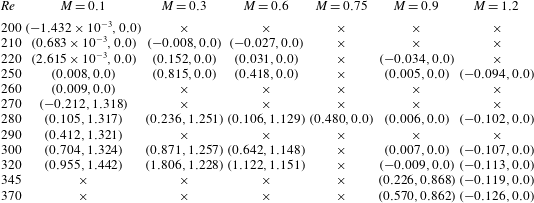
are reported in figure 17. The presence of the bow shock and the consequent expansion fans on the sphere cause the appearance of a structure attached to the sphere. Although the base flow solution is stable and this mode is not temporally amplified, the azimuthal character of the eigenfunction is still associated with an azimuthal wavenumber
 $m=1$
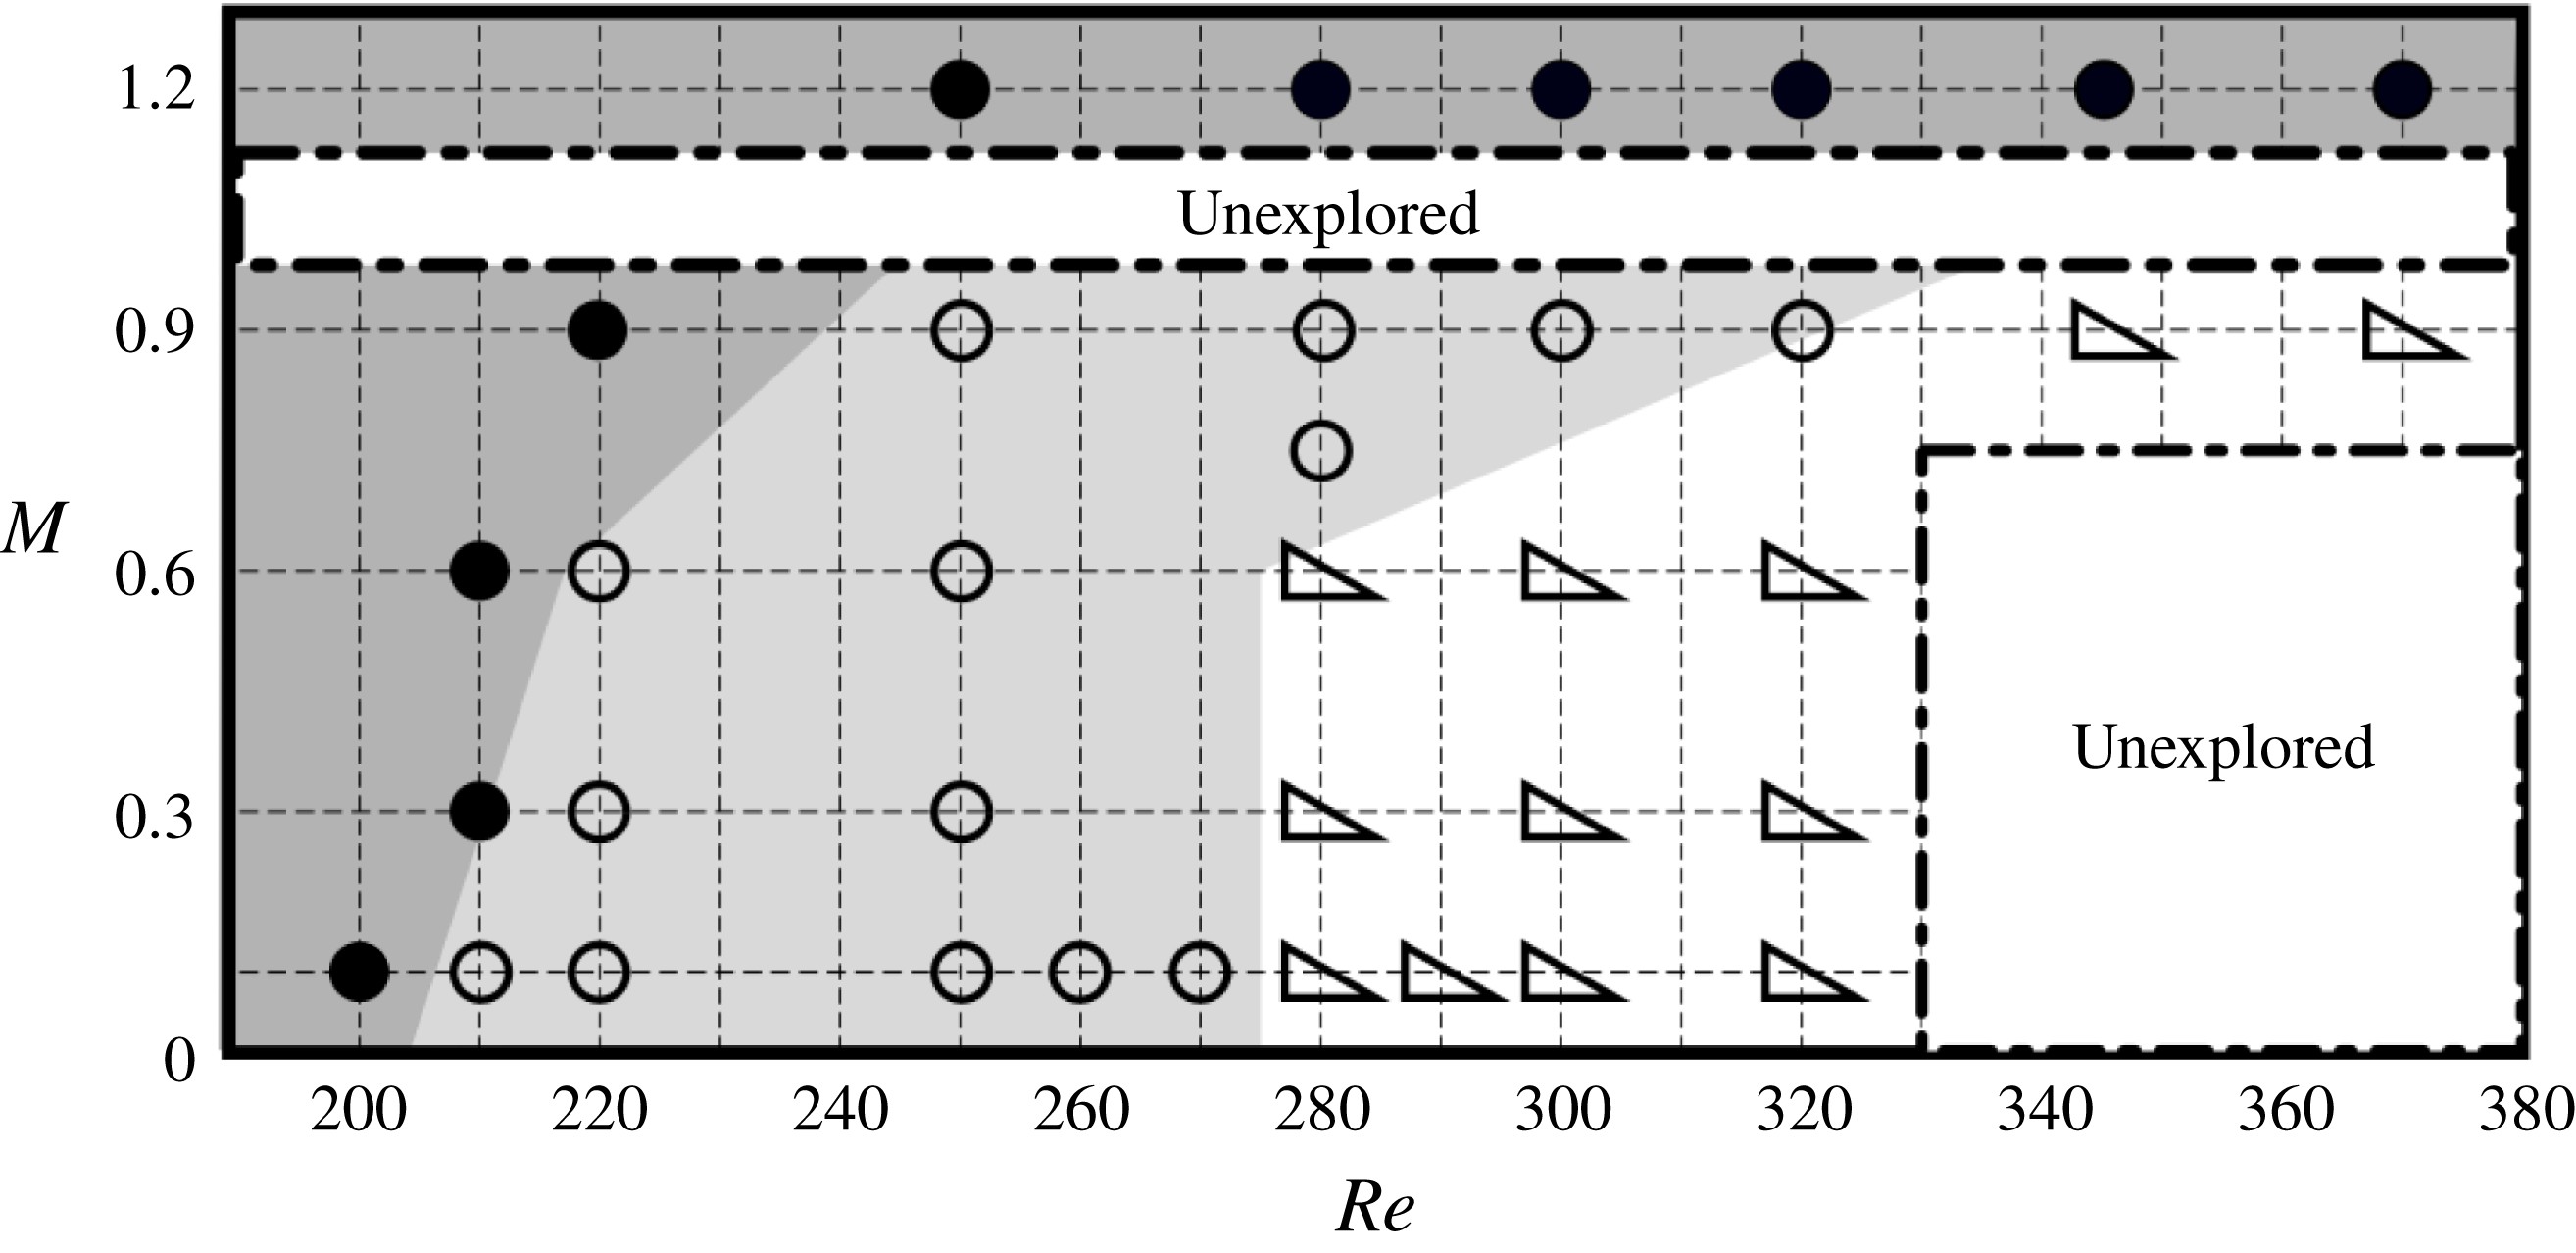
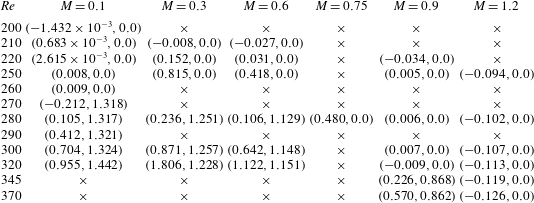
. The same analysis is repeated for all the considered Reynolds and Mach numbers and the most temporally amplified/least temporally damped modes are presented in table 5. Thus, it is possible to draw a stability map and follow the boundaries of the two bifurcations, as shown in figure 18. Stable axisymmetric base flows (dark grey region) are indicated by full circle symbols. Unstable axisymmetric base flows (light grey region) characterized by a temporally amplified non-oscillatory planar-symmetric mode are represented as empty circles. The empty triangle symbols correspond to unstable planar-symmetric base flows (white region) characterized by a temporally amplified oscillatory planar-symmetric mode. Two unexplored regions are indicated and framed by dash-dotted lines: a first one at low-Mach/high-Reynolds numbers, where an unsteady periodic base flow exists and a Floquet’s analysis would be necessary, and a second one in the transonic region where the shock would be attached to the sphere. Although the physics might significantly change in the latter, due to the low Reynolds number range under consideration this second unexplored region is expected to be very narrow (Nagata et al.
Reference Nagata, Nonomura, Takahashi and Fukuda2016).
Flow case at
 $Re=280$
and
 $M=1.2$
for the stable axisymmetric base flow. Three-dimensional view of the iso-surfaces of the (a) streamwise, (b) radial and (c) azimuthal perturbation velocities associated with the unstable mode at
 $(\unicode[STIX]{x1D70E},St)=(-0.0101,0.0)$
plotted for the levels
 $v_{x}^{\prime }=\pm 0.02$
,
 $v_{r}^{\prime }=\pm 0.005$
and
 $v_{\unicode[STIX]{x1D703}}^{\prime }=\pm 0.005$
, respectively.

Evolution of the regular and supercritical Hopf bifurcations with the Mach and Reynolds numbers. The coloured regions represent stable axisymmetric base flow solutions (dark grey region and full circle symbols), unstable axisymmetric base flow solutions characterized by temporally amplified non-oscillatory planar-symmetric modes (light grey region and empty circle symbols) and unstable planar-symmetric base flow solutions characterized by temporally amplified oscillatory planar-symmetric modes (white region and empty triangle symbols).

For increasing values of the Mach number, the regular and Hopf bifurcations seem to move towards higher values of Reynolds numbers. However, for a sufficiently high Reynolds number (i.e. for approximately
 $Re>345$
) and if the narrow transonic region not examined is ignored, only a supercritical Hopf bifurcation exists and for increasing Mach number the base flow solution directly passes from an unstable planar-symmetric configuration characterized by temporally amplified oscillatory modes to a stable axisymmetric one, as seen by Nagata et al. (Reference Nagata, Nonomura, Takahashi and Fukuda2016).
Growth rate (
 $\unicode[STIX]{x1D70E}$
) and Strouhal number
 $(St)$
, Reynolds and Mach number evolution of the most temporally amplified/least temporally damped eigenvalue. Both growth rate and Strouhal numbers have been multiplied by 10.
5.4 Convective instabilities
(a) Eigenspectrum in the
 $St$
–
 $\unicode[STIX]{x1D70E}$
plane for the case at
 $(Re,M)=(370,1.2)$
. The inset shows the Reynolds evolution of the two modes leaving the continuous branch. For the mode at
 $(\unicode[STIX]{x1D70E},St)=(-0.378,0.166)$
, the contours of the (b) streamwise, (c) vertical and (d) transversal perturbation velocities are plotted for the levels
 $u^{\prime }=\pm 0.03$
,
 $v^{\prime }=\pm 0.01$
and
 $w^{\prime }=\pm 0.01$
, respectively.

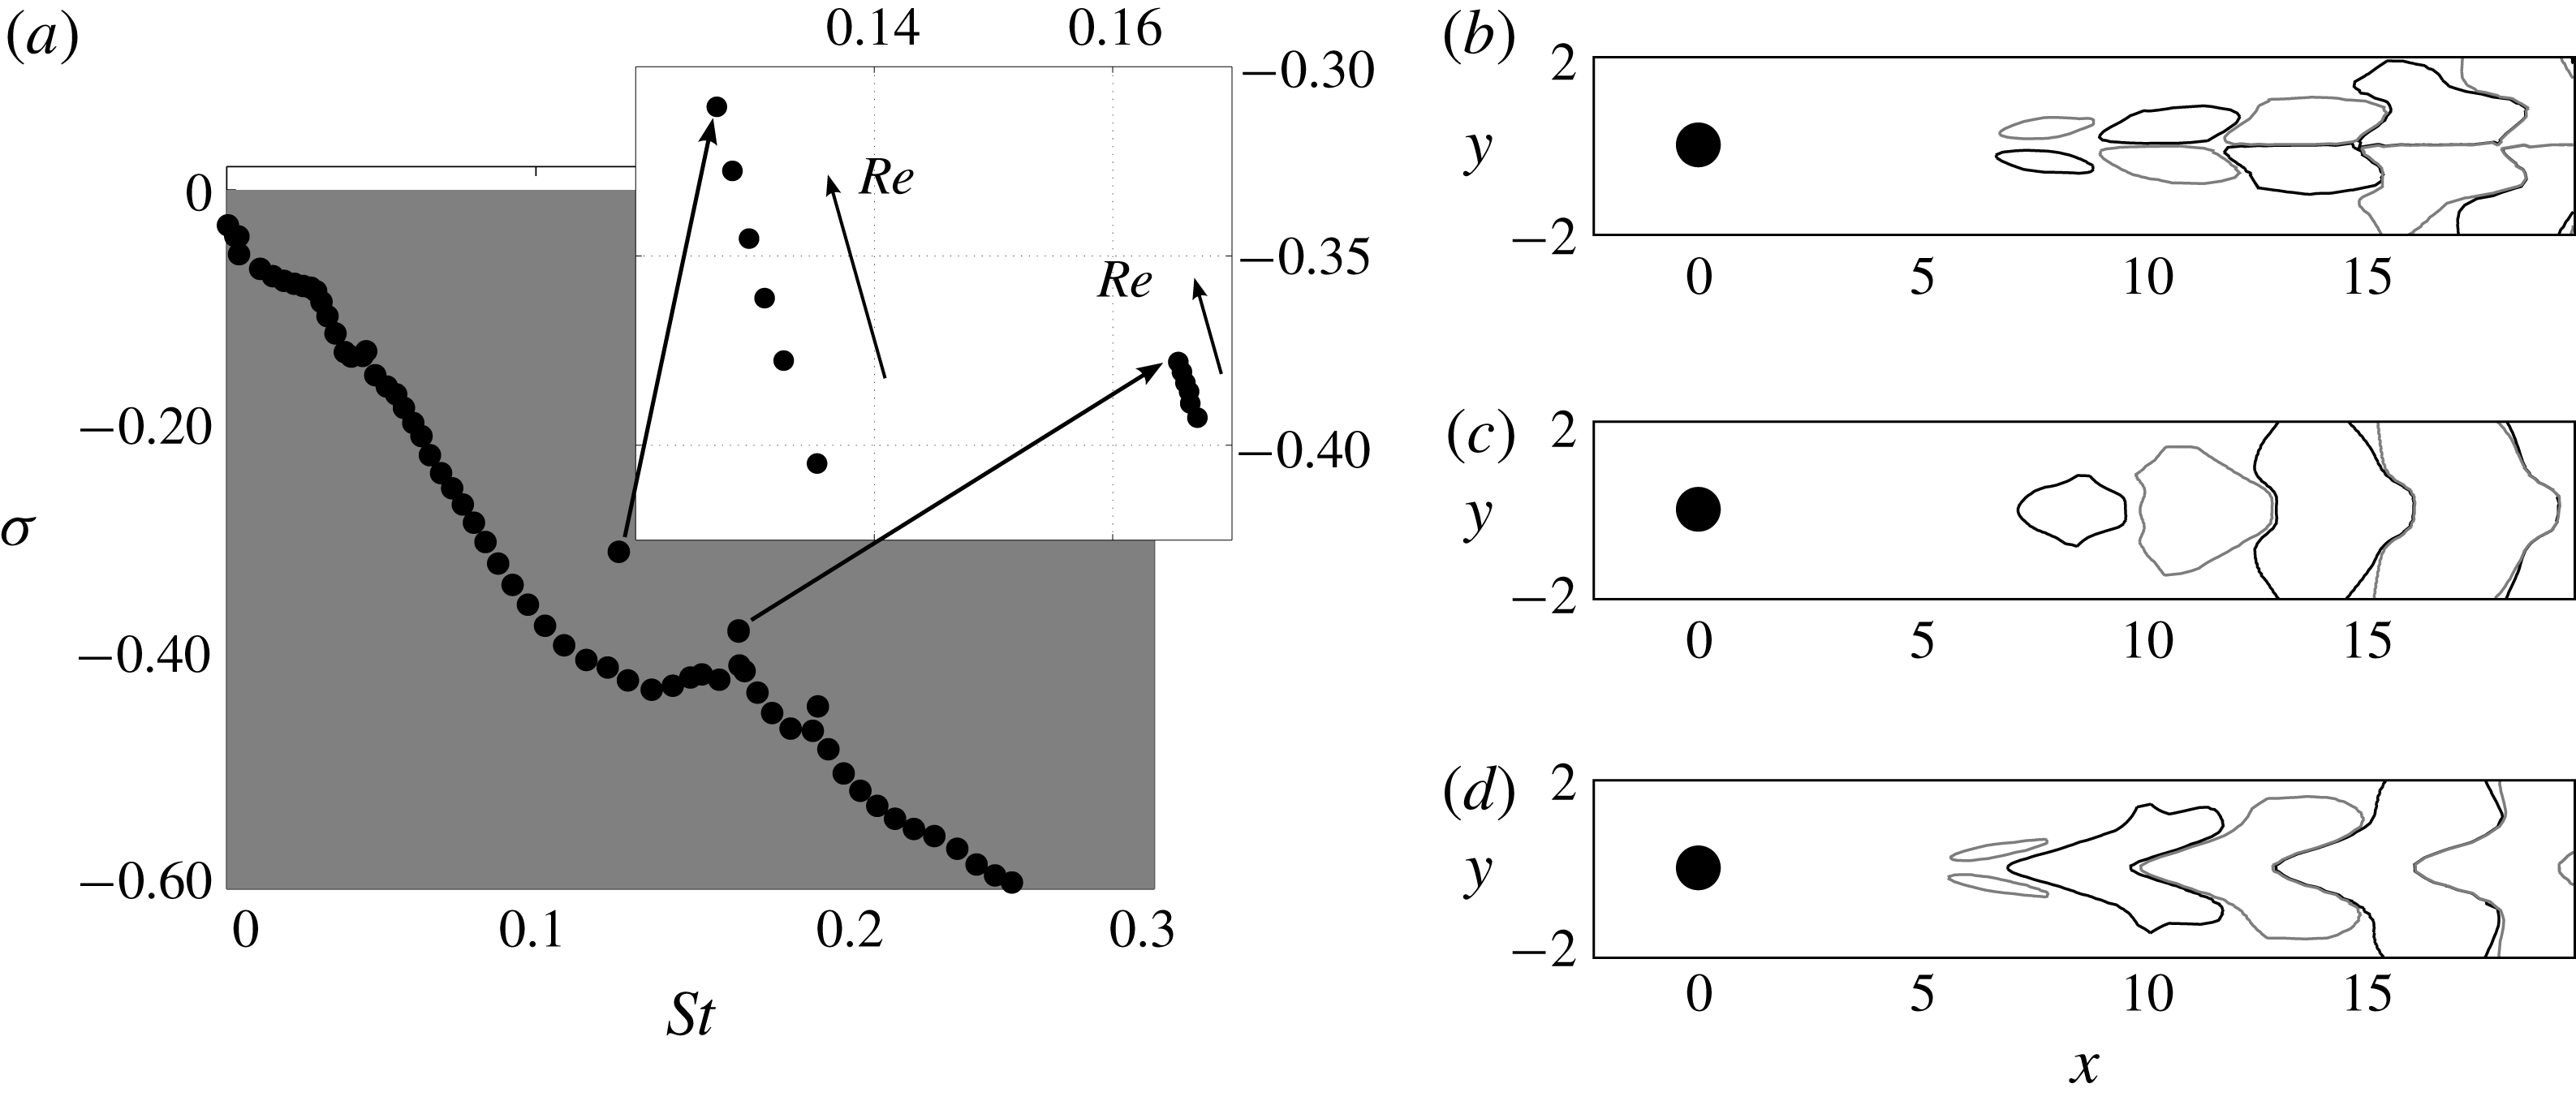
Figure 18 shows that, for the examined range of Reynolds numbers, the supersonic flow configurations are globally stable. The system is no longer a self-sustained oscillator and switches to a noise-amplifier type. To characterize the convective nature of the system, the case at
 $(Re,M)=(370,1.2)$
is selected, being the expected most convectively unstable one. The corresponding eigenspectrum is shown in figure 19(a), for positive Strouhal values only. As visible from figure 15(b) for the case at
 $(Re,M)=(280,1.2)$
, the continuous branch does not change and the two modes at
 $(\unicode[STIX]{x1D70E},St)=(-0.405,0.135)$
and
 $(\unicode[STIX]{x1D70E},St)=(-0.393,0.167)$
move away and reach
 $(\unicode[STIX]{x1D70E},St)=(-0.3106,0.1268)$
and
 $(\unicode[STIX]{x1D70E},St)=(-0.378,0.166)$
. The inset in figure 19(a) shows the evolution of these two modes in the Reynolds number range investigated at
 $M=1.2$
. In qualitative agreement with Nagata et al. (Reference Nagata, Nonomura, Takahashi, Mizuno and Fukuda2018), if a linear trend with the Reynolds number is assumed these two modes would become globally unstable for a Reynolds number range of
 $Re=1000\pm 300$
. These two modes have a very similar spatial distribution and, only for the mode at
 $(\unicode[STIX]{x1D70E},St)=(-0.378,0.166)$
, the contours of the streamwise, normal and transversal perturbation velocities are plotted in figures 19(b), 19(c) and 19(d), respectively.
To study the convectively unstable character of the flow case at
 $(Re,M)=(370,1.2)$
, an unsteady nonlinear simulation has been carried out by restarting the calculation from the axisymmetric base flow solution presented in § 5.2 (figure 12
f) and applying a Gaussian random white noise forcing. The white noise forcing is introduced upstream of the bow shock that forms in front of the sphere according to
 $$\begin{eqnarray}u(x,y,z,t)=A_{o}\exp \left[-\frac{(x-x_{f})^{2}}{2\unicode[STIX]{x1D70E}_{x}^{2}}-\frac{(y-y_{f})^{2}}{2\unicode[STIX]{x1D70E}_{y}^{2}}-\frac{(z-z_{f})^{2}}{2\unicode[STIX]{x1D70E}_{z}^{2}}\right]W(x,y,z,t).\end{eqnarray}$$
The forcing is applied continuously and localized spatially by a Gaussian function centred in
 $(x_{f},y_{f},z_{f})=(-5,0,0)$
. The variances associated with the spatial Gaussian distributions in the three spatial directions
 $(\unicode[STIX]{x1D70E}_{x},\unicode[STIX]{x1D70E}_{y},\unicode[STIX]{x1D70E}_{z})$
are adjusted to have a 3-D ellipsoid that approximately extends
 $(2,3,3)\times D_{s}$
in the streamwise, vertical and transversal directions, respectively. The applied perturbation amplitude
 $A_{o}$
corresponds to a turbulent intensity, measured as the ratio between the root-mean-square (r.m.s.) value of the streamwise perturbation velocity and its mean value at the centre of the forcing region, of
 $Tu\approx 0.1\,\%$
. The numerical white noise
 $W(x,y,z,t)$
varies in the range
 $[-0.5,0.5]$
around the zero mean and it varies for each spatial point and each time iteration. The forcing is ramped up to full strength after about an eighth of a flow-through time. Numerical artefacts, such as grid resolution and time-step size, limit the frequency band of the dynamic response above
 $St=1$
. Therefore, the plots have been cut at this value above which the response for the present analysis is not relevant.
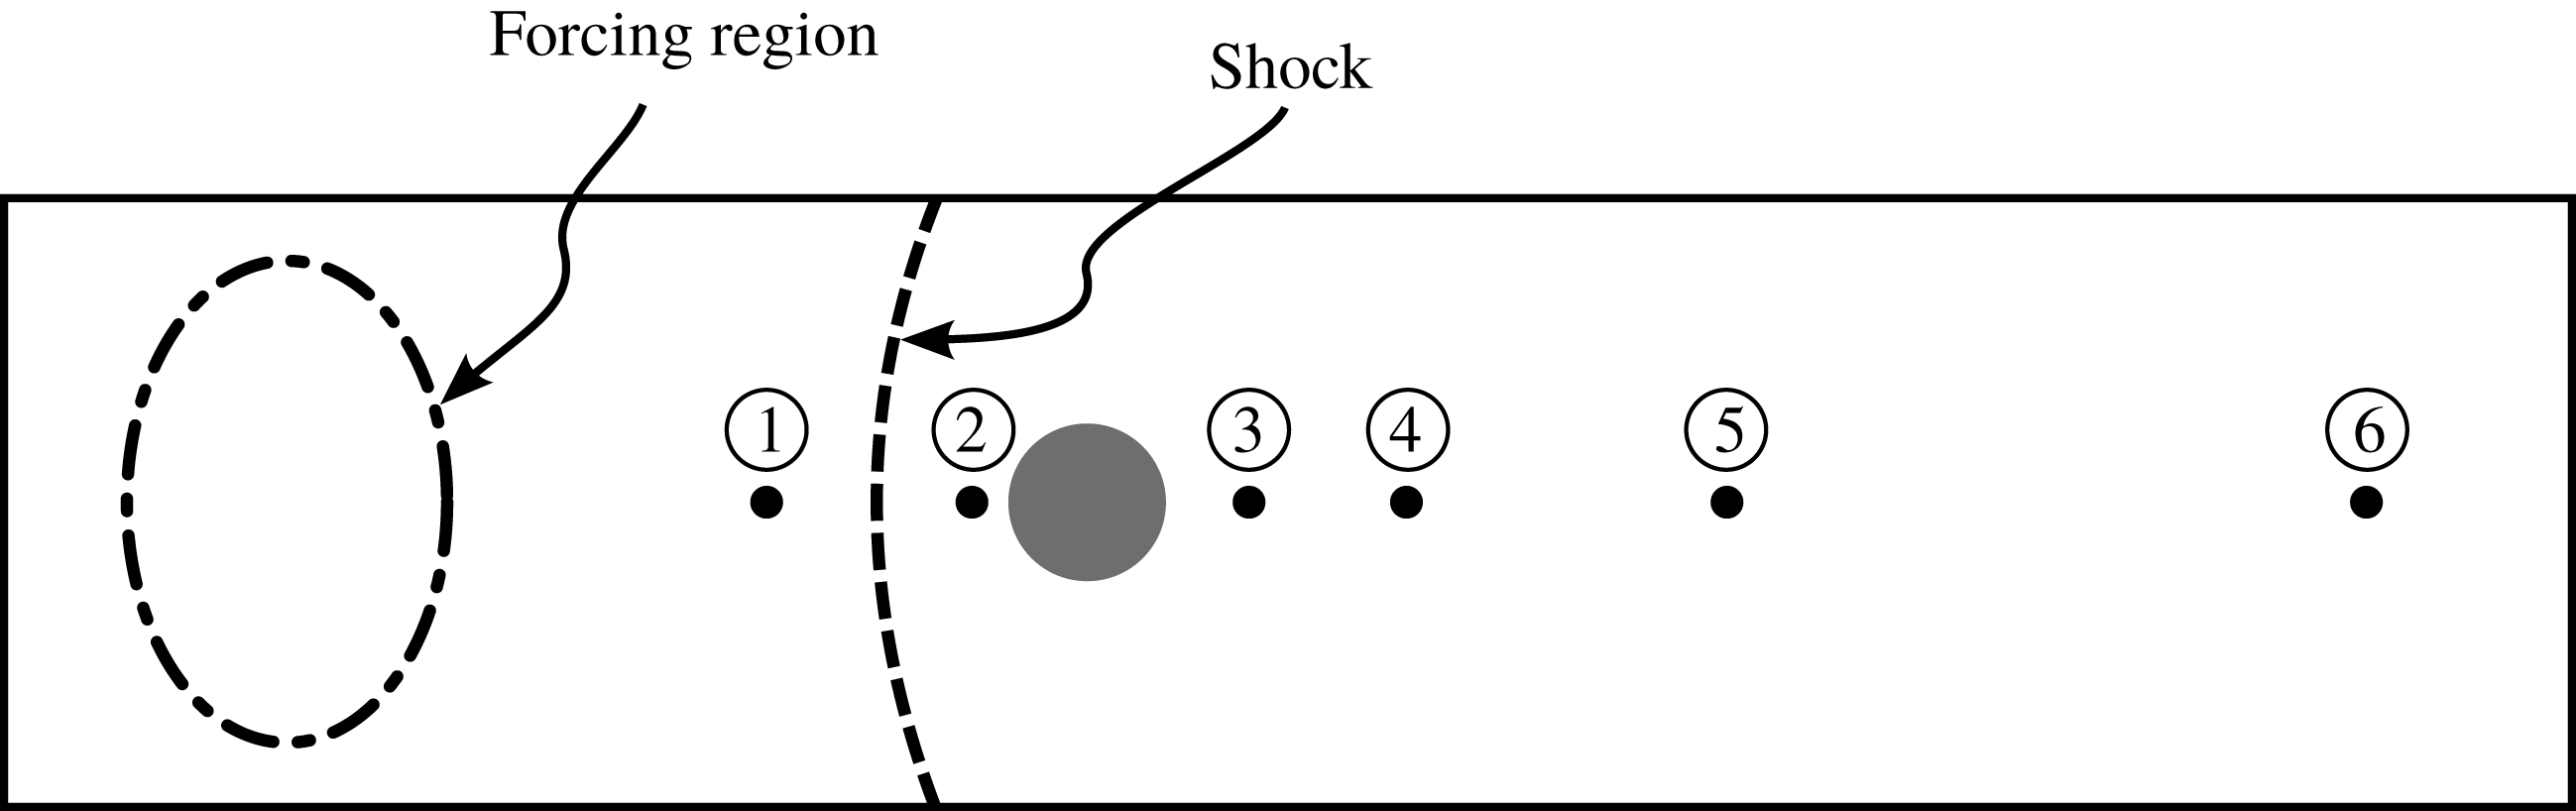
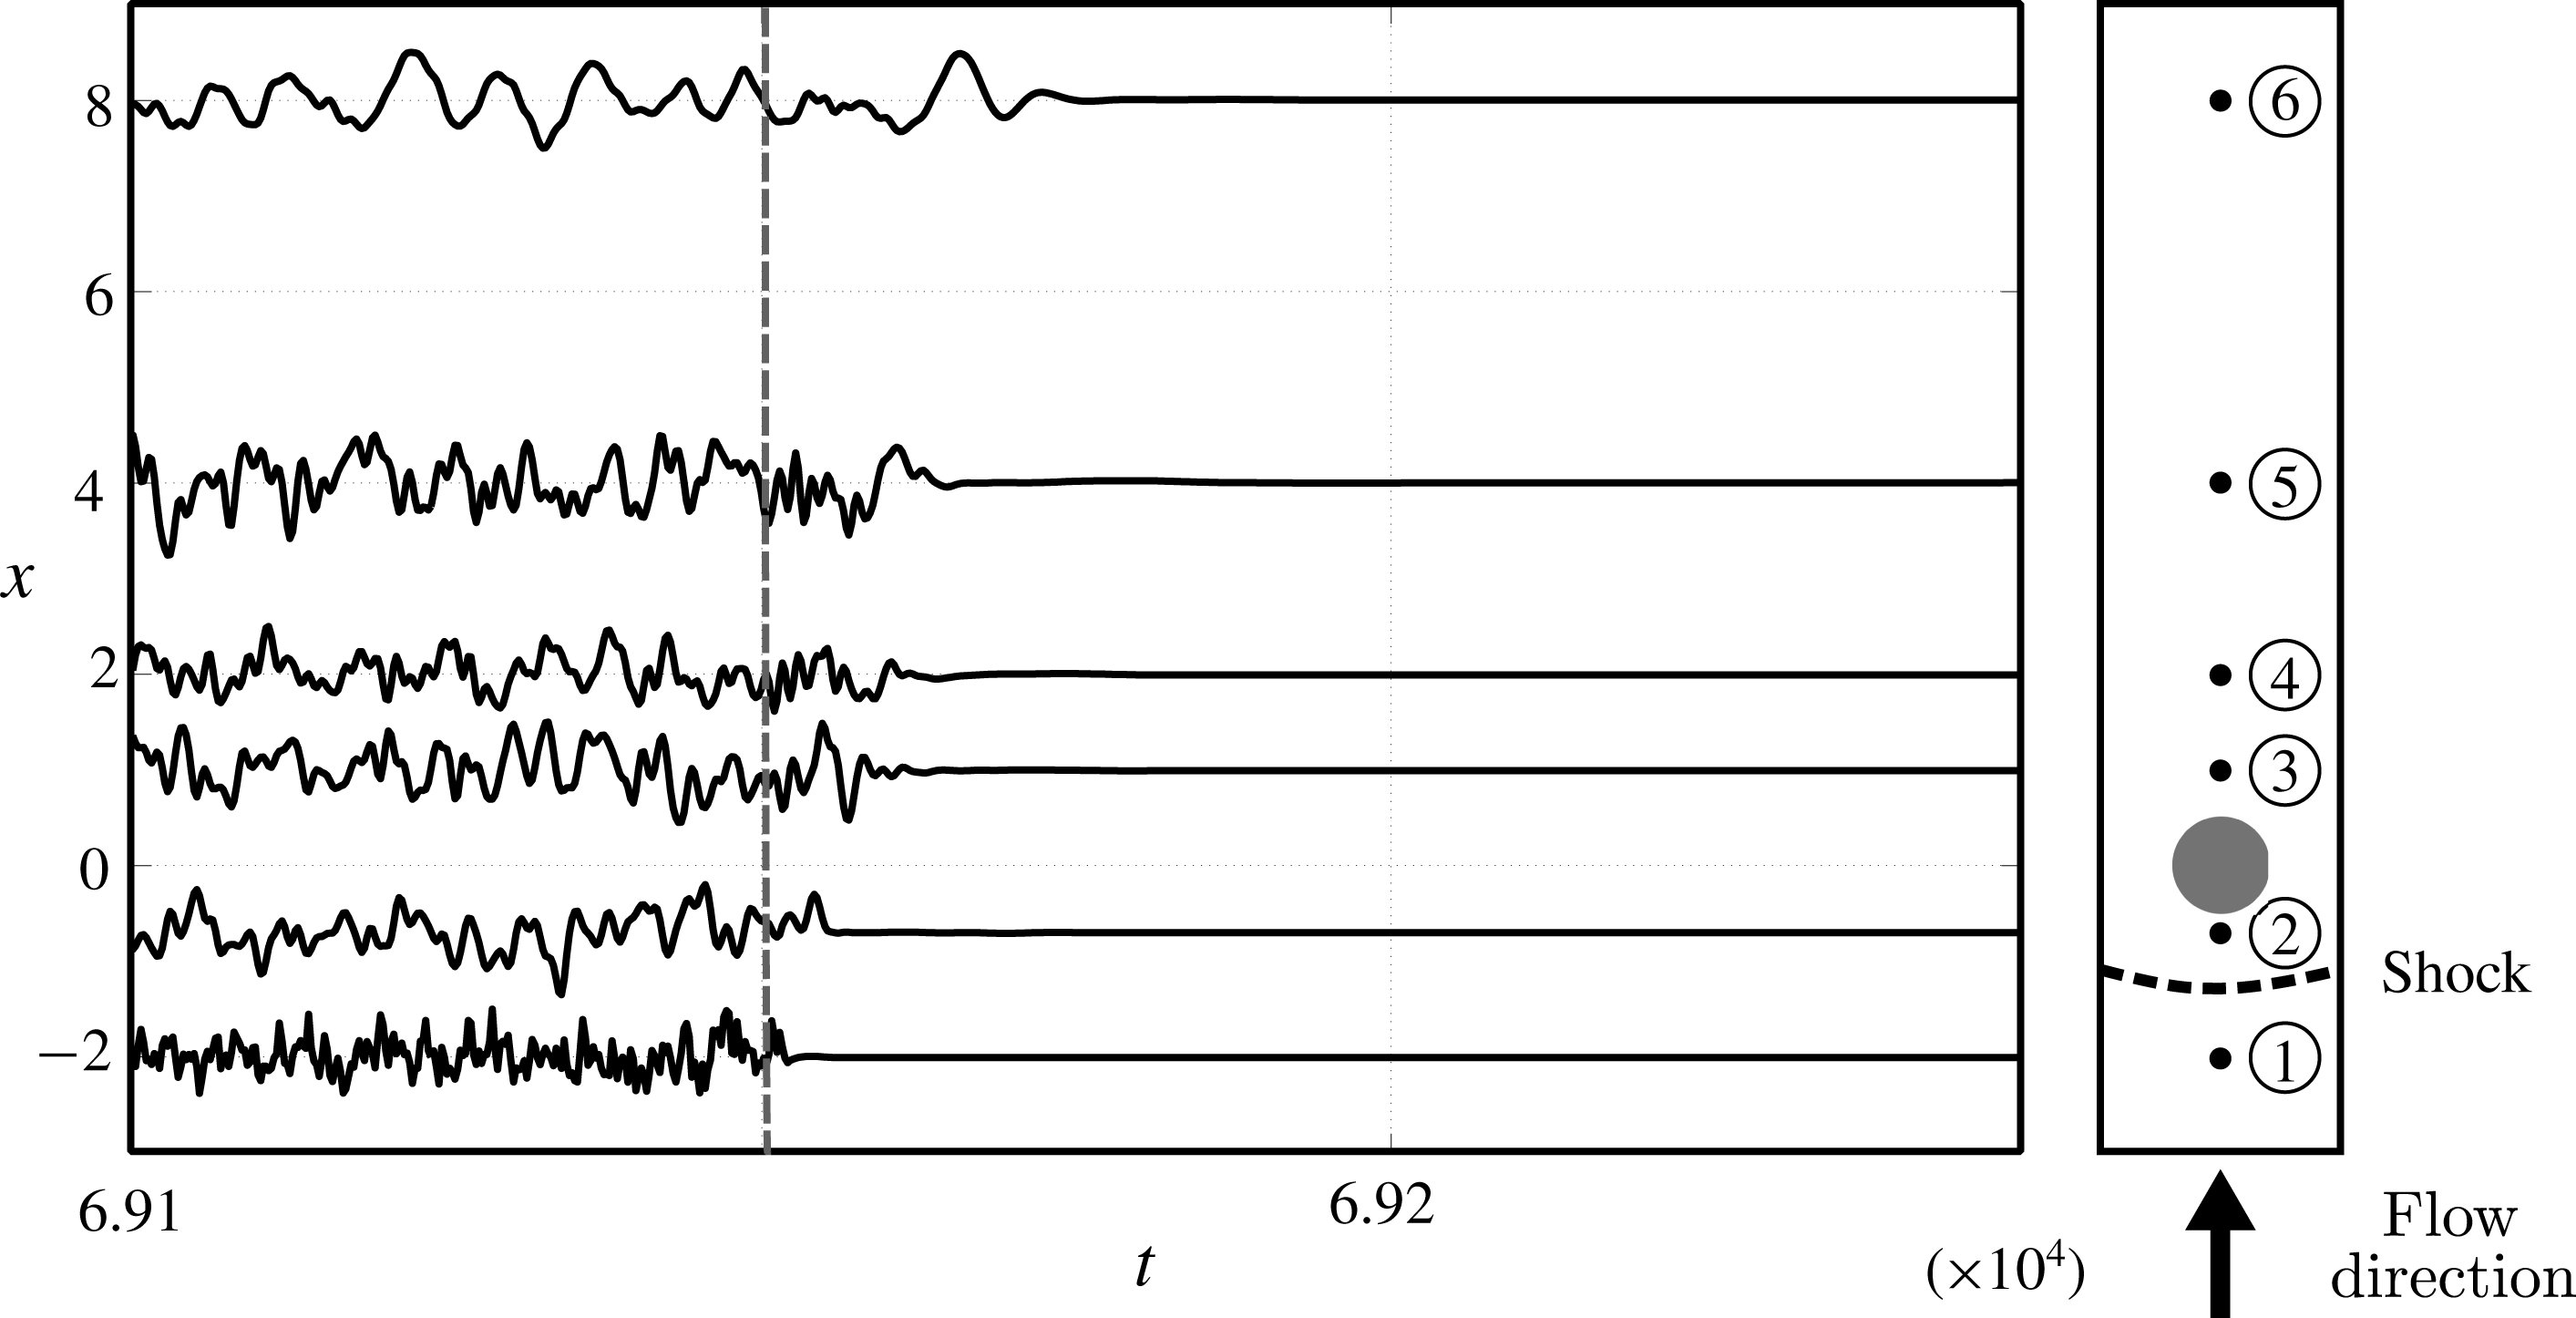
Spatial distribution of the probes used to monitor the time response of the system. Probe 1:
 $(x,y,z)=(-2.0,0.0,0.0)$
; probe 2:
 $(x,y,z)=(-0.7,0.0,0.0)$
; probe 3:
 $(x,y,z)=(1.0,0.0,0.0)$
; probe 4:
 $(x,y,z)=(2.0,0.0,0.0)$
; probe 5:
 $(x,y,z)=(4.0,0.0,0.0)$
; probe 6:
 $(x,y,z)=(8.0,0.0,0.0)$
.

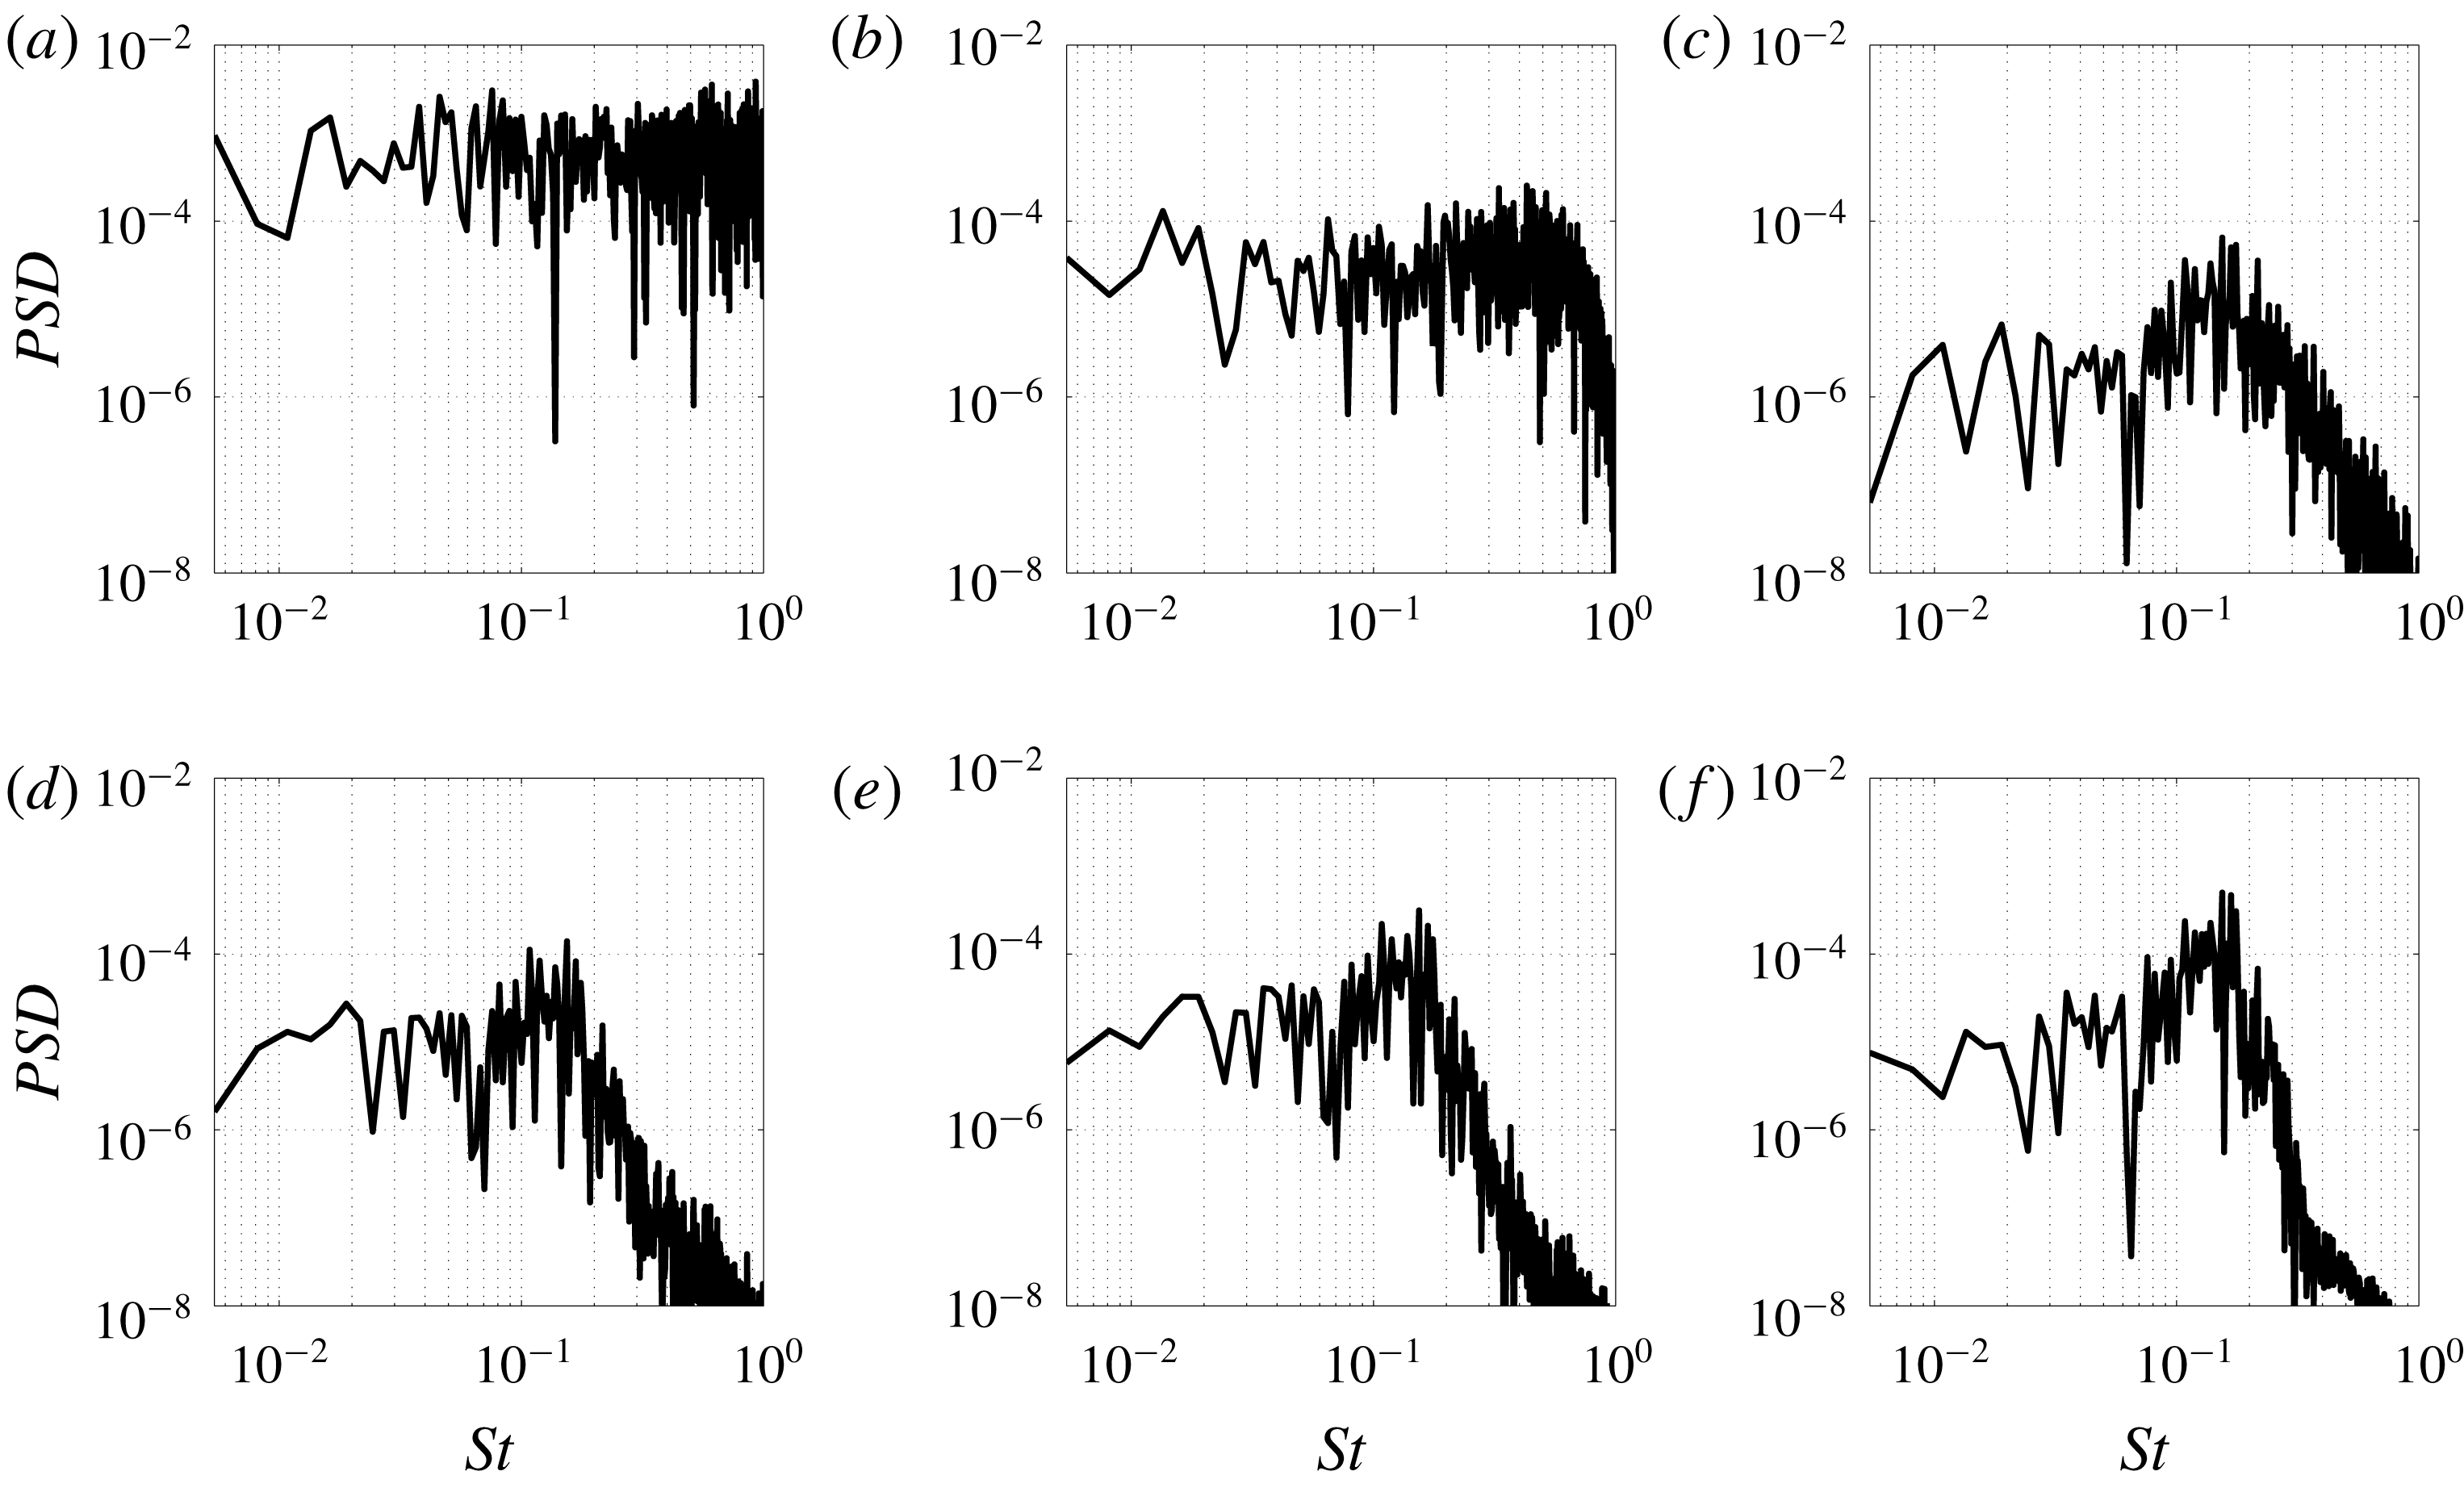
Fourier analysis performed on the time histories recorded on the monitoring probes (probe 1 – a; probe 2 – b; probe 3 – c; probe 4 – d; probe 5 – e; probe 6 – f). Power spectral density as a function of the Strouhal number.

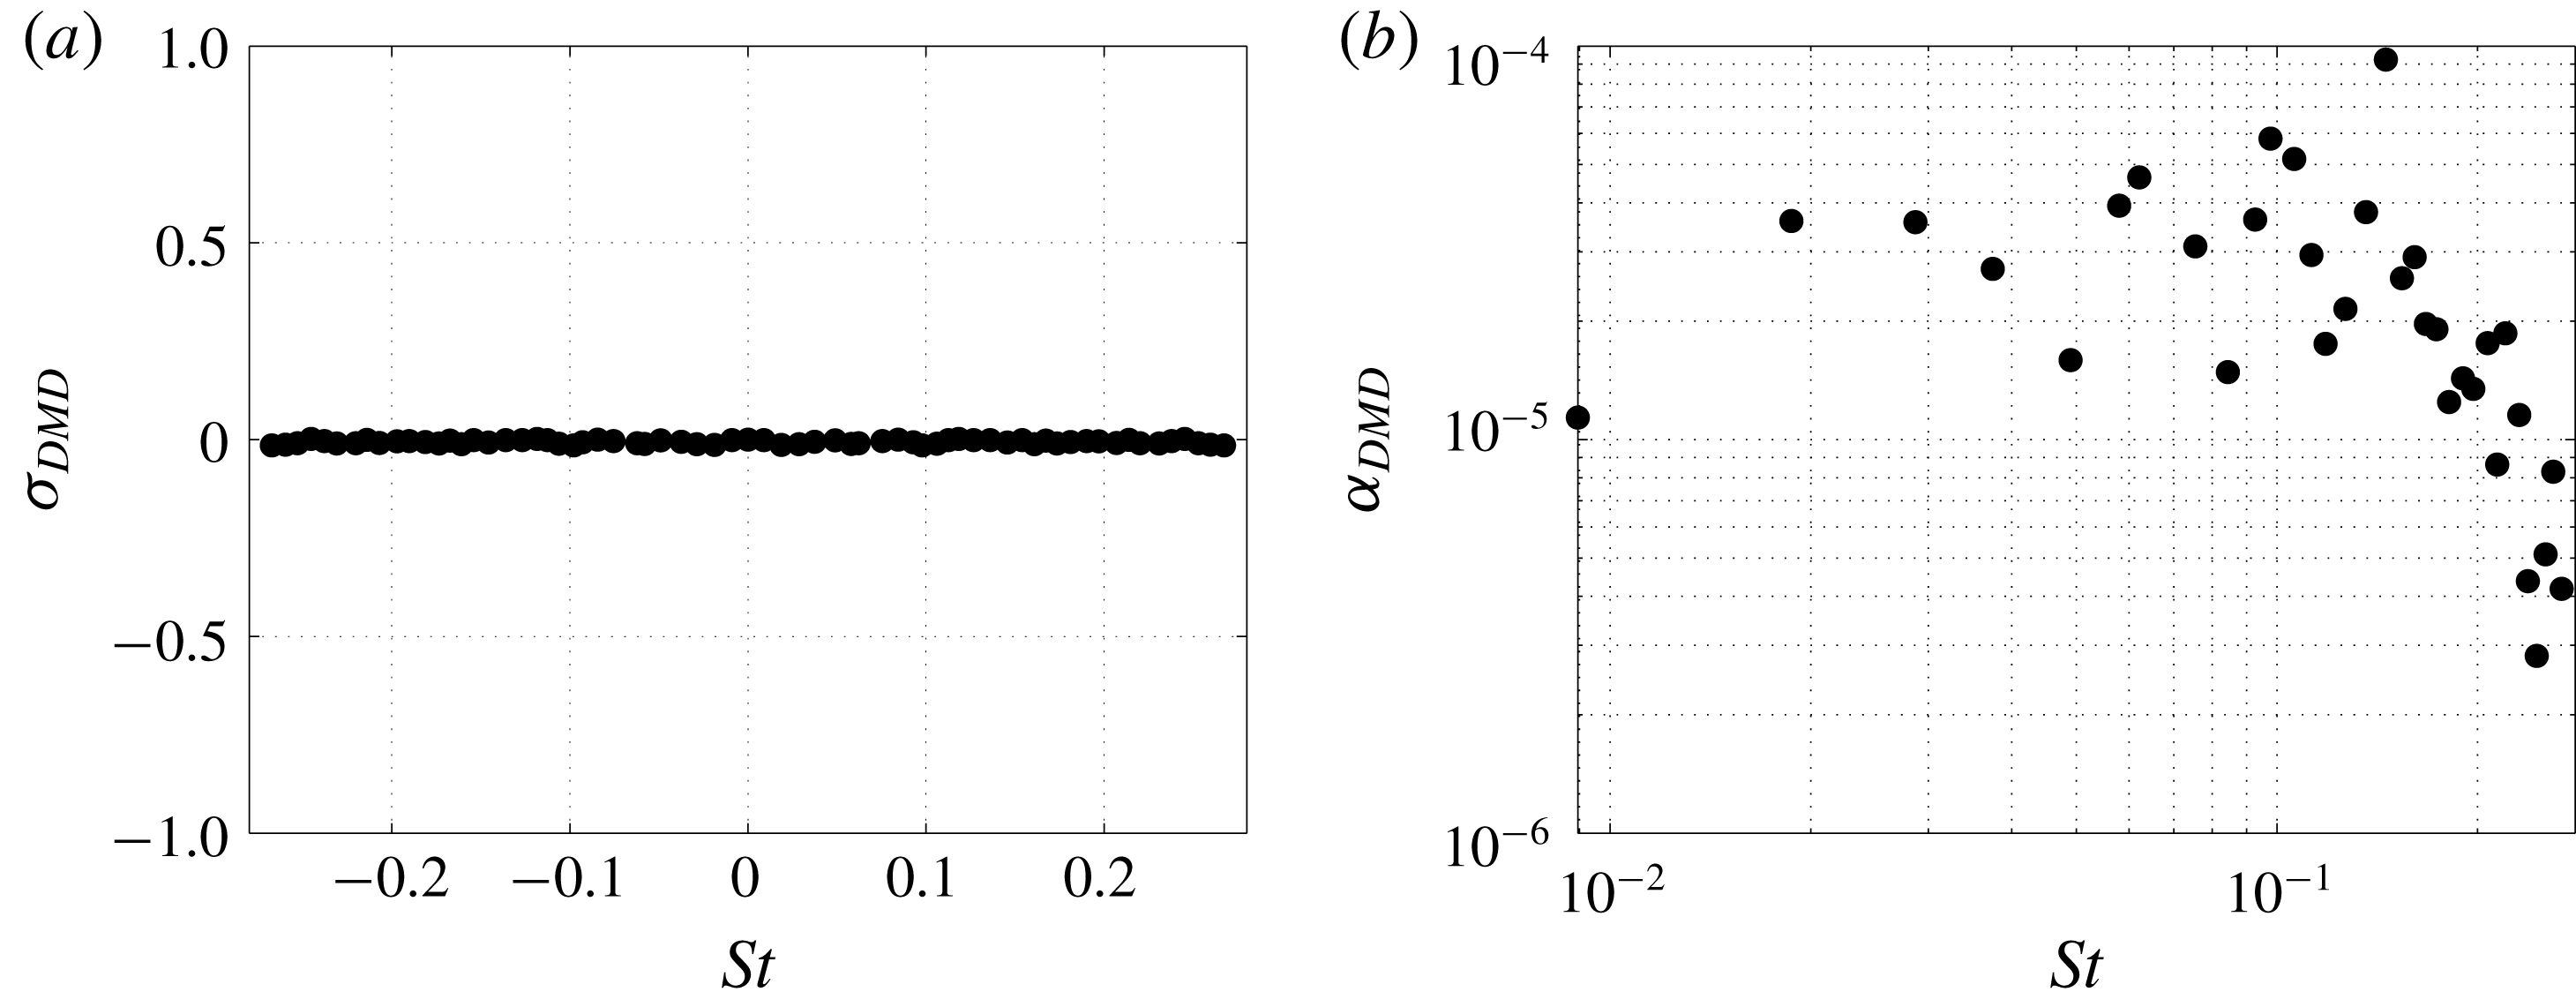
DMD analysis: (a) growth rate and (b) amplitude of the DMD modes as a function of the Strouhal number. The contribution of the mean flow is not taken into account.

The time response of the system is monitored by six probes located on the streamwise axis at different
 $x$
-locations and four ones located on the circular separation line in the downstream half of the sphere and azimuthally separated every
 $90^{\circ }$
. Since the results show an azimuthally independent behaviour, only the probes along the streamwise axis are here presented. Figure 20 shows the location of the six probes considered, the bow shock location and the spatial distribution of the applied random forcing. After an initial transient, the time histories are recorded for approximately 16 flow-through times and a Fourier analysis is performed. The power spectral density (
 $PSD$
) distribution as a function of the Strouhal number is plotted in figure 21 for the monitored probes. The perturbation reaches the shock and maintains its white noise features (probe 1, figure 21
a). The bow shock acts like a low-pass filter, cutting all the frequencies above
 $St\approx 0.5$
and reducing the energy of approximately one order of magnitude (probe 2, figure 21
b). The sphere then selects a frequency at a Strouhal number of
 $St\approx 0.15$
and a peak appears (probe 2, figure 21
c). The energy associated with this peak increases in the downstream probes (probe 4 to 6, figure 21
e–f) and eventually saturates. However, the energy associated with the perturbations downstream of the sphere is low, the complete flow field conserves its axisymmetric characteristics and no evidence of transition in the wake exists. A dynamic mode decomposition (DMD) (Schmid Reference Schmid2010) is performed by taking 256 nonlinear snapshots during the same time interval used to record the probe time histories for the Fourier analysis. The ‘amplitude’ (
 $\unicode[STIX]{x1D6FC}_{DMD}$
) associated with each DMD mode is computed by projecting each mode on the first snapshot (Jovanovic, Schmid & Nichols Reference Jovanovic, Schmid and Nichols2014). To avoid to compromise the DMD mode amplitude calculations, the analysis is performed only on a subspace of the numerical domain that excludes the region where the white noise forcing is applied. The DMD growth rate (
 $\unicode[STIX]{x1D70E}_{DMD}$
) and amplitudes are reported in figure 22 as a function of the Strouhal number. Since the snapshots are taken in the limit cycle, the associated DMD growth rates are nearly zero (figure 22
a). However, the distribution of DMD amplitudes in figure 22(b) shows that not all modes contribute in the same way as the system dynamics. If the contribution of the mean flow (that obviously is the highest one) is not taken into account, the DMD amplitude distribution not only resembles the
 $PSD$
distributions in the sphere wake but it also shows that the highest contribution is given by the mode at a Strouhal number of
 $St=0.145$
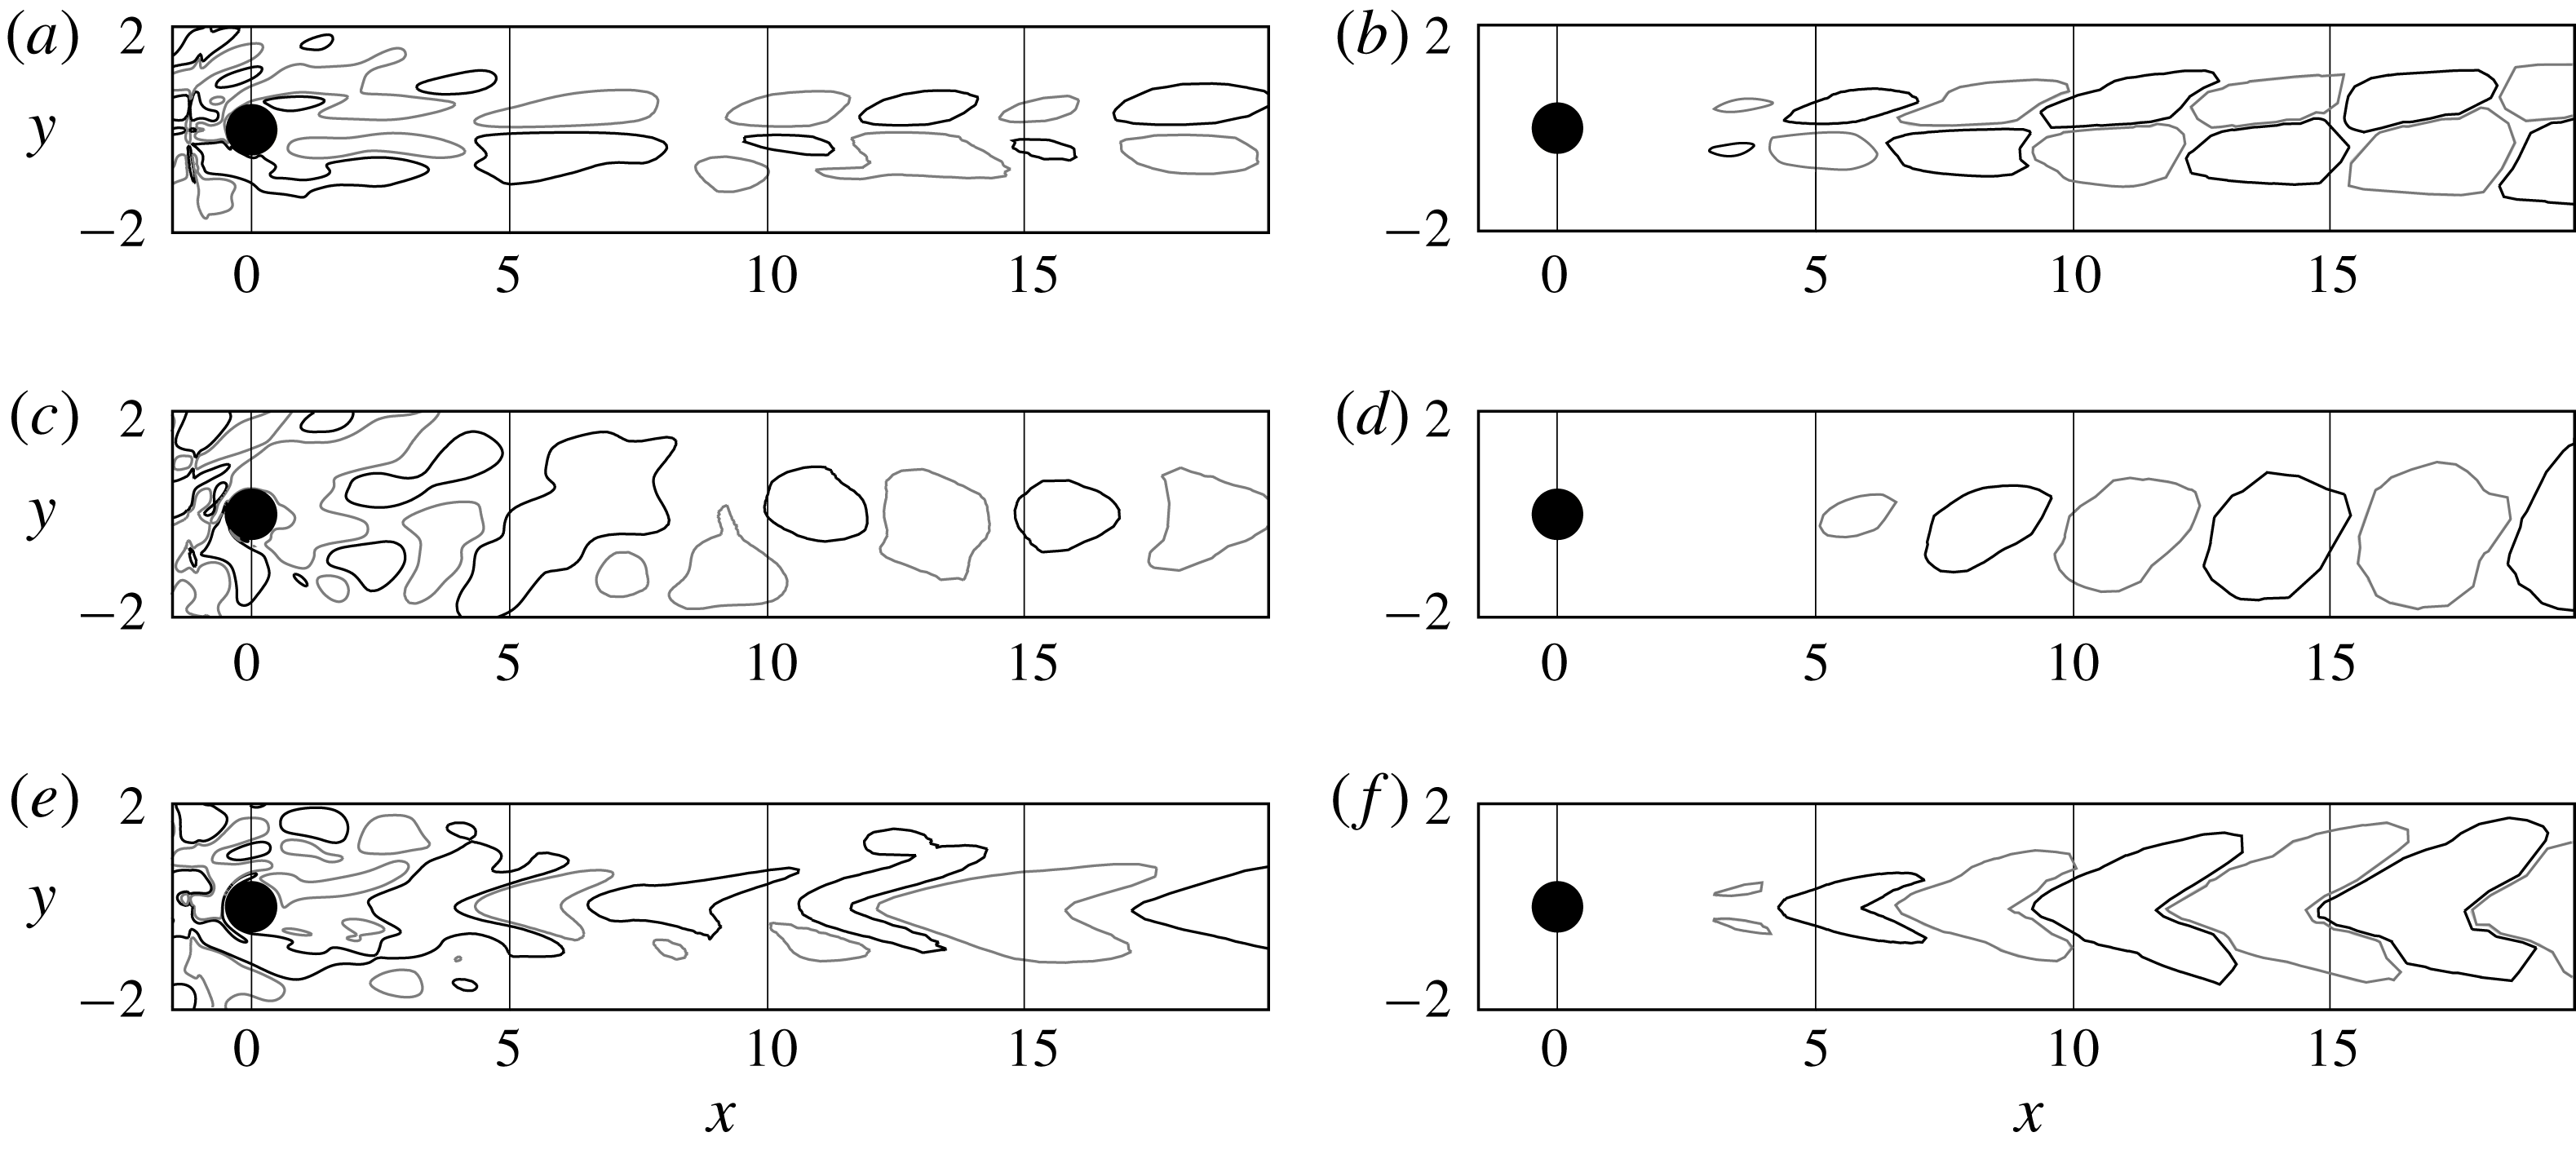
that closely matches the peak Strouhal number found in figure 21(c–f). It can be interesting to compare the perturbation velocity fields, from which the mean flow is subtracted, with the DMD mode velocities. Figure 23 reports the contours of the streamwise (a,b), vertical (c,d) and transversal (e,f) velocities on a longitudinal slice in the
 $x$
–
 $y$
plane for the perturbation field (a,c,e) and DMD mode at
 $St=0.145$
(b,d,f). While the near-wake region in the perturbation field is affected by the white noise forcing and no appropriate comparison can be made, for
 $x>5$
it is possible to appreciate that perturbation velocity field and DMD eigenmode velocities have a similar structure. This confirms that the DMD mode at
 $St=0.145$
is well capturing the perturbations dynamics. It is also interesting to see that the shape of the DMD mode strongly relates to what seen for the globally stable mode shown in figure 19(b–d) at a similar Strouhal number, suggesting a response of the system that is still very modal. Some similarities can be found between this mode and that found at
 $(Re,M)=(280,0.1)$
, especially in terms of shape and wavelength of the streamwise and transversal perturbation velocities (compare figures 8
c,d with figures 23
b,f). This might indicate that the response of the system to a sufficiently strong forcing or at higher Reynolds number could lead to the shedding of hairpin vortices from the sphere wake, like in the incompressible counterpart. To support this idea, the work by Nagata et al. (Reference Nagata, Nonomura, Takahashi, Mizuno and Fukuda2018) shows that unsteady hairpin shedding happens at
 $(Re,M)=(1000,1.2)$
. To verify the convective nature of the flow and its global stability, the white noise forcing is switched off and the total energy fluctuations time histories recorded by the probes in the sphere wake are reported in a
 $t$
–
 $x$
plot in figure 24. The time at which the forcing is switched off is indicated by a grey dashed line. It is possible to see that a packet of perturbations is convected downstream and damped in time. The total energy fluctuations go to zero and the base flow solution, from which the nonlinear calculation was restarted, is recovered.
6 Conclusions
The effect of compressibility on the global stability of a sphere flow has been investigated. The work by Meliga et al. (Reference Meliga, Sipp and Chomaz2010) is extended up to a low-supersonic regime taking into account of the three-dimensionality of the steady fixed point solutions around the supercritical Hopf bifurcation and the presence of shocks.
Comparison between the perturbation field (a,c,e) and DMD eigenmode at
 $St=0.145$
(b,d,f). Streamwise (a,b), vertical (c,d) and transverse (e,f) velocities.

Total energy fluctuations time histories in a
 $t$
–
 $x$
plot. The time at which the forcing is switched off is indicated by the vertical grey dashed line. The sphere, shock and probe locations are sketched on the right-hand side.

The linear dynamics is first analysed at nearly incompressible conditions and the regular and supercritical Hopf bifurcations are described. The three-dimensionality of the fixed point solutions used to study the Hopf bifurcation is found to not have a significant impact on the identification of the instability threshold or on the Strouhal number of the leading mode. However, the spatial structure of the eigenmode perturbations is deflected accordingly to the planar-symmetric sphere wake, consistently with the investigations by Citro et al. (Reference Citro, Siconolfi, Fabre, Giannetti and Luchini2017) in the incompressible regime. This indicates the importance of removing the axisymmetric flow assumptions adopted in most of the previous studies and the need to consider fully 3-D fixed point solutions. The question concerning the correctness of the predicted shedding frequency by linear stability performed on a fixed point solution is also addressed. When the linear stability analysis is performed on the mean flow for some cases above the supercritical Hopf bifurcation, the predicted shedding frequency closely matches the nonlinear one. Although the shedding frequencies predicted by the global stability analysis on fixed point and mean flow solutions do not diverge for increasing Reynolds number above the bifurcation threshold as fast as seen for the two-dimensional cylinder case (Barkley Reference Barkley2006), it is important to consider this aspect depending on the type of analysis intended. When the identification of the bifurcation threshold (or in general the stability of the flow) is not needed, a global stability analysis performed on the mean flow solution as a base flow might be more appropriate for establishing the frequencies associated with the nonlinear dynamics.
To explain the observations of the nonlinear DNS calculations of Nagata et al. (Reference Nagata, Nonomura, Takahashi and Fukuda2016, Reference Nagata, Nonomura, Takahashi, Mizuno and Fukuda2018), the bifurcation boundaries are followed in a
 $Re$
–
 $M$
space. In agreement with the work of Meliga et al. (Reference Meliga, Sipp and Chomaz2010), an initial destabilizing effect of the Mach number is found around the supercritical Hopf bifurcation. However, when the Mach number is further increased to supersonic speeds, it is possible to conclude that the Mach number has a stabilizing effect on the global behaviour of the flow and the thresholds of the two bifurcations move towards higher Reynolds numbers. For sufficiently high Reynolds numbers, when the Mach number is increased the solution directly passes from an unsteady planar-symmetric solution to a steady axisymmetric one for supersonic speeds.
At supersonic conditions, the flow becomes globally stable and the system switches from an oscillator to a noise amplifier. A forced nonlinear calculation is carried out to characterize the convective nature of the flow and the performed Fourier and DMD analyses indicate that a link with the incompressible dynamics above the incompressible Hopf bifurcation might exist. This is partially supported by the nonlinear DNS calculations by Nagata et al. (Reference Nagata, Nonomura, Takahashi, Mizuno and Fukuda2018), who show that the transition to an unsteady wake at supersonic speeds happens via hairpin vortices shedding when the Reynolds number is significantly increased. A definite confirmation would come by global stability calculations at higher Reynolds numbers and a continuation of this work shall be therefore focused on the study of cases in this regime. Another continuation of this work could interest cases at higher Mach numbers, where the flow dynamics might change due to a bow shock that gets closer to the sphere.
Although limited to laminar flow cases, the present work represents a necessary preliminary step towards the study of the turbulent regime, for which large-scale coherent motions persist. In the nearly incompressible limit, Taneda (Reference Taneda1978) shows that the turbulent wake of a sphere exhibits a wave-like motion similar to the one observed in the laminar case. By adding an artificial viscosity to account for the turbulent small scales, a linear stability analysis carried out on the mean flow (Beneddine et al. Reference Beneddine, Sipp, Arnault, Dandois and Lesshafft2016) could also represent an interesting extension of the present results to turbulent regimes.
Acknowledgements
This work was supported through the ATAC (Aérodynamique des Tuyéres des Arriéres-Corps) Group of the French Centre National d’Études Spatiales (CNES). Computer time was provided by GENCI TGCC Supercomputer Curie under the project A0032A06362.
Appendix
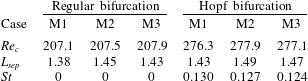
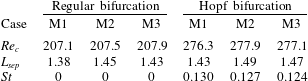
The sensitivity of the global stability analysis to grid resolution and domain size is here examined. To study the effect of the mesh resolution, the numerical grid used for all calculations in the paper (case M1) has been refined by
 ${\approx}30\,\%$
in all directions on the same domain presented in § 4.1 (case M2). Separately, the effect of the domain size has been analysed by increasing the domain in all direction and the selected dimensions are
 $(L_{x},L_{y},L_{z})=(40,20,20)$
. The numerical grid resolution for the domain size sensitivity study is
 $(n_{x},n_{y},n_{z})=(160\times 112\times 112)$
for each of the seven blocks and named M3 (note that the cell distribution in the two transverse direction has been differently stretched in order to keep similar resolution of the grid in the near-wake region). Critical Reynolds numbers, base flow separation lengths and Strouhal numbers of the leading mode at the regular and Hopf bifurcations are compared for the three numerical set-ups in table 6. Note that the base flow separation length at the Hopf bifurcation is averaged in the azimuthal direction. The differences between the sensitivity analyses are within 5 % and the selected grid resolution and domain size are therefore considered suitable for the physical significance of the study presented in this paper.
Grid and domain sensitivity analysis on the critical Reynolds number, base flow separation length and leading mode Strouhal number for the nearly incompressible cases at the two bifurcations. Case M1:
 $(n_{x},n_{y},n_{z})=(112,112,112)$
and
 $(L_{x},L_{y},L_{z})=(20,10,10)$
; case M2:
 $(n_{x},n_{y},n_{z})=(150,150,150)$
and
 $(L_{x},L_{y},L_{z})=(20,10,10)$
; case M3:
 $(n_{x},n_{y},n_{z})=(160,112,112)$
and
 $(L_{x},L_{y},L_{z})=(40,20,20)$
.