I. INTRODUCTION
Quasicrystals are a unique form of solid state between the crystalline and amorphous states. They show orientational symmetry but lack translational symmetry; their discovery greatly challenged conventional crystallographic concepts.Reference Shechtman, Blech, Gratias and Cahn1–Reference Tsai3 Quasicrystals normally show high hardness and/or high electrical resistivity because of their special atomic arrangement.Reference Louzguine-Luzgin and Inoue4 They have the potential as reinforcement phases for compositesReference Inoue and Kimura5, Reference Singh, Nakamura, Watanabe, Kato and Tsai6 and/or as thermal barrier materials.Reference Dubois7 In addition, some quasicrystal materials show unique hydrogen storage features. A typical example is the ternary Ti45Zr38Ni17 quasicrystalline alloy, which shows a hydrogen-to-metal ratio of > 1.60.Reference Viano, Majzoub, Stroud, Kramer, Misture, Gibbons and Kelton8, Reference Takasaki and Kelton9 The underlying reason is that the Q phase contains a large proportion of interstices, which can accommodate interstitial hydrogen.Reference Viano, Majzoub, Stroud, Kramer, Misture, Gibbons and Kelton8, Reference Takasaki and Kelton9
In contrast to quasicrystals, metallic glasses (MGs) have no long-range order and possess a variety of unique properties such as high fracture strength, exceptional superplasticity in the supercooled liquid region and good soft magnetism.Reference Inoue10, Reference Wang, Dong and Shek11
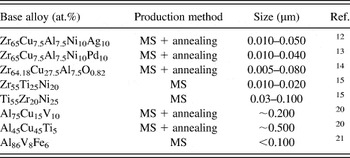
Quasicrystals do not often occur in MG-forming alloys but where they do they usually form as nanoscale quasicrystals (Table I).Reference Chen, Zhang, Inoue, Sakai and Sakurai12–Reference Murty, Kim, Kim and Hono15 Their formation in MG-forming alloys can be induced by the introduction of elements such as Ag (up to 5 at.%),Reference Chen, Zhang, Inoue, Sakai and Sakurai12 Pd (up to 35 at.%)Reference Chen, Zhang, Inoue, Sakai and Sakurai12 or O (up to 0.82 at.%).Reference Murty and Hono13, Reference Murty, Ping, Hono and Inoue14 Their nanoscale size hinders a thorough assessment of their microstructural characteristics and properties. Hence there has been a fundamental need to fabricate large-sized quasicrystals, analogous to the development of bulk metallic glasses (BMGs).
A summary of the Q phases reported in glass-forming alloys (MS: melt spinning).

Furthermore, even though quasicrystal has been reported in a number of Al alloys,Reference Tsai, Inoue and Masumoto16–Reference Grushko, Lemmerz, Fischer and Freiburg19 so far only a few studies have confirmed the formation of quasicrystals in Al-based MG-forming alloys (Table I).Reference Misra, Tiwari and Srivastava20, Reference Shek, He, Bian, Chen and Lai21 This is largely due to the difficulty of fabricating Al-based metallic glasses. Currently Al-based metallic glasses barely reach 1 mm despite more than 20 years of effort.Reference He, Poon and Shiflet22–Reference Yang, Yao, Zhang, Yang, Wang and Ma24 Al-based metallic glasses are thus regarded as marginal glass-forming alloys,Reference Wilde, Sieber and Perepezko25 in contrast to other bulk glass-forming systems such as those based on Pd, Zr and Mg.Reference Inoue, Nishiyama and Kimura26–Reference Ma, Shi, Xu, Li and Ma28
This study reports the finding of 10 μm-scale quasicrystals (Q) in a nitrogen gas-atomized MG-forming alloy Al85Ni5Y6Co2Fe2 (in at.% hereafter). The formation mechanism of the Q phase is discussed within the scheme of the stabilization mechanism for the Hume-Rothery phases,Reference Bancel and Heiney29, Reference Smith and Ashcroft30 and compared with the phase formation in a similar MG-forming alloy Al86Ni7Y4.5Co1La1.5. The stability of the Q phase is assessed by thermodynamic analysis in conjunction with TEM. The decomposition products of the Q phase are also examined.
II. EXPERIMENTAL
Nitrogen gas-atomized powders of Al86Ni7Y4.5Co1La1.5 and Al85Ni5Y6Co2Fe2 were analyzed. Powder particles around 60 μm in diameter of both alloys were selected as they are essentially fully crystallized according to a preliminary x-ray diffraction analysis. Additional details about the two metallic glasses can be found inReference Yang, Yao, Zhang, Yang, Wang and Ma24, Reference Yan, Wang, Schaffer and Qian31 and,Reference Dong, Hou, Chang, Quan and Wang32 respectively. Scanning electron microscopy (SEM, JEOL 7001, JEOL Ltd., Tokyo, Japan, operated at 15 kV) and TEM (FEI Tecnai F20, FEI, Hillsboro, OR, operated at 200 kV) were used for microstructural characterization, where the TEM samples were prepared by focused ion beam (FIB, FEI xT Nova Nanolab 200, FEI, Hillsboro, OR) with a Ga ion source. Prior to FIB operation, powders were bonded by resin. They were then surface-polished and coated with gold to reduce the charging effect and enhance the sample stability under the ion beam. During the FIB operation, Pt was first deposited at preselected areas of the sample to protect them from the Ga+ implantation (at 30 kV). The beam current was applied in a step-down fashion (e.g., 3 nA, 0.3 nA, and 0.1 nA) to progressively remove any damaged layer from previous operations. This ensures that ion implantation is detectable only in the top (e.g., the Pt deposited layer) and bottom layers and/or cut-off side edges of the sample. The FIBed samples are ∼ 20 μm × 6 μm × 0.1 μm, providing a large area for TEM analysis. The samples were transferred to carbon-supported Cu grids by a lift-up facility. Since the alloy powders analyzed in this study are fully crystallized and have good thermal conductivity, the influence of the FIB operation (FIB-induced heat) on the microstructure is trivial. This differs from preparing fully amorphous TEM samples using FIB. A detailed discussion of minimizing the FIB damage to TEM samples can be found in Refs. Reference Choi, Kwon, Kim and Al-Lassab33, Reference Kato34.
TEM selected area electron diffraction (SAED) was used for phase identification, with an energy-dispersive x-ray (EDX) spectrometer for compositional analysis (error band: ±5 at.%). Convergent beam electron diffraction (CBED) was employed to assist in the phase identification when the TEM sample was thick and not easy for normal SAED operation. The stability of the Q phase was investigated using differential scanning calorimetry (DSC), in conjunction with TEM. Heat treatment of the Al85Ni5Y6Co2Fe2 powder was conducted within the DSC furnace under high-purity argon flow.
III. RESULTS
A. Quasicrystal discovered in the as-atomized Al85Ni5Y6Co2Fe2
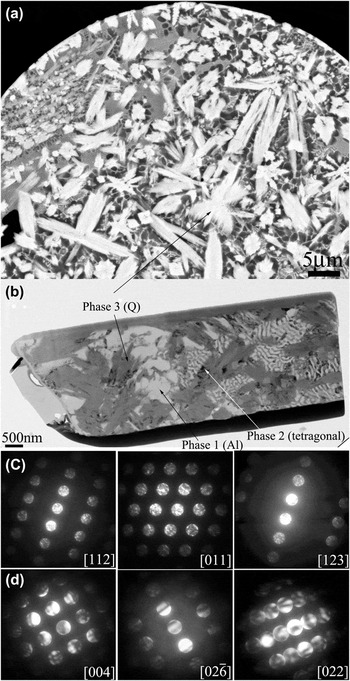
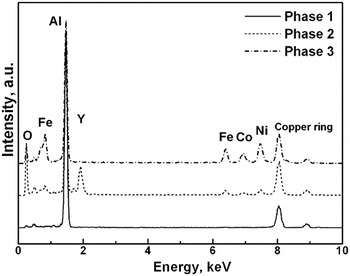
Figure 1(a) shows the microstructure of an Al85Ni5Y6Co2Fe2 powder particle by SEM backscattered electron (BSE) imaging. Three major phases are revealed. Figure 1(b) is a TEM bright-field (BF) image detailing the three phases, denoted as Phase 1, Phase 2 and Phase 3. The TEM-EDX analysis results are shown in Fig. 2, indicating that Phase 1 is almost pure Al, with an approximate composition of Al98.6Ni0.1Fe0.1Co0.1O1.2, while Phase 2 and Phase 3 are complex compounds having approximate compositions of Al65.5Y20.8Ni4.3Fe1.0Co0.8O7.4 and Al70.2Ni10.9Fe7.2Co5.4O6.3, respectively. Figure 1(c) presents the CBED analysis of Phase 1, confirming it is face-centered-cubic Al (FCC-Al; a = 0.405 nm). Phase 2 is a tetragonal Al-Y phase with lattice parameters a = 0.52 nm and c = 0.76 nm, Fig. 1(d). No information is available about this phase in the database of the Joint Committee on Powder Diffraction Standards (JCPDS). It is likely a new phase.
Microstructure of the as-atomized Al85Ni5Y6Co2Fe2 powder: (a) SEM-BSE image, (b) TEM-BF image of the FIB-prepared sample, (c) CBED results for Phase 1 (Al phase), and (d) CBED results for Phase 2 (Al-Y phase).

Typical TEM-EDX spectra for Phase 1 (Al), Phase 2 (Al-Y) and Phase 3 (Q phase) in the microstructure of the as-atomized Al85Ni5Y6Co2Fe2.

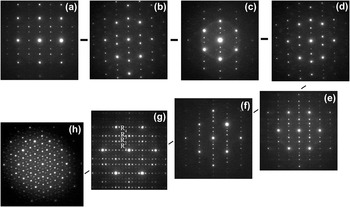
Details in Figs. 3(a)–3(h) are representative SAED patterns obtained for Phase 3 from tilting over a broad range of angles. They show distinctly different features compared with SAED patterns from conventional crystalline phases such as Phase 1 and Phase 2 (Fig. 1). These include
(i) The ratio of distances of each two adjacent rows of diffraction spots from the center, e.g. R2/R1 or R3/R2 in Fig. 3(g), oscillates around the Golden ratio 1.618, a unique feature for Q phasesReference Janot2; and
(ii) 10-fold symmetry, Fig. 3(h), a specific characteristic of decagonal Q phases.Reference Janot2, Reference He, Wu and Kuo35
(a)–(h) TEM-SAED results for Phase 3, the Q phase, in the as-atomized Al85Ni5Y6Co2Fe2 powder. The ratio of distances of each two adjacent rows of diffraction spots from the center such as R2/R1 or R3/R2 shown in (g) oscillates around 1.618. There is 10-fold symmetry in (h).

Phase 3 is therefore identified to be a decagonal Q phase with an approximate composition of Al70.2Ni10.9Fe7.2Co5.4O6.3. Its volume fraction is ∼ 30% [Fig. 1(a)].
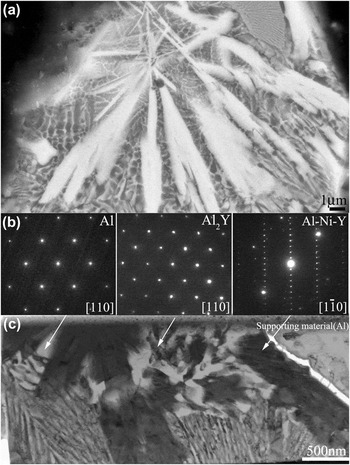
For comparison, a similar microstructural study was made of the powder particles of Al86Ni7Y4.5Co1La1.5 (∼60 μm), an MG-forming alloy similar to the Al85Ni5Y6Co2Fe2 in terms of alloy composition. The results are shown in Fig. 4. No Q phase was found. Instead, three crystalline phases were identified. These are FCC-Al (a = 0.405 nm), FCC-Al2Y (a = 0.786 nm) and an orthorhombic Al-Ni-Y phase (a = 1.28 nm, b = 0.39 nm and c = 1.58 nm), with approximate compositions of Al95.3Co0.1Ni0.2O4.4, Al67.0Ni4Co1.5Y9.2O12.8N5.6 and Al71.6Ni13Co4.4Y7.4O3.6, respectively. More microstructural details about the gas-atomized Al86Ni7Y4.5Co1La1.5 can be found elsewhere.Reference Yan, Wang, Schaffer and Qian31
The microstructure of the as-atomized Al86Ni7Y4.5Co1La1.5 powder: (a) SEM-BSE image, (b) TEM-SAED patterns for three crystalline phases identified in the powder, i.e., Al, Al2Y and Al-Ni-Y, and (c) TEM-BF image of the three phases. No Q phase was detected in this powder.

B. Thermal stability of the Q phase
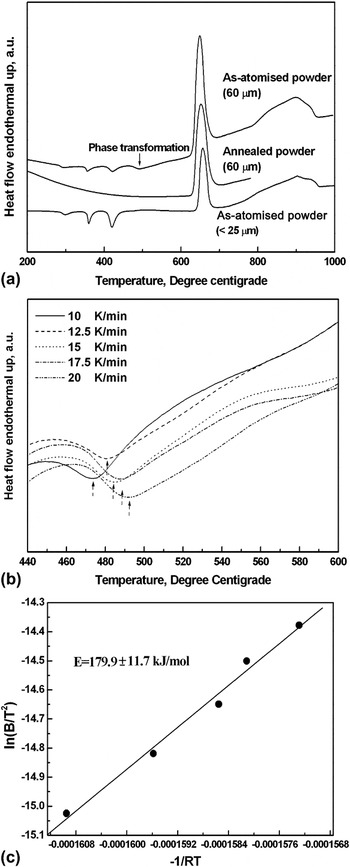
Figure 5(a) shows the DSC curves for the Al85Ni5Y6Co2Fe2 powder of (i) as-atomized ∼60-μm powder that is nearly fully crystallized, (ii) ∼60 μm that has been annealed, and (iii) as-atomized < 25-μm powder that is fully amorphous. An exothermic peak, indicative of a phase transformation event, was detected at ∼500 °C [Figs. 5(a) and 5(b)], which finished at ∼560 °C. The three prior peaks arise from the crystallization of the amorphous satellite particles of the 60-μm powder. This was confirmed by the DSC curve for the <25-μm fully amorphous powder [Fig. 5(a)], which showed three exothermic peaks at identical temperatures. These suggest that the observed Q phase is a metastable phase and it is stable in a temperature range of up to 500 °C. No further phase transformation events were detected for the Al85Ni5Y6Co2Fe2 powder that was annealed at 600 °C for 120 min until melting of FCC-Al occurred at ∼650 °C, Fig. 5(a).
(a) DSC curves for the Al85Ni5Y6Co2Fe2 powder of as-atomized (∼60 μm), the same powder after annealing at 600 °C for 2 h and as-atomized powder (<25 μm); (b) DSC results for the as-atomized powder (∼60 μm) at different heating rates, and (c) the activation energy for the phase transformation determined by the thermal analysis shown in (b).

The Kissinger methodReference Inoue36 was used to determine the activation energy for the phase transformation. Based on the data revealed by the thermal analysis, the activation energy was determined to be 179.9 ±11.7 kJ/mol, Figs. 5(b) and 5(c).
C. Transformation products of the Q phase
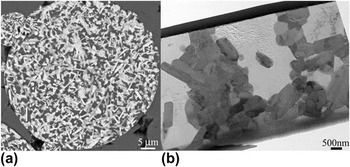
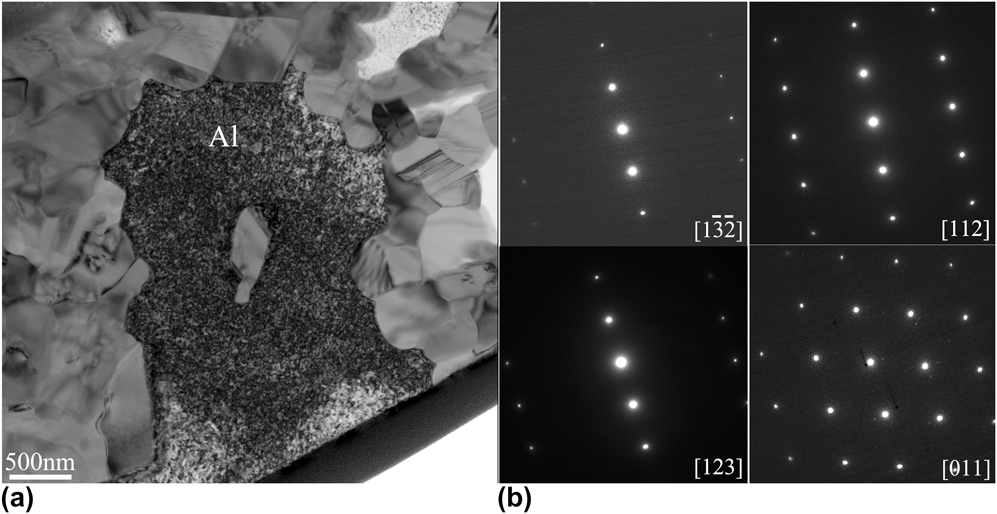
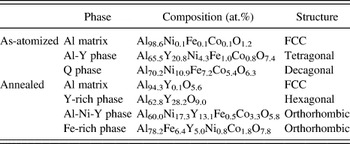
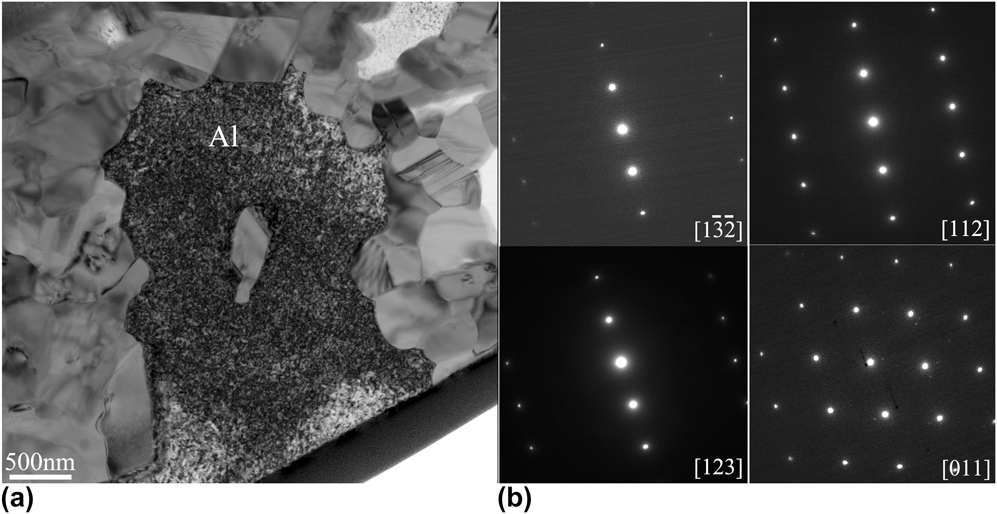
The SEM and TEM images of the Al85Ni5Y6Co2Fe2 after annealing are shown in Figs. 6(a) and 6(b), which are in strong contrast to the as-atomized microstructure Fig. 1(a). Figure 7(a) shows a TEM-BF image of the major phase in the annealed Al85Ni5Y6Co2Fe2; the corresponding SAED patterns shown in Fig. 7(b) confirm that it is FCC-Al. The rest of the microstructure was found to be a mixture of an Al-Ni-Y phase, a Y-rich phase and an Fe-rich phase. Their phase composition is listed in Table II. The large Q phase particles present in the as-atomized Al85Ni5Y6Co2Fe2 powder have completely disappeared. In addition, the Al-Y phase has also vanished.
(a) SEM-BSE image and (b) TEM-BF image for the Al85Ni5Y6Co2Fe2 powder (∼60 μm) annealed at 600 °C for 2 h.

TEM of the Al phase in the annealed Al85Ni5Y6Co2Fe2 powder: (a) BF image and (b) SAED patterns in different zone axes.
Crystal structure and composition of phases formed in the gas-atomized and annealed Al85Ni5Y6Co2Fe2 powders. The error in the phase composition is estimated to be ± 5 at.%.

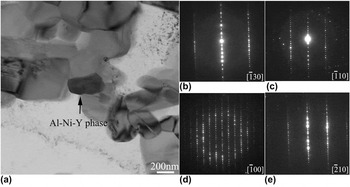
Detailed crystallographic information of the Al-Ni-Y phase is shown in Figs. 8(a)–8(e). The largest plane distances of this phase are ∼28.1 Å and ∼8.4 Å, Fig. 8(d), contrasting with all currently known ternary Al-Ni-Y phases in the JCPDS database. Indexation of these SAED patterns gives lattice parameters of a = 4.7 Å, b = 8.4 Å and c = 28.1 Å, with a primitive orthorhombic structure.
TEM of the Al-Ni-Y phase in the annealed Al85Ni5Y6Co2Fe2 powder: (a) BF image and (b)-(e) SAED patterns. Large plane distances are noted, especially in the SAED pattern of (d).

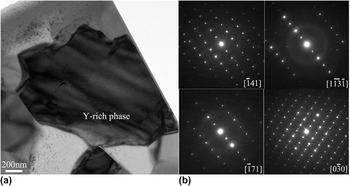
Figure 9 shows the TEM results for the Y-rich phase. This phase is ∼800 nm in size [Fig. 9(a)] and contains ∼25 at.% of Y, close to the stoichiometric Al3Y. Its SAED patterns confirm it is Al3Y [Fig. 9(b)], with a hexagonal structure and lattice parameters of a = b = 6.2 Å and c = 21.2 Å.
TEM of the Al-Y phase in the annealed Al85Ni5Y6Co2Fe2 powder: (a) BF image and (b) SAED patterns. The crystal structure of this phase is identical to the hexagonal-structured Al3Y.

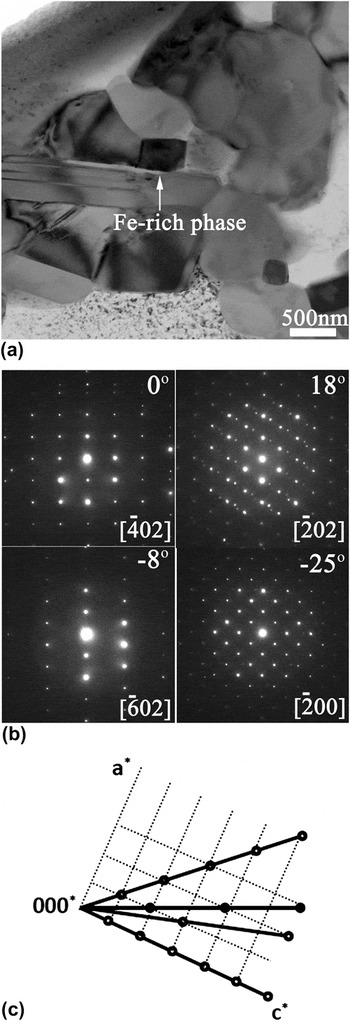
A TEM-BF image of the Fe-rich phase is shown in Fig. 10(a). Its SAED patterns are presented in Fig. 10(b). The Fe concentration (6.4%) of this phase is close to the Q phase, yet its Ni content is lowered to 0.8%. Indexing the SAED patterns by the projection approachReference Gard, Wenk, Champness, Cowley, Heuer, Thomas and Tighe37–Reference Yan, Zou and Shen39 suggests an orthorhombic structure with lattice parameters of a = 9.0 Å, b = 10.2 Å and c = 9.0 Å, Fig. 10(c). The phase is therefore identified as the orthorhombic-structured Al10Fe2Y (PDF #51-0681) with the space group of Cmcm (No. 63).
TEM of the Fe-rich phase in the annealed Al85Ni5Y6Co2Fe2 powder: (a) BF image, (b) SAED patterns obtained at different tilting angles, and (c) reconstruction of the SAED patterns in the reciprocal space using a projection method.

IV. DISCUSSION
A. Formation of the Q phase
Recent studies of the Hume-Rothery phases, including the Q phases,Reference Bancel and Heiney29, Reference Smith and Ashcroft30 confirm the importance of the electron concentration in forming and/or stabilizing quasicrystals.Reference Massalski and Mizutani40–Reference Lei, Dubois, Calvo-Dahlborg, Dong and Zhang45 Following Refs. Reference Qiang44–Reference Qiang, Wang, Wang, Kramer, Thiel and Dong46, the valence of each element in the Q phase (Al70.2Ni10.9Fe7.2Co5.4O6.3) can be assumed to be Al+3, Ni0, Y2+, Fe−2, Co−1.4 and O−2. The average valence electrons per atom, e/a, of the Q phase can be calculated, where e is the valence of element i, and c is its concentration. The calculations give e/a = ∼1.76. The ratio is very close to the characteristic value of e/a = 1.75,Reference Massalski and Mizutani40–Reference Lei, Dubois, Calvo-Dahlborg, Dong and Zhang45 which satisfies the condition of 2Kf = K, where Kf is the radius (a vector) of the Fermi sphere and K is the basic vector of the Brillouin zone. When 2Kf = K, the interaction between the Fermi energy surface and the Brillouin zone boundary will intensify,Reference Kittel47 reducing the Fermi energy of the system to stabilize the structure of the Q phase and therefore favoring its formation. Hence the formation of the Q phase in the Al85Ni5Y6Co2Fe2 can be understood through the special configuration of its valence electrons in relation to its phase composition.
In contrast, the e/a values for the phases in Al86Ni7Y4.5Co1La1.5 (Fig. 4) deviate significantly from 1.75 (2.77 for the FCC-Al phase, 1.95 for the tetragonal Al-Y phase and 2.24 for the orthorhombic Al-Ni-Y phase). This further confirms the importance of the electron concentration in forming and/or stabilizing quasicrystals. Comparing La with Fe, it also appears that the involvement of Fe may have contributed to the formation and/or stabilization of the Q phase, when considering the other constituent elements are identical to each other in the alloys of Al85Ni5Y6Co2Fe2 and Al86Ni7Y4.5Co1La1.5. Although oxygen is a very influential factor to the crystallization of metallic glasses,Reference Lin, Johnson and Rhim48–Reference Gebert, Eckert and Schultz50 it is not absolutely necessary for the formation of quasicrystals. This is based on the facts that the comparative alloy, Al86Ni7Y4.5Co1La1.5, does not show any quasicrystal although it also contains a certain amount of oxygen and has an oxygen-containing crystallization product. In addition, quasicrystals have been found in both crystalline alloys and glass-forming alloys where oxygen is not a key compositional factor.Reference Tsai, Inoue and Masumoto16, Reference Chen, Wang, Wang, Qiang and Dong51
The large size of the Q phase formed in this MG-forming alloy can be understood in this way: even though the nucleation characteristics of the Q phase are unclear, given the cooling rate range of the gas atomization (∼103–105 K/s,Reference Inoue36), the critical nucleus radius of the Q phase is expected to be on the nanometre scale. This means that the large Q phase observed should primarily be a result of growth during gas atomization. This agrees with the dendritic morphologies of some large Q crystals shown in the Fig. 1(a). Compared with the melt spinning (∼104–107 K/s,Reference Cahn and Haasen52), the cooling rate of the gas atomization is slower. This favors the growth of the Q phase.
B. Intersection of the Q phase with marginal glass-forming alloys
The local structure of an MG-forming alloy is closely related to quasi-crystallinity.Reference Wang, Dong and Shek11, Reference Takagi, Ohkubo, Hirotsu, Hirotsu, Murty, Hono and Shindo53, Reference Miracle, Egami, Flores and Kelton54 This is supported by both experimental studies and computational analyses that have predicted the existence of quasicrystal clusters and/or short range order in a number of MG-forming alloys. In fact, it has been suggested that quasicrystal clusters could be the building blocks for MG-forming alloys,Reference Miracle, Egami, Flores and Kelton54 including both the bulk and the marginal MG-forming alloys. These are the foundation for the following discussions.
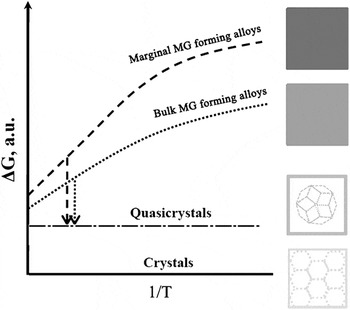
Busch, Masuhr and JohnsonReference Busch, Masuhr and Johnson55 compared the free energy difference (ΔG) between the liquid state and the crystalline state for a variety of MG-forming alloys based on measured values of the enthalpy (H), entropy (S) and specific heat capacity (Cp). On the basis of their study, Fig. 11 further illustrates the relative free energy states for bulk MG-forming alloys, marginal MG-forming alloys and quasicrystals in relation to crystalline materials. Marginal MG-forming alloys such as Al-based alloys normally have higher ΔG than BMGs,Reference Busch, Masuhr and Johnson55 while quasicrystallinity occupies an intermediate state between amorphous, the highest energy state, and crystalline, the lowest energy state.Reference Tsai3, Reference Kuhn, Eymann, Mattern, Eckert, Gebert, Bartusch and Schultz56 Quasicrystals are therefore thermodynamically favored to form in marginal MG-forming liquids due to the higher driving force (i.e. higher ΔG) compared with the formation in bulk MG-forming liquids. Considering that quasicrystalline clusters exist in almost all MG-forming alloys as aforementioned, marginal MG-forming alloys can be the realistic sources for the creation and/or finding of quasicrystalline materials.
A schematic illustration of the relative free energy states and corresponding microstructural states for marginal MG-forming alloys, bulk MG-forming alloys, Q phases and normal crystalline phases. This figure is proposed on the basis of the studies of Refs. Reference Gebert, Eckert and Schultz50, Reference Chen, Wang, Wang, Qiang and Dong51 as well as the current study.

In fact, this important inference can also be understood through the different mechanisms that are responsible for the formation of Hume-Rothery phases (Q phases) and bulk metallic glasses, respectively. Quasicrystals are fundamentally regarded as Hume-Rothery phases; the latter requires: (i) the atomic radii of the solute and the solvent atoms must differ by no more than 15%, i.e., (Rsolute-Rsolvent)/Rsolvent*100 < 15%, and (ii) the solute and the solvent should have similar electronegativity.Reference Bancel and Heiney29, Reference Smith and Ashcroft30 But these two points are in clear contrast to the well-known empirical principles proposed by Inoue et al.Reference Inoue36 regarding designing BMGs, which suggest, correspondingly, that (i) large mismatch (no less than 12%) in the atomic radii and (ii) large heat of mixing (i.e. large difference in electronegativity,Reference Miedema, de Boer and de Chatel57) between constituent atom species to achieve the formation of BMGs. These could be the fundamental reasons why Q phases are not easy to form directly in the bulk metallic glass-forming alloys.
C. Phase stability and phase transformation of the Q phase
The decomposition products of the Q phase show distinctly different compositions from the Q phase, indicating that the decomposition has involved diffusion. Furthermore, the activation energy for the phase transformation of the Q phase was determined to be 179.9 ± 11.7 kJ/mol [Fig. 5(c)], which is close to the activation energy for the self-diffusion of Al (∼142.8 kJ/mol).Reference Lundy and Murdock58 This suggests that the decomposition of the Q phase depends largely on the diffusion of Al.
V. SUMMARY
(i) Large decagonal quasicrystals up to ∼10 μm have been identified in the nitrogen gas-atomized microstructure of a glass-forming alloy Al85Ni5Y6Co2Fe2. The Q phase has an approximate composition of Al70.2Ni10.9Fe7.2Co5.4O6.3. The formation of the Q phase can be understood through the valence electron atom ratio (e/a). Under appropriate kinetic conditions marginal metallic glass-forming alloys such as the Al-based could be ideal systems for the creation and/or finding of large quasicrystal materials.
(ii) The 10-μm sized Q phase is stable at room temperature and undergoes a phase transformation at ∼500 °C. The activation energy for the phase transformation is determined to be 179.9 ± 11.7 kJ/mol, close to the activation energy for the self-diffusion of Al (∼142.8 kJ/mol).
(iii) The crystallographic information for two new crystalline phases has been established through detailed TEM analysis. One is the tetragonal-structured Al-Y phase (Al65.5Y20.8Ni4.3Fe1.0Co0.8O7.4) with lattice parameters of a = 0.52 nm and c = 0.76 nm; this phase is recognized in the as-atomized microstructure of Al85Ni5Y6Co2Fe2. The other is the orthorhombic-structured Al-Ni-Y phase (Al60.0Ni17.3Y13.1Fe0.5Co3.3O5.8; a = 4.7 Å, b = 8.4 Å and c = 28.1 Å), identified in the annealed microstructure of Al85Ni5Y6Co2Fe2.
ACKNOWLEDGMENTS
This work was supported by the Australian Research Council (ARC) and the National Natural Science Foundation of China (No. 51131006). Dr. M. Yan acknowledges the support of a Queensland Smart Future Fellowship (Early Career). We also acknowledge the technical, scientific and financial assistance from the AMMRF. Constructive discussions with Prof. C. Dong and Dr. J.B. Qiang of Dalian Institute of Technology, China and Dr. G. Ji of LILLE 1 University Science and Technology, France are gratefully appreciated.