Introduction
Since first observations three decades ago,Reference McCance and Widdowson 1 , Reference McCance and Widdowson 2 studies carried out in animal models and in humans have shown that fetal undernutrition causes intrauterine growth restriction (IUGR) and increases the risk of developing hypertension, cardiovascular diseases and type 2 diabetes later in life.Reference Barker, Bagby and Hanson 3 – Reference Hales and Barker 7
In animal models, fetal undernutrition can be induced by a number of diverse treatments during pregnancy, including dietary protein restriction,Reference Harding and Johnston 8 , Reference Wu, Bazer, Cudd, Meininger and Spencer 9 global caloric undernutrition,Reference Atinmo, Pond and Barnes 10 – Reference Mellor 12 placental insufficiency,Reference Cock, Camm, Louey, Joyce and Harding 13 – Reference Murotsuki, Challis, Han, Fraher and Gagnon 20 deficient oxygen supplyReference Chang, Rutledge, Stoops and Abbe 21 and others.Reference Bell, Hay and Ehrhardt 22 – Reference McMillen and Robinson 24 Whereas this wide spectrum of known growth inhibitors underscores the complexity of pathways involved in the regulation of fetal growth, the relatively uniform response in offspring – increased risk of developing certain chronic diseases later in life – suggests that common patterns of genome programming may be operative. Uncovering these patterns may provide new insights into the mechanisms of organism development and the origins of chronic diseases.
Fetal programming involves changes at the level of the entire organism, specific organs, cells and gene expression. It has been recently recognized that fetal programming during IUGR is associated with epigenetic changes in gene expression. Epigenetic mechanisms are those that promulgate heritable change in gene expression without changes in the DNA sequence.Reference Jaenisch and Bird 25 It has been shown that IUGR induces changes in the expression of certain fetal genes associated with alterations in DNA methylation and histone modification profiles along these genes in animal modelsReference MacLennan, James and Melnyk 18 , Reference Aagaard-Tillery, Grove and Bishop 26 , Reference Waterland and Jirtle 27 and in humans.Reference Tobi, Lumey and Talens 28 Importantly, some of these changes were found to persist postnatallyReference Pham, MacLennan and Chiu 29 – Reference Vickaryous and Whitelaw 31 an observation that supports a role for epigenetic processes in fetal programming by IUGR. Epigenetic programming of postnatal phenotypes by the intrauterine environment, including vulnerability to chronic diseases, represents a largely unexplored paradigm in the study of developmental origins of health and disease.
To examine mechanisms that account for fetal programming of gene expression, we have developed and characterized a microswine model of IUGR. It was shown more than three decades ago that in pigs, birth weight as well as brain and liver weight was reduced in the progeny of gilts fed a protein-deficient diet throughout gestation.Reference Atinmo, Pond and Barnes 10 , Reference Pond, Strachan and Sinha 11 These findings suggested that porcine fetal growth can be influenced by a maternal protein–energy imbalance during pregnancy. Metabolic, physiological and genomic similarities to humans make the omnivorous pig a useful model to understand processes leading to chronic diseases. In this model, IUGR was induced by exposing pregnant sows to either normal (NP) or isocaloric low protein (LP) diets during late pregnancy and early lactation.Reference Bagby, Kupfer and Lin 32 , Reference Bagby, Kupfer and Lin 33 To define general v. model-specific effects we also used an ovine model of placental insufficiency induced by embolization.Reference Cock, Camm, Louey, Joyce and Harding 13 – Reference Louey, Jonker, Giraud and Thornburg 17 In this model, failure of the placenta to meet the demands of the developing fetus leads to hypoxemia, hypoglycemia and fetal growth restriction,Reference Cock, Camm, Louey, Joyce and Harding 13 – Reference Louey, Jonker, Giraud and Thornburg 17 as is observed in human IUGR.Reference Economides and Nicolaides 34 – Reference Nicolaides, Economides and Soothill 37 Studies in these models revealed changes in gene expression and associated alterations in histone modifications.
Method
Maternal protein restriction (MPR) in microswine
The microswine model of MPR has been previously described.Reference Bagby, Kupfer and Lin 32 , Reference Bagby, Kupfer and Lin 33 Time-mated outbred microswine were obtained from Sinclair BioResources, Inc., Columbia MO, USA (formerly Charles River Breeders). Sows were shipped to the vivarium at Oregon Health & Science University (OHSU) on gestation day (GD) 80 of the 115-day gestation and randomized to receive custom formulated normal protein (Purina; NP: 14% w/w) or isocaloric low protein (LP: 1% w/w) diets; protein and fat in both diets were soy based. Fat was maintained constant at 3%, whereas carbohydrate was varied to achieve isocaloric status; thus the 47% (w/w) corn starch and 16% glucose monohydrate in the NP diet was increased to respectively 68% and 23% in the LP diet (Fig. 1, Table S1). On the basis of measured adult swine food intake,Reference Bagby, Kupfer and Lin 32 the LP diet provides 0.6 g protein/kg body weight/day; 0.8–1.0 g/kg/day is considered nutritionally adequate in normal adult humans. Diets were applied from GD 85 (last 0.25 of gestation) through postnatal day 14 (Fig. 1). All offspring were studied and eventually sacrificed for tissue collections according to approved animal protocols (OHSU IACUC committee, No. A439). Tissue harvests were performed under anesthesia (induced with intramuscular Telazol 8 mg/kg, then maintained via 1.5–3% isofluorane) by a certified veterinarian. Fetal piglets were delivered sequentially by caesarian section, with each set of organs rapidly harvested before delivery of the next fetus. Neonatal and juvenile kidneys were removed under conditions of well-maintained cardiac output and blood pressure. All tissues were immediately snap frozen and stored at −80°C.
MPR in microswines. Diet composition (upper panel) and time schedule of animal treatments (lower panel) are shown. Juvenile tissue harvests spanned 90–145 days of age (average 112 ± 4 days).

Placental insufficiency in sheep
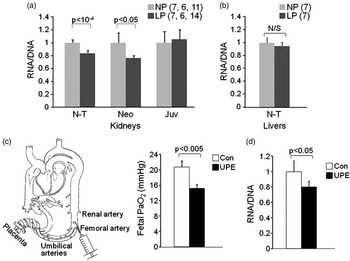
To test if key results were specific to the microswine MPR model, experiments were also conducted in fetal sheep using umbilicoplacental embolization. In five sets of fetal twins from ewes of known mating date, each set was randomized to one of two treatments: umbilicoplacental embolization (UPE) or saline control; UPE was performed daily for 5 days, beginning at 115 days gestational age (dGA; term is 145 dGA). The catheter used to inject microspheres is fed via the fetal femoral artery such that the catheter tip is in the abdominal aorta below the level of the renal arteries so as to embolize the placenta but not the kidneys (Fig. 3c); catheter tip position is confirmed at the time of necropsy. Microspheres injected to induce placental insufficiency remained on the fetal side of the umbilicoplacental circulation.Reference Cheung, Bogic, Gagnon, Harding and Brace 38 UPE fetuses exhibited alterations to arterial blood gases, hemodynamics and somatic and organ growth that were not evident in their non-embolized twins.Reference Louey, Jonker, Giraud and Thornburg 17 In UPE fetuses, fetal arterial oxygen pressure was reduced by ∼8 mmHg; this is equivalent to a 50% reduction in arterial oxygen saturation levels. Controls received saline injections only. All ewes and offspring were humanely euthanized with an intravenous overdose of sodium pentobarbital at the conclusion of in vivo studies according to approved animal protocols (OHSU IACUC protocol, No. A050). Renal cortical tissues collected from these studies were snap frozen and stored at −80°C for RNA analysis experiments.
Per-cell RNA levels
To estimate mRNA levels per cell, we assumed that the number of cells in a tissue fragment is proportional to the DNA content, providing a simple way to normalize mRNA levels: mRNA/(cell number) = mRNA/DNA.Reference Kanno, Aisaki and Igarashi 39 Total nucleic acids (TNA; RNA + DNA), were purified from fragments of kidney cortices and livers by phenol deproteinization; OD260 was measured in each preparation. RNA was then purified from 50 μg of each TNA preparation (TRIzol reagent, Invitrogen, followed by DNase I treatment) and also quantified. Total RNA content per cell was estimated as the ratio, [RNA]/([TNA] − [RNA]). Individual transcript levels were normalized to cell number by calculating signal ratios, reverse transcription quantitative polymerase chain reaction (RT qPCR) × (RNA/DNA).
Reverse transcription
To assess changes in the level of total mRNA (i.e. poly(A) + RNA), 1 μg of total RNA from each sample was reverse transcribed with either oligo-dT primer (poly(A) + RNA) or random hexamer primers (total RNA) in the presence of biotinylated dCTP (Invitrogen). cDNA was dot-blotted on nitrocellulose membrane and stained with streptavidin conjugated with alkaline phosphatase. Membranes were developed with BCIP/NBT substrate, scanned and analyzed by densitometry. Total poly(A) + RNA level was measured as (oligo-dT RT)/(random hexamer RT) signal ratio in each RNA sample.
For individual transcript analysis, RNA purified from animal tissues was treated with RNase-free DNase I (1 U/10 μg of RNA; Epicentre Technologies, Madison, WI, USA) for 15 min at 37°C, deproteinized with phenol/chloroform mixture and precipitated with ethanol. One microgram of DNA-free RNA was reverse transcribed by Superscript II (200 U/reaction; Invitrogen, Gaithersburg, MD, USA) with random hexanucleotide primer mixture (1 μM) in 10 μl final volume for 1 h at 42°C. The reaction was stopped by mixing with 180 μl of Tris-EDTA buffer, TE (Tris-HCl 10 mM, pH 8.0, EDTA 1 mM) and incubation at 95°C for 5 min. RT mixtures were further diluted 10 times with TE and analyzed by real time PCR with gene-specific sets of primers. To normalize transcript levels to cell number, RT PCR signal for each RNA preparation was then multiplied by corresponding RNA/DNA ratio.
Microarray analysis of gene expression
Total RNA was extracted from kidney cortices of near-term fetal piglets (n = 6 NP; n = 7 LP) using the RNeasy Mini kit (QIAGEN). Microarray assays were performed in the Affymetrix Microarray Core of the OHSU Gene Microarray Shared Resource. We used the GeneChip Porcine Genome Array (Affymetrix) that contains 23,937 probe sets to interrogate 23,256 transcripts in pig, which represents 20,201 genes according to the manufacturer's protocols. Data visualization and exploratory analysis, including principal component analysis and hierarchical clustering, were performed using GeneSifter (Geospiza, Seattle, WA, USA; www.genesifter.net).
Chromatin immunoprecipitation (ChIP), matrix ChIP and real time PCR analysis
ChIP was done in 96-well plates as described in.Reference Flanagin, Nelson, Castner, Denisenko and Bomsztyk 40 The following antibodies were used: RNA polymerase II (Pol II; anti-CTD, clone 4H8, Santa Cruz, CA, USA), histone H3 (ab1791, Abcam), H3K4m3 (ab8580, Abcam) and H3K9m3 (ab8898, Abcam). Mock IP was done without added antibodies. Input DNA was purified from 10% of the amount of tissue extract used in IPs.
The reaction mixture contained 2.5 μl 2X SYBR Green PCR master mix (SensiMix, Quantace), 2 μl DNA template and 0.2 μl primers (10 μM each) in 5-μl final volume in 384-Well Optical Reaction Plate (Applied Biosystems). Amplification (three steps, 40 cycles), data acquisition and analysis were carried out using the 7900HT Real Time PCR system and SDS Enterprise Database software (Applied Biosystems). All PCR reactions were run in triplicates. Standard dilutions of genomic DNA (ChIP) or pooled RT reactions (RT PCR) were included in each PCR run.
Histone modification and Pol II levels at a DNA site were calculated as previously described.Reference Flanagin, Nelson, Castner, Denisenko and Bomsztyk 40 ChIP data were expressed as the percent of input DNA that was precipitated by specific antibodies. Results of ChIP and gene expression analyses were evaluated statistically by using analysis of variance with maternal diet (NP v. LP) as an experimental factor, and age and sex as covariates. Sequences of primers used in these studies are available upon request.
Results
Changes in gene expression in kidneys of near-term LP offspring revealed by microarray analysis
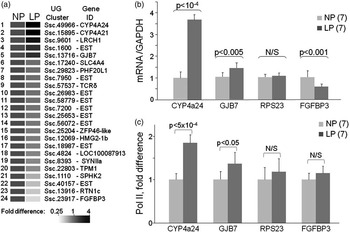
Pregnant sows were fed ad libitum either normal or isocaloric protein restricted diets during the last 0.25 of pregnancy and the first 2 weeks postnatally (Fig. 1). The late gestation/early lactation window of MPR exposure was designed to encompass developmental events in the kidney of the pig.Reference Friis 41 Prepubertal offspring of protein-restricted microswine, like children born small, exhibit enhanced postnatal growth and early vascular dysfunction.Reference Bagby, Kupfer and Lin 32 , Reference Bagby, Kupfer and Lin 33 , Reference Eriksson, Forsen, Tuomilehto, Osmond and Barker 42 , Reference Nichols, Boyne and Thame 43 To identify genes sensitive to MPR, we performed microarray analysis of kidney cortex RNA from near-term fetal animals (Fig. 2a). We used the GeneChip Porcine Genome Array (Affymetrix) that contains 23,937 probe sets to interrogate 23,256 transcripts in pig, which represents 20,201 genes. First, microarray results suggested that the expression of relatively few renal cortical genes were altered by MPR in LP kidneys compared to controls (NP). Some of the MPR-altered genes were not identifiable because corresponding probes on the array were derived from expressed sequence tags that correspond to diverged 3′ UTRs within porcine genes that are not yet annotated. Second, while most of the altered genes were suppressed, a few were stimulated by MPR. Among induced genes, LP animals had higher levels of expression of CYP4a24/21 (3–4-fold increase), LRCH1 (2–2.5-fold increase) and GJB7 (1.5-fold increase) genes. These findings were confirmed by RT qPCR analysis (Fig. 2b) for CYP4a24, an ω-hydroxylase enzyme expressed predominantly in kidneys, and for GJB7, a ubiquitous component of the gap junction complex. Downregulation of FGFBP3 (FGF – binding protein 3) was also confirmed by RT qPCR (Fig. 2b).
MPR-triggered changes in gene expression in near-term fetal kidneys. (a) Microarray analysis of transcript levels in NP and LP near-term kidneys. Heat map is shown for genes that were induced (red) or repressed (green) by at least 1.5-fold in LP compared to NP RNA samples. (b) Total RNA purified from near-term kidney cortices from the same animals shown in (a) was analyzed by RT PCR with primers to indicated genes. Transcript levels were normalized to the level of GAPDH mRNA. (c) ChIP analysis of Pol II density is shown for the same genes as in (b). Equal amounts of extracts from formaldehyde-fixed and ultrasound-treated near-term kidney cortices were immunoprecipitated with antibodies to Pol II CTD. Purified DNA was analyzed with indicated gene-specific primers. PCR signal for each sample was normalized to input DNA and to control (NP) mean value. Bars in (a–c) represent mean ± sd. Animal numbers are shown in parentheses, NP = normal protein; LP = low protein.

Next, we tested whether the increases in CYP4a24 and GJB7 transcript levels in LP kidneys were mediated by increased transcription. The approach was based on the established observation that increased gene transcription is associated with enhanced recruitment of Pol II. To assess density of Pol II at each of the genes, we used ChIP assay,Reference Flanagin, Nelson, Castner, Denisenko and Bomsztyk 40 , Reference Orlando, Strutt and Paro 44 , Reference Nelson, Denisenko and Bomsztyk 45 a method to study DNA–protein interactions in vivo.Reference Nelson, Flanagin, Kawata, Denisenko and Bomsztyk 46 , Reference Denisenko and Bomsztyk 47 We found that the increase in CYP4a24 and GJB7 transcript levels in near-term LP kidneys was associated with enhanced recruitment of Pol II to these genes (Fig. 2c). These data indicate that the mRNA changes are transcriptionally mediated. No changes in Pol II density were found at the reference gene RPS23 or the downregulated gene FGFBP3.
Downregulation of total per-cell RNA levels in kidneys during MPR in microswine and placental insufficiency in sheep
mRNA levels shown in Fig. 2b were normalized to GAPDH mRNA levels. However, if normalized instead to the total amount of RNA used in the RT reaction, levels of GAPDH and all other reference-gene transcripts were consistently lower in LP near-term kidneys compared to NP controls. This observation suggested that many transcripts were downregulated in LP kidneys. To further examine this issue, we assessed changes in RNA content per cell in LP kidneys. The approach to estimate RNA levels per cell is based on the assumption that number of cells in a tissue fragment is proportional to the DNA content, therefore RNA/(cell number) = RNA/DNA.Reference Kanno, Aisaki and Igarashi 39 It should be noted that this approach is feasible only in tissues composed of cells with uniform nuclear number and ploidy, such as the kidney and liver.
In this series of experiments, we measured RNA/DNA ratios for LP and NP kidney cortices (Fig. 3a). MPR significantly decreased RNA/DNA ratios in near-term and neonatal LP kidneys, both timepoints reflecting the ongoing MPR. However, in 3–5 month old juveniles maintained on a normal diet since weaning, the ratio recovered to the control level. This pattern indicates that the reduction in per-cell RNA content in kidney cortex is a direct effect of ongoing dietary restriction. In contrast, there was no effect of MPR on per-cell RNA levels in near-term LP livers, additionally suggesting that this undernutrition effect may be organ-specific (Fig. 3b).
MPR in microswine (a, b) and placental insufficiency in sheep (c, d) downregulate per-cell RNA levels in offspring kidney cortex. RNA and DNA were concurrently purified from either kidney cortices (a) or livers (b) from NP (light gray bars) and LP (dark gray bars) near-term fetal (N-T), 2-week-old neonatal (Neo) and juvenile (Juv) animals. Bars represent the RNA/DNA ratios, mean ± sd. Animal numbers are shown in parentheses (N-T, Neo and Juv). Placental insufficiency (c, d) in sheep decreases per cell RNA levels in fetal kidneys. (c) Experimental design: a decrease in oxygen pressure in arterial blood in fetuses exposed to UPE. (d) Total RNA and DNA were purified from control (Con, open bar) and UPE (UPE, closed bar) fetal kidneys. Bars represent RNA/DNA ratios, mean ± sd, n = 5/group, NP = normal protein; LP = low protein; UPE = umbilicoplacental embolization.

Next, we tested whether the phenomenon of low total RNA/cell in renal cortex is unique to the microswine model of MPR. To address this, we examined kidneys from an established sheep model of placental insufficiency.Reference Economides and Nicolaides 34 – Reference Nicolaides, Economides and Soothill 37 In this model (Fig. 3c), microspheres are injected to embolize the placenta. During the 5-day study period, the partial pressure of oxygen was, on average, 6 mmHg lower in UPE fetuses than controls (Fig. 3c) showing the extent of embolization. We found that, as with MPR in microswine, UPE in sheep causes downregulation of per-cell RNA levels in fetal kidneys after only 5 days of placental embolization (Fig. 3d).
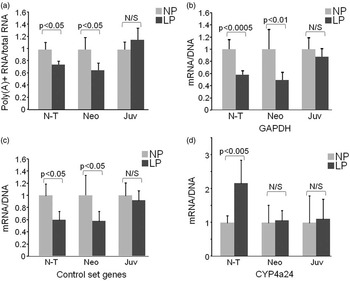
To account for the substantial decrease of per-cell RNA content observed during MPR, reductions in the most abundant stable cellular RNA species, rRNAs and tRNAs (which are transcribed by Pol I and Pol III, respectively) must contribute. To test whether MPR also has a negative effect on Pol II transcribed genes, we estimated per cell levels of total poly(A)+ transcripts (Fig. 4a). Results of this analysis show that per-cell poly(A)+ RNA levels were also decreased in kidneys of both near-term and neonatal LP offspring; however, values fully recovered in LP juvenile kidneys. These data show that MPR has a global negative effect on expression of genes transcribed by Pol II in kidneys.
IUGR downregulates per-cell levels of total poly(A)+ RNA and of individual gene transcripts. (a) 1 μg of total RNA from near-term (N-T), 2-week-old neonatal (Neo) and juvenile (Juv) kidney cortices was reverse transcribed in the presence of biotinylated dCTP with either oligo-dT or random hexamer primers. Equal amounts of RT reactions were analyzed by dot-blotting and densitometry. Bars represent (poly(A)+ RNA)/(total RNA) signal ratios, mean ± sd, n = 5/group. Per-cell levels of individual mRNA transcripts (b–d) that are either downregulated (b, c) or induced (d) in LP compared to NP kidneys. Equal amounts of RNA were reverse transcribed and analyzed by PCR with gene-specific primers. PCR signals for each RNA preparation were multiplied by the corresponding RNA/DNA ratio (Fig. 3a). Bars represent (RT PCR signal) × (RNA/DNA) ratios, mean ± sd; n = 7/7 (NP/LP) for N-T, 6/6 for Neo and 8/7 for Juv animal groups. In (c) bars represent averaged ratios for the reference gene panel (RPS23, COL3a1, GAPDH, AGT and LAMC1), NP = normal protein; LP = low protein.

Next, we used RT PCR to estimate per cell levels of individual transcripts in kidneys of LP and NP animals. Results of this analysis show that similar to changes in total poly(A)+ RNA (Fig. 4a), per-cell RNA levels for each of a randomly chosen panel of five individual transcripts (GAPDH, RPS23, COL3a1, AGT and LAMC1) were substantially decreased in both LP near-term and neonatal kidneys (Fig. 4b). Again, mRNA levels in juvenile LP kidneys recovered to near-control levels. In agreement with Pol II ChIP data shown above, cellular levels of CYP4a24 transcript escaped global downregulation in near-term and neonatal LP kidneys (compare Figs 2c and 4d).
MPR-induced alterations in histone modifications support transcriptional mechanism of downregulation of cellular RNA levels
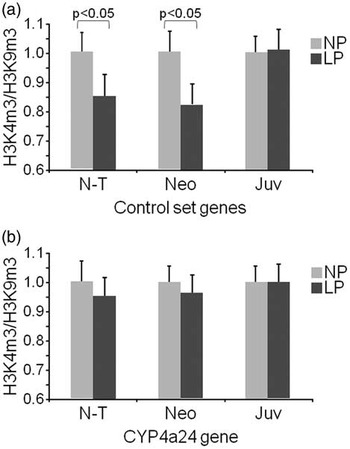
Global downregulation of gene expression may be a consequence of slower transcription or RNA destabilization during MPR. Next, we determined the contribution of transcription to the decrease in cellular levels of reference panel transcripts in LP kidneys (Fig. 4) by examining levels of gene-associated histone modifications, specifically using marks that have been confirmed as indicators of changes in gene transcription states.Reference Jaenisch and Bird 25 , Reference Barski, Cuddapah and Cui 48 We used ChIP assayReference Flanagin, Nelson, Castner, Denisenko and Bomsztyk 40 to assess levels of histone H3 Lys4 trimethylation (H3K4m3), a marker of active transcription and histone H3 Lys9 trimethylation (H3K9m3) that marks silenced loci, along all tested genes (Fig. 5). The H3K4m3/H3K9m3 ratio was used as an indicator of gene transcription state. The results of this analysis show that MPR-induced downregulation of gene expression is associated with a universal decrease in the H3K4m3/H3K9m3 ratio at all examined reference panel genes in LP near-term and neonatal kidneys (Fig. 5a). These data are compatible with inhibition of transcription of these genes. In addition, consistent with this notion, CYP4a24, a gene that escapes MPR-induced downregulation, shows no changes in H3K4m3/H3K9m3 ratio (Fig. 5b), and therefore serves as a control for specificity of observed changes.
MPR induces changes in histone modifications. ChIP analysis of histone H3 modification density at CYP4a24 and reference group genes in LP and NP kidneys. Matrix ChIP was done with antibodies to H3K4m3 and H3K9m3 as detailed in Method section. Precipitated DNA was analyzed with gene-specific primers and H3K4m3/H3K9m3 signal ratios were calculated for LP and NP kidneys. Bars represent averaged ratios for the reference gene set (RPS23, COL3a1, GAPDH, AGT and LAMC1; (a) and for CYP4a24 gene (b); mean ± sd, n = 6/group, NP = normal protein; LP = low protein.

Discussion
It has been shown in several animal models that fetal programming by an adverse intrauterine environment is associated with changes in gene expression in the offspring. Some of these may persist after birth, providing a direct mechanistic link to altered phenotypes in the offspring.Reference Simmons 30 Others may operate transiently but within a critical window, thus modifying ongoing developmental processes with long-lasting indirect effects on postnatal phenotypes. In this study we examined the effect of poor intrauterine environment on gene expression in kidney, an organ known to undergo substantial changes in many animal models of late-gestational undernutrition.Reference Bagby 49 , Reference Ingelfinger and Schnaper 50 The key finding of this study is that two disparate models of late-gestational undernutrition – maternal dietary protein restriction in microswine and placental insufficiency in sheep – both trigger global downregulation of gene expression in fetal kidneys. This conclusion is supported by results of analysis of per-cell levels of total RNA (Fig. 3), poly(A)+ RNA (Fig. 4a) and individual mRNA transcripts (Fig. 4b).
Initial microarray analysis of MPR-induced changes in gene expression profiles failed to detect global downregulation in gene expression, instead revealing only modest up- or downregulation of a few individual transcripts in fetal kidneys (Fig 2a and 2b). This discrepancy stems from the differences in signal normalization approaches. In microarray and RT PCR analyses, individual transcript levels were normalized to either median transcript level in the sample (Fig. 2a), or control transcript levels (such as GAPDH in Fig. 2b), therefore precluding detection of changes in the median transcript levels. Whereas the best approach is to normalize RNA levels to cell number, this is not feasible in studies conducted in animal tissues. To resolve this, we simultaneously purified RNA and DNA from the same tissue fragments and calculated RNA/DNA ratio, in which DNA level serves as a surrogate for cell number.Reference Kanno, Aisaki and Igarashi 39 For several reasons, changes in cellular DNA content during the cell cycle are unlikely to introduce significant error in this estimation of per cell RNA content. First, the mitotic index in kidneys from near-term and especially postnatal animals is very low,Reference Coles, Burne and Raff 51 and, if anything, a nutrient-limited environment would decrease the mitotic index compared to control animals; this would lead to underestimation of the actual drop in per-cell RNA content. Second, during S phase, when DNA content doubles, cells become larger and almost double the cellular constituents, including RNAReference Melamed and Darzynkiewicz 52 ; therefore, expected variation in the RNA/DNA ratio during the cell cycle is substantially smaller than two-fold.
At a practical level, due to global reduction in total RNA, the estimation of gene expression in models of IUGR will be potentially misleading when transcripts are referenced to any measure of RNA, whether standard housekeeping genes (e.g. GAPDH) or to 18S RNA. Our findings suggest that measurement of the RNA : DNA ratio in an aliquot of the starting material will unmask such pitfalls and prevent overestimation of per-cell gene transcripts.
In contrast to kidney cortex, no change in per-cell RNA content was observed in the near-term LP livers from the same animals (Fig. 3b). Organ-specific effects in the fetus might reflect differential sensitivity of fetal tissues to maternally supplied factors. Alternatively this could be due to differences in developmental timing of liver and kidney organogenesis in relation to exposure to MPR and/or alterations to specific organ blood flows in response to different in utero stresses.Reference Haugen, Hanson and Kiserud 53 – Reference Peeters, Sheldon, Jones, Makowski and Meschia 55 These issues can only be resolved in a separate study in which different MPR treatment times are applied. Importantly, we also found a similar decrease in cellular RNA content in fetal sheep in a model of undernutrition induced by placental insufficiency (Fig. 2c), indicating that this phenomenon is confined neither to MPR nor to microswine, and that there is a fundamental link between IUGR and global downregulation of gene expression in at least some fetal organs. We suggest that chronic suppression of RNA levels during the period of nephrogenesis may be sufficient to alter the long-term renal phenotypes of the offspring, including mesenteric and renal vascular hyper-reactivity to Angiotensin II observed in LP microswine.Reference Bagby, Kupfer and Lin 32
Among the maternally supplied factors responsible for downregulation of gene expression in fetal and/or neonatal kidneys, the most plausible candidates include decreased levels of nutrients (amino acids), oxygen and growth factors. In support of this notion, in in vitro experiments, it has been shown that limiting nutrient or growth factor levels in culture medium decreases cellular RNA content through downregulation of Pol I and Pol II transcription.Reference Grummt, Smith and Grummt 56 – Reference Moss and Stefanovsky 58 Thus, it is conceivable that similar mechanisms operate during IUGR in vivo. The fact that cellular RNA content was also low in neonatal 2-week-old animals, which were still under influence of MPR, indicates that global downregulation of gene expression is not dependent on factors operative only in the in utero environment.
Histone modification pattern and the level of recruited Pol II serve as indicators of gene expression state.Reference Barski, Cuddapah and Cui 48 , Reference Jenuwein and Allis 59 – Reference Kapranov, Cawley and Drenkow 61 We found that the ratio of histone modifications H3K4m3/H3K9m3 was reduced along all the examined downregulated genes in near-term LP kidneys (Fig. 5), but not at CYP4a24 gene that escaped global repression, supporting transcriptional silencing of these genes. Lack of changes in Pol II recruitment to downregulated genes RPS23 and FGFBP3 (Fig. 2c) may indicate that transcription elongation rather than initiation was reduced in LP kidneys. Whereas interpretation of ChIP data merits caution because ChIP assay averages all cell types present in the tissue, we would note that kidney cortex is largely composed of proximal tubules;Reference Robbins, Stephens and Johnston 62 therefore, one cell type, the proximal tubular epithelial cell, has major contribution to the RT PCR and ChIP data. Furthermore, some of the tested genes, including RPS23 and GAPDH are expressed in the majority if not all cell types; hence at least for these genes, ChIP data is likely to be relevant to the observed downregulation of their expression in LP kidneys. Finally, as H3K4m3/H3K9m3 ratios at the examined genes accurately match corresponding mRNA levels (compare Figs 4 and 5), we suggest that changes in chromatin structure mediate transcriptional downregulation of gene expression during MPR. In this regard, it will be revealing to examine kinetics of chromatin and gene expression changes in the ovine model of placental insufficiency in which a decrease in per-cell RNA content is relatively fast and can be detected after 5 days of treatment (Fig. 3d). Such studies may help to define the contribution of epigenetic changes to the downregulation of transcription.
It is known that transcription inhibitors such as Actinomycin D interfere with organism development and produce embryonic abnormalities in mammals.Reference Tuchmann-Duplessis, Hiss, Mottot and Rosner 63 , Reference Karnofsky 64 Therefore, the observed global downregulation of renal transcription induced by poor intrauterine environment may have developmental consequences similar to those of Actinomycin D and other inhibitors of transcription.
In summary, this study revealed that a poor intrauterine environment – as observed with unrelated forms of fetal undernutrition in different animal species – leads to global downregulation of gene expression in fetal kidneys. Chromatin changes associated with individual genes in swine indicate that at least, in part, this downregulation is mediated at the level of transcription. Although both per cell RNA levels and epigenetic marks at individual genes recover to near-control levels within few months after birth, global suppression of transcription during organogenesis may alter developmental pathways, contribute to disproportional growth and permanently modify structure and function of kidneys and other sensitive organs in later life. Future studies will examine molecular mechanisms that alter transcription during fetal development, and reveal the long-term consequences of those changes. This type of information will be useful to define novel diagnostic tools and preventive interventions.
Acknowledgements
This study was supported by grants P01HD34430 and RO1 HD042570 (SB) from NIH/NICHD, the Medical Research Foundation of Oregon (SB), M. Lowell Edwards Endowment (KT), NIH grant R37 DK45978 (KB) and a grant from Gates Foundation (OD). Microarray assays were performed in the OHSU Gene Microarray Shared Resource. The authors are grateful to Dr Chris Harrington for microarray assistance and Dr G. Bagby for discussions and critical reading of the manuscript.
Disclosures
None