A ubiquitous feature of tropical habitats is an uneven distribution of resources. Highly patchy and limiting resources can produce an uneven distribution of the organisms that require them. In many cases, this leads to increased interaction rates among conspecifics in competition for common resources (Gehrt & Fritzell Reference GEHRT and FRITZELL1998, Valeix et al. Reference VALEIX, LOVERIDGE, DAVIDSON, MADZIKANDA, FRITZ and MACDONALD2010). These situations may impose selection pressure such that organisms evolve to navigate close interactions, which can lead to group living (Johnson Reference JOHNSON1980, Krause & Ruxton Reference KRAUSE and RUXTON2002). Group living occurs when several individuals spend an extended period in proximity and includes a spectrum of group types from aggregations to eusociality. Group living is particularly interesting when individuals not only compete for resources, but act as resources for conspecifics (i.e. cannibalistic predators). This study aimed to characterize the microhabitat variables that influence group size of cannibalistic predators. The study's central hypothesis is that complex microhabitats support larger groups of the whip spider Heterophrynus batesii (Butler 1873).
Whip spiders are a little-known group of cannibalistic nocturnal predators that use tree buttresses as their primary microhabitat (Bloch & Weiss Reference BLOCH and WEISS2002, Carvalho et al. Reference CARVALHO, GOMES, NECKEL-OLIVEIRA and LO-MAN-HUNG2012, Dias & Machado Reference DIAS and MACHADO2006, Hebets Reference HEBETS2002). Tree buttresses are triangular flanges joining roots to the lower tree trunk. Trees are intrinsically patchy microhabitats and whip spiders show site fidelity and territoriality for more preferable trees (Hebets Reference HEBETS2002), indicating that suitable trees might be an important limiting resource.
This study was conducted in July and August 2010 at the Tiputini Biodiversity Station (TBS; lat: −0.063°, long: −76.15°) bordering Yasuní National Park and within the Yasuní Biosphere Reserve in Amazonian Ecuador. The field site was located on lowland wet tropical forest (c. 250 m asl) partitioned by several tributaries and interspersed with seasonally flooded areas. The mean night-time temperature during the field session was  $\bar{x}$ ± SD = 22.9 °C ± 1.11 °C, ranging from 19 °C to 28 °C. Humidity, measured with a sling psychrometer, always exceeded 80%.
Surveys were conducted during nightly (c. 20h00–3h00) walks along the TBS trail system. Whip spiders could be spotted from 5 m on either side of the trail. When a whip spider was found, trees within a 5-m radius were intensively searched for additional individuals. Trees with more than one H. batesii were included in the study. The animals’ spatial orientation (facing up, down, horizontal, or diagonal) was recorded to test if whip spiders are more likely to orient downward to aid prey capture. The side of the tree the animal was found on was recorded to test if moonlight had an effect on whip spider location. The height of animals on the tree was recorded to identify microhabitat extent. Whip spiders found on revisits were likely affected by the removal of the original group, and not considered group members. Tree characteristics were recorded including total height to the nearest metre via a laser rangefinder, overstorey density using a convex spherical densitometer 1 m from the tree trunk in each cardinal direction, and leaf litter depth to the nearest centimetre in each cardinal direction.
Presence/absence data were used to compare microhabitat H. batesii used with microhabitats available to the animal. This method is more robust than correlations of animal presence with habitat characteristics because it does not ignore the background matrix of habitat conditions and is not confounded by individual abundance irrespective of, or non-linearly in relation to, habitat quality (Brotons et al. Reference BROTONS, THUILLER, ARAUJO and HIRZEL2004, Hirzel et al. Reference HIRZEL, HAUSSER, CHESSEL and PERRIN2002, Johnson Reference JOHNSON1980, Roloff & Kernohan Reference ROLOFF and KERNOHAN1999). Several trees not occupied by whip spiders were randomly sampled using two methods. Unoccupied near trees were selected by randomly choosing one of two sides of the trail, one of two directions, and a 1–20 m distance from an occupied tree. Unoccupied dispersed trees were selected by choosing 70 random points on all of the surveyed trails. The unoccupied near trees better represented habitat available to individual animals associated with a specific tree, while the unoccupied dispersed trees more generally depicted the habitat on a larger scale.
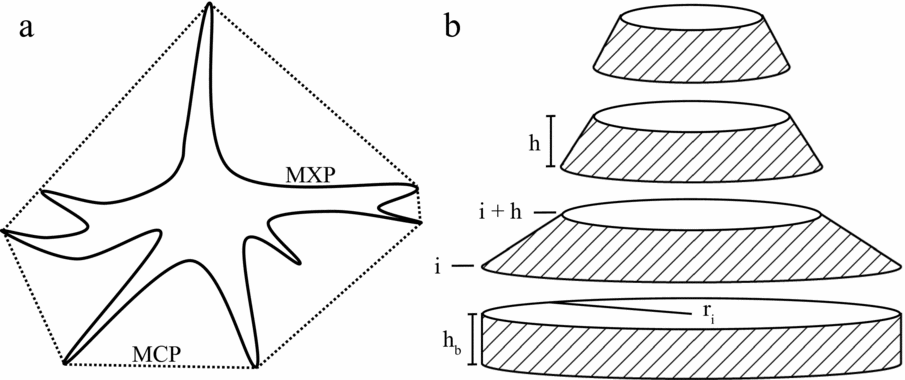
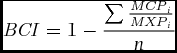
A Buttress Complexity Index (BCI) was developed to measure how structurally complex a buttress microhabitat was. The BCI is a proportional measure of the extra surface area buttressing provided irrespective of overall tree size. A series of specialized paired measurements were required to calculate BCI. Minimum Convex Polygon (MCP) was measured by connecting the outermost points of a buttress to create the smallest possible circumference measurement at a given height. Maximum Perimeter (MXP) was measured by following the contours of the buttresses at the same height as MCP (Figure 1). Both measurements were to the nearest cm. These measurements are used in the equation,
 \begin{equation}
{\it BCI} = 1 - \frac{{\sum {\frac{{{\it MCP}_i }}{{{\it MXP}_i }}} }}{n}\end{equation}
where n is the number of measurement pairs for each height and i is the ith measurement interval. A perfectly cylindrical tree would have a BCI of 0 while an infinitely complex tree would have a BCI approaching 1. Dividing MCPi by MXPi discounts overall tree size and further dividing the quotient by the number of measurement pairs discounts the number of measurements.
Illustration of measurements for the Buttress Complexity Index (BCI) and buttress surface area. Transverse cross section of Maximum Perimeter (MXP, solid line) and Minimum Convex Polygon (MCP, dashed line) measurements about a tree buttress used to measure BCI (a). Exploded diagram of surface area calculations (only lateral, shaded edges included; b). ri is radius at height i, h is the distance between height intervals, and hb is the distance between the first measurement and the ground. These three variables are used to estimate buttress surface area.

Surface area of the first 2 m of the trees was also estimated by,
 \begin{eqnarray}
{\it SA} = \sum {(\pi (r_i + r_{i + h} )\sqrt {(r_i - r_{i + h} )^2 + h^2 } ) + 2\pi r_l h_b }\nonumber\\
\end{eqnarray}
where n is the number of height intervals (four in this study), ri is the radius (calculated by r = C/π/2) of the MXP at height interval i (5.0, 1.0, 1.5 and 2.0 m in this study), h is the distance between height intervals (0.5 m), and hb is the distance between the lowest height interval and the ground (hb = h in this study; Figure 1b).
The BCI, diameter at breast height (dbh), surface area, total tree height, leaf litter depth and overstorey density of four groups of trees were compared using Kruskal–Wallis tests: large occupied trees (with 4 or more individuals), small occupied trees (with 2–3 individuals), unoccupied near trees, and unoccupied dispersed trees. Post hoc pairwise comparisons were made using Wilcoxon tests with Holm adjusted α values. The side of the tree whip spiders were found on was tested for significance against an expected even distribution via a chi-square goodness-of-fit test (Zar Reference ZAR1999).
To further identify potential differences between occupied and unoccupied trees, the difference between the mean number of whip spiders on trees with a BCI = 0 and BCI > 0 was tested with a Wilcoxon rank sum test (W), as was the difference between the mean BCI of trees with and without whip spiders. Comparisons were considered significant at α = 0.05 and means were reported as $\bar{x}$ ± SD. Statistics were calculated using R 3.0.0 (R Foundation for Statistical Computing, Vienna, Austria).
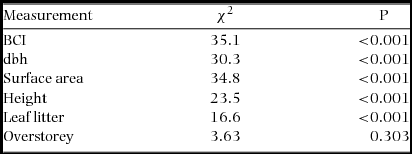
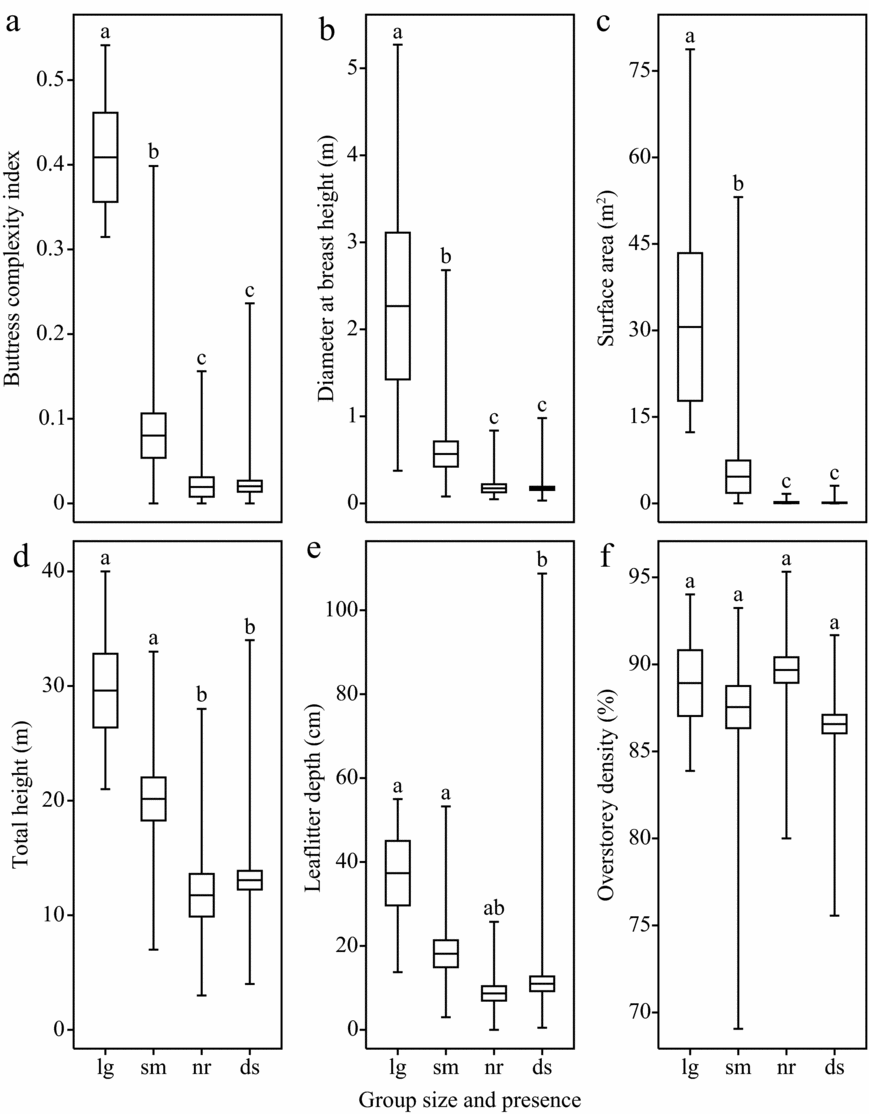
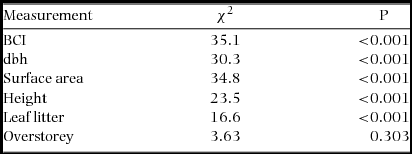
Seventy-five whip spiders were found occupying 25 trees, and an additional 25 unoccupied near and 70 unoccupied dispersed trees were measured (n = 120). Kruskal–Wallis tests indicated significant differences between groups for BCI, surface area, dbh, total tree height and leaf litter depth but not overstorey density (Table 1). Post hoc comparisons between trees with large groups, small group, near trees, and dispersed trees indicate that large groups preferred large, complex trees with greater leaf litter compared with small groups (Figure 2). These findings are in agreement with Dias & Machado (Reference DIAS and MACHADO2006), Hebets (Reference HEBETS2002) and Weygoldt (Reference WEYGOLDT1977) of other whip spider species, Beck & Görke (Reference BECK and GÖRKE1974) of H. batesii (as Admetus pumilio), and supports other research suggesting that selective logging negatively impacts whip spiders (Dias & Machado Reference DIAS and MACHADO2006).
Results of Kruskal–Wallis rank sum tests for indicated tree measurements. Four tree types were compared: trees with large groups of Heterophrynus batesii (4+; n = 5), with small groups (2–3; n = 20), unoccupied near (n = 25), and unoccupied dispersed trees (n = 70; df = 3). BCI, Buttress Complexity Index; dbh, diameter at breast height.
Comparison of trees used by Heterophrynus batesii groups with trees available in the environment. Large groups (lg) had more than four individuals and small groups (sm) had two or three. Near trees (nr) were randomly selected within 20 m of a tree used by a group, while dispersed trees (ds) were randomly selected throughout the survey area at Tiputiní Biodiversity Station in Yasuní, Ecuador. Horizonal lines represent means, boxes represent SE, and whiskers represent range. Buttress complexity index (a), diameter at breast height (equal to the diameter of the minimum convex polygon measurement at a height of 1.5 m; (b) and surface area (estimated using maximum perimeter measurements; (c) are shown as methods for measuring H. batesii microhabitat. Total tree height (d), leaf litter depth (e) and overstorey density (f) are also shown. Differences between groups were tested using Wilcoxon tests with Holms adjusted α values after a significant Kruskal–Wallis group-wide test.
Phrynus longipes was observed facing down more than any other orientation (90.4%; χ 21 = 162, P < 0.0001), and were never observed oriented up. Facing down probably utilizes gravity to aid prey capture (Dias & Machado Reference DIAS and MACHADO2006, but see Rao et al. Reference RAO, FERNANDEZ, CASTAÑEDA-BARBOSA and DÍAZ-FLEISCHER2011). The side of the tree H. batesii was found was not different from an expected even ratio. This corroborates the lack of overstorey density preference and indicates that night-time light levels are likely unimportant for H. batesii.
For 36.0% of occupied trees and 86.0% of unoccupied trees BCI = 0. The mean group size on trees with a BCI > 0 (1.69 ± 2.09, range: 0–7, n = 32) was greater than on trees with a BCI = 0 (0.26 ± 0.76, range: 0–3, n = 89; W = 832, P < 0.001). The mean BCI and SA of trees with whip spiders (BCI: 0.15 ± 0.18, SA: 9.83 ± 19.3 m2, n = 25) was greater than unoccupied trees (BCI = 0.02 ± 0.05, W = 582, P < 0.0001; SA: 0.11 ± 0.42 m2; W = 310, P < 0.0001, n = 96). Surface area showed a similar trend (Figure 2c). This is likely because buttress complexity is more predictive than overall surface area which does not account for complexity. The maximum number of whip spiders was seven for buttressed trees and three for trees without buttresses. This indicates that large whip spider groups require large trees. Results on the height at which H. batesii were found (0.60 ± 0.55 m) corroborates this finding; whip spiders were never found above 2.2 m, where the complex environment buttressing provides is diminished. Buttress complexity is likely the most important component of tree size.
Group formation is often context-dependent (Campbell et al. Reference CAMPBELL, WEINER, STARKS and HAUBER2009, Starks et al. Reference STARKS, FISCHER, WATSON, MELIKIAN and NATH1998). For example, females of the western black widow (Latrodectus hesperus) form groups in winter but live solitarily otherwise (Salomon et al. Reference SALOMON, VIBERT and BENNETT2010), some pholcid spiders (e.g. Holocnemus pluchei) leave or join groups depending on feeding success relative to life stage (Jakob Reference JAKOB2004), and juvenile fish disperse depending on microhabitat size and conspecific density (Bergmüller et al. Reference BERGMÜLLER, HEG and TABORSKY2005, Wong Reference WONG2010). At least two species of whip spider have been observed living in groups in nature: Heterophrynus longicornis (Weygoldt Reference WEYGOLDT1977) and H. batesii of this study. The adaptive purpose of whip spider groups remain unknown, but this study certainly shows that H. batesii is found in aggregations and exhibits tolerance toward conspecifics. This is likely a derived trait considering that most species of whip spider are cannibalistic (Weygoldt Reference WEYGOLDT2000). Other field research concluded that some whip spider species occur solitarily (Dias & Machado Reference DIAS and MACHADO2006), and a recent study found that about a third of individuals were found in pairs or groups on the same tree (Carvalho et al. Reference CARVALHO, GOMES, NECKEL-OLIVEIRA and LO-MAN-HUNG2012). A study in Costa Rica found that the number of Phrynus parvulus visiting a tree increased with tree size and site fidelity was higher for trees with buttresses (Hebets Reference HEBETS2002). While a few field studies have investigated the ecology of whip spider groups, none has examined the behaviour or evolution of grouping in detail. Future research should be directed at the adaptive value and behavioural ecology of facultative group formation in these species.
ACKNOWLEDGEMENTS
This research was funded by the Lloyd David and Carlye Cannon Wattis Foundation through the Denver Museum of Nature and Science and Research Enhancement and Student Research Grants provided by the Killgore Research Center and the Graduate School of West Texas A&M University. The Department of Life, Earth & Environmental Sciences and the Killgore Research Center of WTAMU provided additional funding and equipment. I am grateful to Drs W. David Sissom, Rocky Ward and Richard Kazmaier for helpful reviews and support. Thanks also to Drs Kelly Swing and David Romo, Paula Cushing, Anthony DiFiore and field assistant Taylor G. Donaldson. Research was conducted under República del Ecuador Ministerio del Ambiente permit/export number 006–10-EXO-XI-FAU-DPO/MA.