Implications
The practical application of genomic selection in pigs is still in its infancy. The implementation of genomic selection in pig-selection schemes based on full-sib testing of boars for traits recorded on meat or carcass quality was evaluated with a simulation study. No advantages could be achieved for traits with moderate heritability – that is, production or carcass traits. Some advantages could be expected for traits with low heritability – that is, several meat quality parameters such as pH or cooking losses. Other strategies of genomic selection should be considered in a similar population to exploit the potential advantages derived by its inclusion in breeding programs.
Introduction
Genomic selection is the use of genome-wide dense markers to predict breeding values (BVs) of selection candidates (Meuwissen et al., Reference Meuwissen, Hayes and Goddard2001), and it is now considered the new frontier of genetic improvement in dairy cattle (Hayes et al., Reference Hayes, Bowman, Chamberlain and Goddard2009b; Pryce and Daetwyler, Reference Pryce and Daetwyler2012). Compared with traditional breeding programs, genomic selection is expected to enhance the genetic progress mainly (i) by reducing the generation interval through the prediction of more accurate BVs of young bulls at a very early age, well before knowing the yields of their daughters (Schaeffer, Reference Schaeffer2006), and (ii) by increasing the accuracy of BVs of breeding candidates (VanRaden et al., Reference VanRaden, Van Tassel, Wiggans, Sonstegard, Schnabel, Taylor and Schenkel2009). The shortening of generation interval in dairy breeding programs can result in cost reduction and increased economic gain (Koenig and Swalve, Reference Koenig and Swalve2009).
The availability of a commercial single nucleotide polymorphism (SNP) panel for high-throughput genotyping in pigs (Ramos et al., Reference Ramos, Crooijmans, Affara, Amaral, Archibald, Beever, Bendixen, Churcher, Clark, Dehais, Hansen, Hedegaard, Hu, Kerstens, Law, Megens, Milan, Nonneman, Rohrer, Rothschild, Smith, Schnabel, Van Tassell, Taylor, Wiedmann, Schook and Groenen2009) makes the introduction of genomic selection in breeding programs for this livestock species possible. However, compared with dairy cattle programs, pig breeding programs are characterized by populations structured in pyramidal organizations with high selection intensity and short generation intervals (Dekkers et al., Reference Dekkers, Mathur and Knol2011; Tribout et al., Reference Tribout, Bidanel, Pochas, Schwob, Guillaume and Larzul2011). In addition, some current selection schemes are designed to optimize phenotypes of meat quality and/or carcass traits that can only be measured postmortem. To overcome this issue, sib-testing programs have been implemented. Potential advantages of genomic selection in pig breeding have been reported by several simulation studies that modeled reproduction or performance traits collected on living animals (Lillehammer et al., Reference Lillehammer, Meuwissen and Sonesson2011; Henryon et al., Reference Henryon, Berg, Ostersen, Nielsen and Sørensen2012; Tribout et al., Reference Tribout, Larzul and Phocas2012 and Reference Tribout, Larzul and Phocas2013; Akanno et al., Reference Akanno, Schenkel, Sargolzaei, Friendship and Robinson2014). To our knowledge, no studies have evaluated yet the integration of genomic selection in pig breeding programs based on full-sib testing of candidate boars. A similar program differs from others already considered in the literature because phenotyped and genotyped pigs (training population) in a sib-testing program are represented by a limited number of slaughtered relatives used to collect information on meat and carcass traits. This aspect has not been considered thus far by other simulation studies already reported in pigs by a few authors who investigated sex-related traits or traits collected in living animals (Lillehammer et al., Reference Lillehammer, Meuwissen and Sonesson2011; Tribout et al., Reference Tribout, Larzul and Phocas2013). Sib testing is the typical program implemented to overcome the limits derived (i) by traits measured postmortem and (ii) by sanitary constraints that prevent the movement of the boars in performance stations. The Italian heavy pig selection program is structured on this scheme: three full sibs of the candidate boar are performance tested in a test station, and phenotypes are collected on their carcasses at the end of the testing period. Animals with recorded measures cannot have progeny, but phenotypic data are used to evaluate their brother (the candidate boar) that is not directly phenotyped and neither is moved from the native farm.
Using simulated data, the objective of this paper was to evaluate the potential improvements of the BVs in terms of prediction ability after the implementation of different genomic selection strategies in a selection program for traits recorded on meat or carcass quality based on sib testing of candidate boars.
Material and methods
Population structure
The QMSim software (Sargolzaei and Schenkel, Reference Sargolzaei and Schenkel2009) was used to simulate a pig population using a forward-in-time process, including 60K SNP simulated data (57 168 SNPs) and 180 simulated quantitative trait loci (QTL) distributed across the 18 autosomes. Each chromosome was assumed to have an average dimension of 136 cM (centiMorgans) to obtain a total amount of 2448 cM similar to the real pig genome size (Groenen et al., Reference Groenen, Archibald, Uenishi, Tuggle, Takeuki, Rthshild, Rogel-Gailard, Park, Milan, Megens, Li, Larkin, Kim, Frantz, Caccamo, Ahn, Aken, Anselmo, Anthon, Auvil, Badaoui, Beattie, Bendixen, Berman, Blecha, Blomberg, Bolund, Bosse, Botti, Bujie, Bystrom, Capitanu, Carvalho-Silva, Chardon, Chen, Cheng, Choi, Chow, Clark, Clee, Crooijmans, Dawson, Dehais, De Sapio, Dibbits, Drou, Du, Eversole, Fadista, Fairley, Faraut, Faulkner, Fowler, Fredholm, Fritz, Gilbert, Giuffra, Gorodkin, Griffin, Harrow, Hayward, Howe, Hu, Humphray, Hunt, Hornshøj, Jeon, Jern, Jones, Jurka, Kanamori, Kapetanovic, Kim, Kim, Kim, Kim, Larson, Lee, Lee, Leggett, Lewin, Li, Liu, Loveland, Lu, Lunney, Ma, Madsen, Mann, Matthews, McLaren, Morozumi, Murtaugh, Narayan, Nguyen, Ni, Oh, Onteru, Panitz, Park, Park, Pascal, Paudel, Perez-Enciso, Ramirez-Gonzalez, Reecy, Rodriguez-Zas, Rohrer, Rund, Sang, Schachtschneider, Schraiber, Schwartz, Scobie, Scott, Searle, Servin, Southey, Sperber, Stadler, Sweedler, Tafer, Thomsen, Wali, Wang, Wang, White, Xu, Yerle, Zhang, Zhang, Zhang, Zhao, Rogers, Churcher and Lawrence2012). Markers and QTLs were assumed to be bi-allelic and randomly distributed along the genome. The allele frequency of the QTLs was sampled from a uniform distribution in each replicate, whereas the allelic effects of the QTLs were randomly sampled from a γ distribution with shape parameter equal to 0.4, similar to previous simulations (Sonesson and Meuwissen, Reference Sonesson and Meuwissen2009). The allelic effects of QTLs were simulated in the last historical generation. They were first sampled, based on the γ distribution, and then scaled such that the sum of QTL variances in the last historical generation equals the pre-defined QTL additive variance. In this simulation process, no relative QTL variances were pre-defined for each QTL.
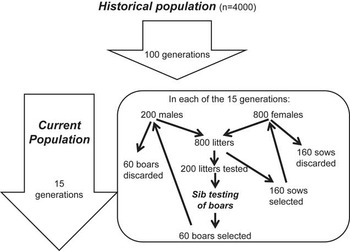
The population was simulated in two steps as follows: (1) the historical population and (2) the current population. The historical population consisted of 4000 animals over 100 generations, without any bottleneck (Figure 1) and with a mating system based on the union of gametes randomly sampled from the male and female gametic pools. No selection was considered in the historical population. In the current population, to mimic a selection process similar to that of the sib-testing selection scheme of candidate boars, it was necessary to simulate litters with at least four sibs (two males and two females) that fulfilled the needs to obtain the candidate boar and three sibs (two females and one castrated male) for the phenotyping in the performance station and at the abattoir after slaughtering. The simulated current population was selected over 15 cycles with an assortative mating design based on phenotypes. Sire and dam culling strategies were based on BVs estimated by BLUP using Henderson’s mixed linear equations (Henderson, Reference Henderson1975) for an individual animal model using the true additive genetic variance. In each cycle, 200 sires were mated with 800 dams to produce 800 litters of 4 piglets, two males and two females, resulting in a total of 3200 newborns/cycle (1 year/cycle). From this latter group of newborns, at every cycle, 60 boars and 160 sows were selected for the replacement (Figure 1). This happened for 15 cycles.
Flow chart of the simulated pig population.

Data editing
Phenotypes of 49 000 pigs (parents of the last historical population and piglets of the 15 cycles of the current population) and genotypes of 16 000 animals (pigs of cycles 11 to 15 of the current population) were simulated. On that data, editing was done to mimic the selection program based on sib testing of boars. It was considered that, at every cycle, the best 200 candidate boars according to their BV were sib tested and that all four piglets of each litter (the candidate boar and the three performance-tested full sibs) in cycles from 11 to 15 were genotyped, whereas phenotypes were collected only on the three tested full sibs in cycles from 11 to 14. This process produced 4000 genotyped pigs (four piglets, 200 litters and five cycles) and 2400 piglets with phenotypic information within the sib-testing program (three piglets, 200 litters and four cycles). Therefore, the training population comprised of the 2400 performance-tested and slaughtered pigs that had both genotypic information and phenotypic records collected in performance test stations and after slaughtering. The prediction population included pigs of the last cycle that were genotyped but not yet phenotyped and the candidate boars with no records on performance and carcass traits. In every repetition, the pedigree was extracted from simulated data with a pruning process to have three generations of ancestors of the group of pigs with genotype or phenotype data.
The total number of SNPs of the simulated genome was edited according to the quality control of minor allele frequency of markers >0.05.
Genomic breeding values (GEBV)
Genomic selection requires, as a first step, the definition of prediction equations based on estimated marker effects from genotypic and phenotypic data of a reference population. Different assumptions on marker effect distributions were proposed for this first step and used in prediction equations to calculate BVs of animals with genotypic but without phenotypic information. Finally, a single-step method, considered as the extension of the genomic method to non-genotyped animals with the incorporation of marker information into the traditional pedigree-based method (Legarra et al., Reference Legarra, Aguilar and Misztal2009; Aguilar et al., Reference Aguilar, Misztal, Johnson, Legarra, Tsuruta and Lawlor2010), was applied.
Summarizing, the following methods were considered in this work:
-
1. Traditional BLUP Animal Model (BLUP_EBV);
-
2. genomic BLUP (GBLUP) using raw phenotypes, assuming that marker effects were distributed according to a normal distribution with equal variances for all SNPs (Meuwissen et al., Reference Meuwissen, Hayes and Goddard2001);
-
3. genomic BLUP (GBLUP_EBV) using BLUP_EBV BVs as phenotypes and assuming that marker effects were distributed according to a normal distribution with equal variances for all SNPs;
-
4. genomic BV (Bayes C), a mixture model single common locus variance that assumes that only few SNPs have significant effects (Habier et al., Reference Habier, Fernando, Kizilkaya and Garrick2011);
-
5. genomic BV (BLasso) that assumes that marker effects follow a double exponential distribution (Yi and Xu, Reference Yi and Xu2008; De los Campos et al., Reference De los Campos, Naya, Gianola, Crossa, Legarra, Manfredi, Weigel and Cotes2009), which is a thick-tailed distribution;
-
6. genomic BV (PI) that assumes that the marker effects follow a mixture of normal distributions and includes an estimation of the proportion of SNP with zero effects (π) and a common variance for all fitted SNP (Habier et al., Reference Habier, Fernando, Kizilkaya and Garrick2011);
-
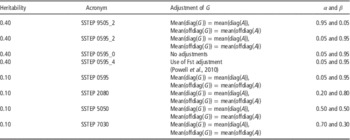
7. a genomic single-step (SSTEP) evaluation on the basis of the use of a relationship matrix (H) integrating the genomic coefficients (G) into the numerator relationship matrix (A) to estimate BVs that use all phenotypic, pedigree and genomic information simultaneously (Legarra et al., Reference Legarra, Aguilar and Misztal2009; Misztal et al., Reference Misztal, Legarra and Aguilar2009). Different adjustments of G to make it compatible with A, as well as various blending of G and A, with assigned relative emphasis of α and β, respectively, into the modified G (G m ) as G m =(α×G+β×A 22) to account for genomic relationships in the part of the matrix H pertaining to relationships among pigs with genotyping data were evaluated (Table 1).
Adjustments of G matrix to fit the scale of A matrix and various values of α and β for blending, respectively, the genomic relationship matrix (G) with the additive relationship matrix (A) into the modified genomic relationship matrix (G m ) as G m =(α×G+β×A22) for relationships among pigs with genotyping data

The matrix G m serves to build the sub-matrix part of relationships among genotyped pigs in the whole relationship matrix (H) in SSTEP models, accounting for both the genomic (where available) and the additive relationships among population pigs. SSTEP models were applied to two different levels of heritability (h 2=0.40 or h 2=0.10) in the simulated pig population selected for carcass or meat quality traits.
Variance component estimations and BV predictions were calculated by software GS3 (Legarra et al., Reference Legarra, Ricard and Filangi2013) and BLUPF90 Package (Misztal, Reference Misztal2008). In order to best compare different strategies, the same simulated data set was used in all evaluations with equal number of pedigree information, phenotypic and genotypic data.
The predictive ability of each method was evaluated using the accuracy of GEBV calculated as the correlation between the estimated and the true BVs in various subsets of data: for all data or for specific groups of pigs in the simulated population (training and prediction populations). The process was repeated 50 times for each heritability level starting, each replicate, from the simulation process of the population. Standard errors were computed as the standard deviation of predictive abilities across the 50 replicates divided by the square root of 50.
Repetitions and heritability
For each method, the whole simulation process (editing of data, variance components, marker effect estimation and calculation of BVs) was repeated twice considering the following two different types of traits: (1) traits with intermediate heritability (0.40) – for example, carcass traits or average daily gain; (2) traits with low heritability (0.10) – for example, for several meat quality parameters such as the average values for pH or cooking losses (Suzuki et al., Reference Suzuki, Irie, Kadowaki, Shibata, Kumagai and Nishida2005). The simulated genome reflected what is known of the effects on meat quality, carcass and performance traits, as also reported in Italian heavy pig populations: a limited number of major QTLs explaining part of the genetic variance (Van Laere et al., Reference Van Laere, Nguyen, Braunschweig, Nezer, Collette, Moreau, Archibald, Haley, Buys, Tally, Andersson, Georges and Andersson2003; Fontanesi et al., Reference Fontanesi, Speroni, Buttazzoni, Scotti, Dall’Olio, Nanni Costa, Davoli and Russo2010 and Reference Fontanesi, Buttazzoni, Galimberti, Calò, Scotti and Russo2013), and the remaining additive variance distributed along the genome on several genes with small effects, as also demonstrated by results in genome-wide association studies (i.e. Fontanesi et al., Reference Fontanesi, Schiavo, Galimberti, Calò, Scotti, Martelli, Buttazzoni, Casadio and Russo2012). In the first run, for each heritability level, various assumptions on marker effect distributions and different SSTEP model parameters were tested (Tables 2 and 3) to retain a reduced number of possibilities in the following repetitions. In the repetitions 2 to 50, BVs were calculated and compared for each heritability level using the following four methods: BLUP_EBV, GBLUP, GBLUP_EBV and SSTEP. For SSTEP, only one option set was considered for each of the two heritability levels (SSTEP 0595_2 for heritability of 0.40; SSTEP 2080 for heritability of 0.10).
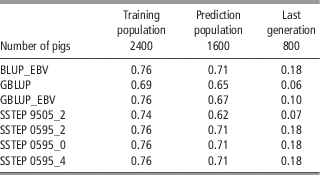
Correlation values calculated in the first simulation run between genomic breeding value (BV) and true BV for the whole population, the training and the predicted populations of pig population selected for traits with heritability=0.40
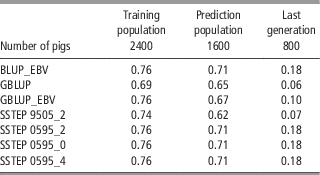
BLUP_EBV=BLUP Animal Model BV; GBLUP=genomic BV assuming equal variance for all markers; GBLUP_EBV=GBLUP BV with the BLUP_EBV as phenotype; SSTEP 9505_2=single-step genomic BV with adjustment of G matrix in order to have mean of diagonals, and of off-diagonals, of G matrix equal to A matrix and blending of G and A matrices of 0.95 and 0.05 into the combined matrix; SSTEP 0595_2=single-step genomic BV with adjustment of G matrix in order to have mean of diagonals, and of off-diagonals, of G matrix equal to A matrix and blending of G and A matrices of 0.05 and 0.95 into the combined matrix; SSTEP 0595_0=single-step genomic BV with no adjustments of G matrix and blending of G and A matrices of 0.05 and 0.95 into the combined matrix; SSTEP 0595_4=single-step genomic BV with Fst adjustment of G matrix and blending of G and A matrices of 0.05 and 0.95 into the combined matrix.
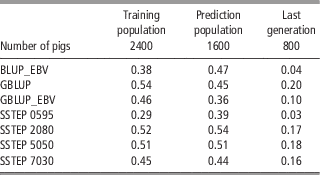
Correlation values calculated in the first simulation run between genomic breeding value (BV) and true BV of the whole population, the training and the predicted population of a pig population selected for traits with heritability=0.10

BLUP_EBV=BLUP Animal Model BV; GBLUP=genomic BV assuming equal variance for all markers; GBLUP_EBV=GBLUP BV with the BLUP_EBV as phenotype; SSTEP 0595=single-step genomic BV with adjustment of G matrix in order to have mean of diagonals, and of off-diagonals, of G matrix equal to A matrix and blending of G and A matrices of 0.05 and 0.95 into the combined matrix; SSTEP 2080=single-step genomic BV with adjustment of G matrix in order to have mean of diagonals, and of off-diagonals, of G matrix equal to A matrix and blending of G and A matrices of 0.20 and 0.80 into the combined matrix.
Results
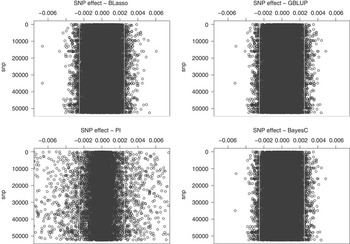
Prediction abilities obtained by various models (BLUP_EBV, GBLUP on field phenotypes, GBLUP_EBV and SSTEP models with different parameters) and different prior effect distributions (normal distribution, a double exponential distribution and mixture of normal distributions) were always similar or lower than the prediction ability of BLUP_EBV in the first run of each heritability level. These results were obtained although marker effect estimation varied among models (Figure 2), with differences in size and variability of effects. Nonetheless, when heritability of 0.40 was assumed, the prediction ability of the GEBVs of these models, assuming different distributions of marker effects, was between 0.65 and 0.67 for the prediction population with a small range of variation between models.
Single nucleotide polymorphism (SNP) effects estimated with the GBLUP model (GBLUP), the Bayes C model (Bayes C), the Bayesian Lasso model (BLasso) and the model assuming that SNP markers follow a mixture of normal distributions (PI) in a simulation run with a trait of 0.40 heritability.

Therefore, subsequent results were reported only for the GBLUP methods (with raw phenotypes – GBLUP, or BVs – GBLUP_EBV), which assume a normal distribution of SNP effects, and for one option set of the SSTEP BVs that incorporates both pedigree and marker information.
Traits with moderate heritability
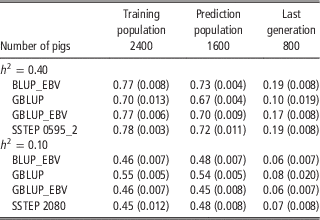
Phenotypes considered in marker effect estimation may be merely raw data or estimated BV predictions. This second approach might be advantageous for some traits – for example, sex-related traits – or for selection programs with data collection limited to a specific group of animals, as in the case of sib performance testing (Garrick et al., Reference Garrick, Taylor and Fernando2009). In fact, in the simulated population, when BVs were used instead of raw phenotypes for a trait with heritability of 0.40, some improvement in predictive ability of genomic evaluations were obtained: from 0.73 to 0.77 on average in the whole population and from 0.67 to 0.70 in the predicted population (Table 4). However, predictive abilities were still equal or lower than those of BLUP_EBV, indicating that no advantages might be expected by the introduction of genomic selection in a pig improvement program based on sib testing, with the simulated size of the training population and for traits with similar heritability.
Average of correlation values and standard errors (in parenthesis) over 50 replicates, for each heritability value (0.40 or 0.10), calculated between various genomic breeding values (BV) and true BV for the whole population, the training population, the predicted population and the animals of the last cycle in a pig population selected for quality or carcass traits

BLUP_EBV=BLUP Animal Model BV; GBLUP=genomic BV assuming equal variance for all markers; GBLUP_EBV=GBLUP BV with the BLUP_EBV as phenotype; SSTEP 0595_2=single-step genomic BV with adjustment of G matrix in order to have mean of diagonals, and of off-diagonals, of G matrix equal to A matrix and blending of G and A matrices of 0.05 and 0.95 into the combined matrix; SSTEP 2080=single-step genomic BV with adjustment of G matrix in order to have mean of diagonals, and of off-diagonals, of G matrix equal to A matrix and blending of G and A matrices of 0.20 and 0.80 into the combined matrix.
Models based on SSTEP strategies were applied here to evaluate the effect on prediction ability while jointly considering pedigree information, phenotypes and genotypes. Phenotypes were collected merely on carcasses of full sibs of candidate boars within the performance-testing programs; however, GEBV from SSTEP models accounted not only for the training population data (full sibs of candidate boars) but also for the pedigree data, and therefore for collateral related animal performances, as well as, although later in the boar’s life, for the progeny performances. According to the literature, the SSTEP procedure is expected to increase the prediction ability of classical genetic evaluation by adding genomic information (Aguilar et al., Reference Aguilar, Misztal, Johnson, Legarra, Tsuruta and Lawlor2010; Christensen et al., Reference Christensen, Madsen, Nielsen, Ostersen and Su2012). However, in the simulated population and for a trait with heritability of 0.40, results were slightly favorable in the whole population (0.76 on average v. 0.68 with BLUP_EBV), but prediction abilities of the group of prediction animals were comparable with those of the traditional genetic evaluation based on pedigree data (on average 0.72 with the SSTEP model and 0.73 with the BLUP_EBV, Table 4). Adjustments of the G matrix only slightly influenced the prediction ability, whereas large changes were obtained by modifying blending emphases between the G and the A matrix, with the most favorable results when almost all emphases were assigned to data of the relatives (Table 2). Anyway, prediction ability for the prediction animals was never larger than that obtained by the BLUP_EBV evaluation.
Traits with low heritability
The results obtained for traits with low heritability (h 2=0.10) showed some advantages when genomic selection was included. For low heritability traits, correlation between traditional BVs and true BVs was only 0.53. It was even lower in animals of the last cycle that do not have direct phenotypic information but only data on their genotype (Table 4). The introduction of genomic selection gave an advantage just by considering raw phenotypic data (0.55 prediction ability in the training population with GBLUP), but it did not increase the prediction ability when EBVs were used as phenotypes (0.46 in the training population on average). Prediction ability of genomic selection was not significantly increased by implementing a SSTEP model when compared with GBLUP values (Table 4). In this case, the most favorable situation of blending G and A matrix was 20/80, which gives large emphasis to records of the relatives (Table 3). The best combination of blending G and A of 20/80 might indicate that, although genomic data slightly increased the prediction ability of SSTEP genomic evaluations, pedigree and phenotypic information still played a key role in EBV predictions in the population structure we considered, as probably markers were not able to capture all the genetic variance probably because of the limited number of full sibs available.
Discussion
Simulation of data
To evaluate the effects of the introduction of genomic selection in a pig population, pedigree structure, phenotypes and genotypes were jointly simulated. Starting from these data, editing was done to obtain a population with the desired structure of sib testing of boars to predict GEBV. This approach has the advantage of allowing the accuracy of BVs to change depending on the estimation of SNP effects and the distance between the reference and the predictive populations (Pryce and Daetwyler, Reference Pryce and Daetwyler2012). Nevertheless, in this way, the size of the simulated population and the size of the training population required to have both phenotypic and genotypic data would be limited. In addition, the simulated data mimicked the situation of a population in which genotyping just started for a limited number of generations, considering a limited budget that might be available at the beginning of genomic selection programs.
The number of QTL in the genome and their effects were defined as prior information in simulating a real population, knowing that just a few important QTL for production traits segregate in heavy pig populations (Fontanesi et al., Reference Fontanesi, Speroni, Buttazzoni, Scotti, Dall’Olio, Nanni Costa, Davoli and Russo2010, Reference Fontanesi, Schiavo, Galimberti, Calò, Scotti, Martelli, Buttazzoni, Casadio and Russo2012 and Reference Fontanesi, Buttazzoni, Galimberti, Calò, Scotti and Russo2013). This prior information would affect results (Daetwyler et al., Reference Daetwyler, Pong-Wong, Villanueva and Woolliams2010), and in the present study it was decided to simulate a limited number of major QTL per chromosome. Moreover, many questions are still pending about the true model underlying the genetic variation of traits that is still largely unknown (Clark et al., Reference Clark, Hickey and van der Werf2011): hypotheses range from an infinitesimal model (many genes each with a very small effect) to QTL models, considering that only few genes affect the trait with a consistent effect and the other genes have a very small effect. The assumptions taken on the simulated genome (the number of SNPs reflected the most common commercially available SNP panel in pigs; Ramos et al., Reference Ramos, Crooijmans, Affara, Amaral, Archibald, Beever, Bendixen, Churcher, Clark, Dehais, Hansen, Hedegaard, Hu, Kerstens, Law, Megens, Milan, Nonneman, Rohrer, Rothschild, Smith, Schnabel, Van Tassell, Taylor, Wiedmann, Schook and Groenen2009) and on the simulated population structure that mimicked at the best a population really selected for carcass traits by sib testing of boars represent a set of possible different assumptions that should be considered. Nevertheless, based on the homogeneity of results obtained with different methods of predictions, also allowing individual loci to contribute to variation in different ways, it is expected that only big changes in the population structure and/or in the genotyping strategy would probably significantly affect the results reported. Clark et al. (Reference Clark, Hickey and van der Werf2011) stated that to increase the predictive ability of predictions with the inclusion of sequence information and with a polygenic trait, a very large reference population is necessary. In contrast, for traits with large QTL effects, the prediction method was the main factor affecting the interpretation of the underlying genetic variation with Bayes C being the method of choice.
GEBV models
Several types of models have been proposed in the literature to predict GEBV. The first group, purely based on molecular marker data, includes models differing in prior assumptions of the marker effect distribution: normally distributed (GBLUP), thick-tailed (Bayes B) distributed (Meuwissen et al., Reference Meuwissen, Hayes and Goddard2001) or mixture (Bayes C or Bayesian Lasso) of two distributions (Yi and Xu, Reference Yi and Xu2008; De los Campos et al., Reference De los Campos, Naya, Gianola, Crossa, Legarra, Manfredi, Weigel and Cotes2009; Habier et al., Reference Habier, Fernando, Kizilkaya and Garrick2011).
Bayesian approaches for SNP effect estimation gave higher accuracies in dairy cattle multi-breed evaluations compared with the GBLUP method (Hayes et al., Reference Hayes, Bowman, Chamberlain, Verbyla and Goddard2009c). Ostersen et al. (Reference Ostersen, Christensen, Henryon, Nielsen, Guosheng and Madsen2011) argued that for pig pure-bred data, Bayesian mixture models would not perform any better than GBLUP because of the single-breed analysis not requiring a better use of linkage disequilibrium and because of the intense selection of pigs resulting in highly related genotypic and phenotypic data. Considering these different views, various prior distributions of marker effects were analyzed in this simulation study. Indeed, obtained results indicated that the predictive ability of GEBV, merely calculated on molecular marker data, in a pig population selected by sib testing of boars for traits of moderate heritability (0.40) was always similar or lower than that of the traditional BLUP_EBV Model. In particular, in the animals of the last generation, the GBLUP never performed better than the traditional BLUP_EBV, neither in the first run (Table 2) nor over 50 runs of simulation (Table 4). It should be noted that the training population to estimate marker effects was merely represented by sibs of selection candidates, brothers and sisters that were slaughtered before having any progeny. By consequence, BV predictions of the last generation resulted from SNP effects estimated on a training population not made by direct ancestors (neither parents nor grand-parents) of prediction animals. The indirect relationship between the pigs of the last generation and the genotyped animals increased the distance between the reference population and the prediction group and reduced, by consequence, the accuracy of GEBV, as genomic predictions are more accurate when predicted individuals are closely related to the reference population (Habier et al., Reference Habier, Tetens, Seefried, Lichtner and Thaller2010). Moreover, the accuracy of GEBV was further affected by the limited size of the prediction population, determined by both the selection scheme and the sib-testing structure.
Finally, alternative types of information may be used in genomic selection evaluations to constitute a training population: from raw measures for individual phenotypic performances, information on close family members, EBV from genetic evaluations or deregressed EBVs. Garrick et al. (Reference Garrick, Taylor and Fernando2009) discussed and supported the use of deregressed EBVs in a weighted analysis for genomic regression analyses, and the calculation proposed was used for pig genomic evaluations of daily gain and feed conversion ratio (Ostersen et al., Reference Ostersen, Christensen, Henryon, Nielsen, Guosheng and Madsen2011). In our simulated population, from a few runs performed using weighted deregressed EBVs in the training population, the resulting predictive ability was not larger than those obtained using the other information sources (data not shown). When compared with the use of raw data or EBVs to predict GEBV of the population studied here, the lack of advantages with the use of deregressed EBVs depended both on the limited number of slaughtered pigs and on the equal reliabilities of male candidates, which were all tested within a program based on the phenotyping of a fixed number of performance-tested full sibs. In fact, Garrick et al. (Reference Garrick, Taylor and Fernando2009) stated that the benefit from the use of deregressed proofs and the weighting of alternative information sources will depend on the extent to which the reliabilities vary among individuals of the training population. In a selection program, as the one considered here, merely based on the sibs testing to collect phenotypes, the limited variation in reliability values of the training population would limit by consequence the advantages resulting by deregressing and weighting the EBVs in GEBV prediction.
Single-step (SSTEP) methods
The SSTEP model jointly considers pedigree and molecular marker relationships and allows for the simultaneous use of all phenotypes and genotypes in a one-step evaluation without the need of splitting the population into two subsets of training and prediction populations (Legarra et al., Reference Legarra, Aguilar and Misztal2009; Misztal et al., Reference Misztal, Legarra and Aguilar2009). Nevertheless, in contrast to what it was expected from literature results (Aguilar et al., Reference Aguilar, Misztal, Johnson, Legarra, Tsuruta and Lawlor2010; Christensen et al., Reference Christensen, Madsen, Nielsen, Ostersen and Su2012), in this study, the use of SSTEP models, in general, did not show any advantage, probably because of the considered data layout. We assumed that all tested boars were genotyped, whereas their litters were genotyped and phenotyped only when included in the sib-testing program. In recent cycles, phenotypic data recording was limited to sib-tested pigs – that is, animals that are also genotyped – producing, as a consequence, a close correspondence between phenotypic and genotypic data. This closeness, in turn, reduced the potential advantages associated with the use of SSTEP procedures. Advantages should be expected from the use of SSTEP procedures for the selection of traits recorded in a larger number of animals than those that are genotyped. This is a common situation in dairy cattle (Aguilar et al., Reference Aguilar, Misztal, Johnson, Legarra, Tsuruta and Lawlor2010). Christensen et al. (Reference Christensen, Madsen, Nielsen, Ostersen and Su2012), who evaluated pig populations selected for daily gain and feed conversion ratio, reported more accurate predictions with a SSTEP model than with the pedigree-based method for both genotyped and non-genotyped animals. In their study, the large number of phenotypic data recording, together with the use of traits measured directly on candidate breeding stock, exploits the advantages of the use of SSTEP models.
Several different relative emphases on the genomic relationship matrix and on the pedigree relationship matrix were evaluated to build the part of the population relationship matrix pertaining to animals with genotyping data. A large range of values was tested, starting from 0.95 for the genomic relationships and 0.05 for the pedigree relationships, to arrive at the opposite extremes of 0.05 and 0.95, respectively (Table 1). Low values for the weight assigned to the G matrix (0.05) are not common in the literature and correspond to a very low emphasis assigned to the genomic relationships. Nevertheless, in the population considered here, GEBV from SSTEP models approached the predictive ability of the BLUP_EBV only when a very low emphasis was assigned to the genomic relationship matrix leading to the conclusion that, with this specific selection structures and traits collected only on slaughtered sibs of selection candidates, no advantages are expected with the inclusion of genomic information.
Traits with low heritability
A few advantages associated with the use of SSTEP methods were obtained for traits with low heritability recorded in the population simulated within a sib-testing program. Traits with low heritability were simulated in a scenario in which new meat quality traits were collected – for example, pH (Suzuki et al., Reference Suzuki, Irie, Kadowaki, Shibata, Kumagai and Nishida2005) – not yet routinely under selection in most selection programs. As a matter of fact, all traits collected during the sib-testing trials (i.e. average daily gain, feed conversion ratio, back fat thickness, lean meat weight, ham weight, intermuscular visible fat and curing losses) have moderate-to-high heritability, whereas low heritability traits can be ascertained to reproduction or disease-resistance traits. Phenotype collection of the latter traits is generally performed on field, and EBVs are predicted from progeny-testing data. Other simulation studies reported advantages associated with the introduction of genomic selection for reproduction traits with low heritability (Lillehammer et al., Reference Lillehammer, Meuwissen and Sonesson2011). In their case, genomic selection increased the genetic gain by 23% to 91%, with better results when both males and females were genotyped and different strategies for genotyping were implemented. Advantages were larger than those we reported in our study; however, it was noted that, for traits with low heritability, a large number of genotyped and phenotyped animals was required to achieve high-prediction ability (Lillehammer et al., Reference Lillehammer, Meuwissen and Sonesson2011).
Tribout et al. (Reference Tribout, Larzul and Phocas2012) predicted the efficiency of genomic selection in a purebred pig male line. They considered different size of the training population, various traits under selection with different heritability levels (0.20 and 0.40) and various groups of animals on which traits were collected (relatives and/or selection candidates). Advantages were reported for traits with lower heritability, especially with large training populations. On the other hand, genomic selection produced lower prediction ability than the traditional BLUP_EBV evaluation for traits with moderate heritability (h 2=0.40) when the training population with phenotypes and genotypes was made up by relatives of the evaluated candidates, similar to the situation of the sib testing of boars we presented. This would indicate that advantages from genomic selection for a trait with heritability around 0.40 can only be expected if candidates under evaluation are both genotyped and phenotyped. That would of course require a change in the selection organization, which would be possible only for production traits that can be collected on living animals and impossible for carcass or meat quality traits. According to this, when a trait of moderate heritability is under selection, the training population – that is, the group of pigs with both genotypes and phenotypes – should be closely related to the selection candidates and possibly include them. Finally, new pigs should be routinely added to the training population (Sonesson and Meuwissen, Reference Sonesson and Meuwissen2009), as the accuracy of genomic prediction strongly depends on how close the predicted population is related to training pigs (Habier et al., Reference Habier, Tetens, Seefried, Lichtner and Thaller2010; Akanno et al., Reference Akanno, Schenkel, Sargolzaei, Friendship and Robinson2014).
Other strategies
The advantages associated with the introduction of genomic selection in a pig population under selection based on sib testing of boars seem, therefore, limited and mainly restricted to traits with low heritability. Similar conclusions, but for different population structures and purposes, were already reported by other simulation studies (Lillehammer et al., Reference Lillehammer, Meuwissen and Sonesson2011; Tribout et al., Reference Tribout, Larzul and Phocas2012). Another strategy might include the use of genomic data to improve selection accuracy to choose, within each litter, the male candidates for the sib-testing trial. Genotyping all males of each litter, followed by a selection within litter of the best piglet as candidate boar, should increase the genetic gain under genomic selection programs (Lillehammer et al., Reference Lillehammer, Meuwissen and Sonesson2011). However, this strategy could be difficult to implement in practical breeding situations for the short time span between birth and the beginning of the sib test. Because timing is essential to keep short generation intervals in pig selection programs (Dekkers et al., Reference Dekkers, Mathur and Knol2011; Tribout et al., Reference Tribout, Bidanel, Pochas, Schwob, Guillaume and Larzul2011), this issue was not further investigated. In that perspective, the possible co-selection of multiple sibs as selection candidates would not be practical, also for the problems derived by an increased level of inbreeding (Lillehammer et al., Reference Lillehammer, Meuwissen and Sonesson2011). Similarly, another scenario to evaluate may consider the sib testing of only one or two full sibs, in place of three, per boar. In an eventual similar scenario, actually not investigated here for the lack of advantages in prediction abilities, the testing of more boars with less full sibs of candidate boars to be slaughtered would be feasible at the same economic effort.
Finally, large training populations, increasing over time, in a genomic selection scenario (Akanno et al., Reference Akanno, Schenkel, Sargolzaei, Friendship and Robinson2014) should increase the accuracy of genomic evaluation also for traits with moderate heritability, especially when phenotypes are measured on the sibs (Tribout et al., Reference Tribout, Larzul and Phocas2013). Recently, it was suggested that the minimum size of the training population to have a sufficient accuracy of GEBV is of 2000 individuals, with better results with a multigenerational training population (Akanno et al., Reference Akanno, Schenkel, Sargolzaei, Friendship and Robinson2014). Finally, the implementation of a successful genomic selection program should balance the advantages derived from the enlargement of the training population and the extra costs involved in genotyping to assure the maximum benefit associated with selection (Akanno et al., Reference Akanno, Schenkel, Sargolzaei, Friendship and Robinson2014). A potential perspective could include the reorganization of the current swine breeding programs to exploit benefits associated with genomic selection (Dekkers et al., Reference Dekkers, Mathur and Knol2011; Akanno et al., Reference Akanno, Schenkel, Sargolzaei, Friendship and Robinson2014).
Relationship matrixes used in the EBV estimation models are generally based on the predicted proportion of the genome that it is identical by descent given pedigree relationships. Furthermore, the availability of dense genome mapping data may be used to calculate the realized relationship matrix, measuring in a precise way the actual genome proportion of the genome that it is identical by descent with the aim of estimating EBV at a higher accuracy than with the traditional model (Hayes et al., Reference Hayes, Visscher and Goddard2009a). This strategy is extremely interesting in livestock species in order to predict the BVs of individuals without phenotypes but belonging to kinship families – that is, full sibs with phenotypes recorded. Nevertheless, to obtain a sufficient accuracy of GEBV, the number of relatives with phenotypes must be consistent, in the order of about 100 full sibs phenotyped for a reliability of at least 0.50, and this has ended a difficult situation in a pig population selected based on traits recorded on carcass within a full sib-testing program.
Finally, other scenarios and strategies in heavy pig breeds, including the use of low density SNP panels or varying the number of genotyped and phenotyped animals, should be considered and simulated before considering the implementation of genomic selection in a population selected for carcass and meat quality.
Conclusions
The results we presented suggest that the implementation of genomic selection for carcass traits (or other traits not directly recorded on the candidate boars) with medium/high heritability in a pig population in which sib testing of boars was carried out would not be of advantage when compared with the traditional selection programs. To exploit the advantages associated with genomic selection, improvements or changes in terms of population structures might be needed. In particular, the inclusion of a large number of breeding animals in the training population, or the focus on different type of traits – that is, recorded on living animals and not only on carcasses – should be considered. In contrast, health or reproduction traits with low heritability and data collection over the whole population on living animals would probably benefit from the introduction of genomic selection. Further studies are needed to identify the best strategy of application of genomic selection in a similar pig population in order to take advantages from its potential in terms of genetic progress to cover the extra cost for genotyping.
Acknowledgments
The authors thank Drs M. Sargolzaei and F.S. Schenkel for the use of the QMSim software, Dr A. Legarra for the program used for GBLUP evaluations and Dr I. Misztal for supplying the BLUPF90 software. Authors are grateful for the insightful suggestions of the reviewers who helped to improve the manuscript. This study was founded by the Italian Ministry of Agriculture (MiPAAF) within the Innovagen project.