INTRODUCTION
Cognitive functions in Parkinson’s disease (PD) tend to deteriorate over time, and up to 80% of patients may eventually develop dementia (Aarsland et al., Reference Aarsland, Andersen, Larsen, Lolk and Kragh-Sørensen2003; Hely et al., Reference Hely, Read, Adena, Halliday and Morris2008). However, little is known about the rate of change in different cognitive abilities or the pattern of evolution of cognitive deficits. The brevity of follow-up intervals (often 1 year or less), limited assessment of cognitive function (usually just global dementia screening measures), lack of control groups, and insufficient control of practice effects hamper the ability to draw firm conclusions about the nature and extent of cognitive decline in PD (Muslimovic et al., Reference Muslimovic, Schmand, Speelman and de Haan2007). With few exceptions (Reid et al., Reference Reid, Hely, Morris, Broe, Adena, O’Sullivan and Williamson1996; Williams-Gray et al., Reference Williams-Gray, Foltynie, Brayne, Robbins and Barker2007), most studies have examined patients with long-standing disease. In addition, most studies have evaluated cognitive change at a group level, not accounting for individual variability in the trajectory of decline, which is to be expected given the heterogeneity of PD. Hence, it remains to be established how different cognitive domains change over time after the onset of disease, which individual patients exhibit cognitive decline, and what factors predict cognitive deterioration.
Previously, we described the profile of cognitive dysfunction in a cohort of PD patients at the time of diagnosis (Muslimovic et al., Reference Muslimovic, Post, Speelman and Schmand2005). We now report the 3-year follow-up in this cohort. The aims of this study were to (1) assess the nature, magnitude, and frequency of cognitive change in PD patients compared with demographically matched healthy controls; (2) identify individual patients exhibiting cognitive decline; and (3) determine baseline clinical and demographic variables that best predict cognitive decline. In addition, we also report 3-year follow-up data from a cohort of more advanced PD patients in an attempt to examine the influence of disease duration on the pattern of cognitive decline. This issue has rarely been studied in a longitudinal design.
METHODS
Subjects
A total of 116 patients with newly diagnosed PD (NDPD) and 64 patients with established PD (EPD) participated in the neuropsychological assessment at baseline. These patients were part of a larger sample of PD patients who participated in a 3-year longitudinal research project investigating the course of functional decline in PD. Details of the case-finding procedure have been published elsewhere (Muslimovic et al., Reference Muslimovic, Post, Speelman and Schmand2005). In brief, 133 consecutive patients with NDPD were recruited between July 2002 and April 2005 from the neurology outpatient clinics of six general hospitals in Amsterdam and surrounding area in the Netherlands. In addition, 69 patients with more advanced PD were identified from the medical records of the participating hospitals and from the Dutch Parkinson’s Disease Association. A diagnosis of PD was confirmed in all patients at entry to the study by the project neurologist based on standard clinical criteria (Gelb et al., Reference Gelb, Oliver and Gilman1999). Exclusion criteria were age 85 years or older, insufficient command of the Dutch language, neurosurgical operation for relief of motor symptoms, global cognitive deterioration [Mini-Mental State Examination (MMSE) <24] (Folstein et al., Reference Folstein, Folstein and McHugh1975), and the presence of somatic illness with a life expectancy of less than a year.
Seventy spouses or friends of the patients volunteered to serve as control subjects. They were relatives or friends who accompanied the patients to the clinics or they were invited by the patients to participate in the study. None of the controls had impairment in hearing and visual acuity, history of major psychiatric disorders, head injury with loss of consciousness, cerebrovascular disease, current alcohol, substance or psychoactive medication abuse, or other central nervous system diseases that could influence cognitive performance. Written informed consent was obtained from all subjects. The study was approved by the local ethics committees of the participating hospitals.
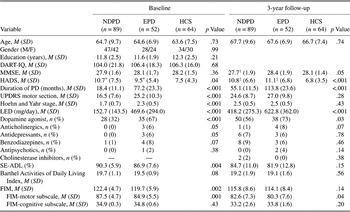
Over 3 years, 5 patients from the NDPD group had died, 17 refused retesting, 3 were not able to participate in follow-up evaluation due to worsening health condition (stroke, renal disease, and pneumonia), and 2 could not be retested due to dementia or severe confusion. Within the EPD group, three patients had died, six refused retesting, one underwent neurosurgery and was no longer eligible, and two were not able to participate because of colon cancer with complications and severe dementia, respectively. Three control subjects refused retesting and three had moved and could not be traced anymore. Thus, 89 patients diagnosed at baseline (77%), 52 established patients (81%), and 64 healthy controls (91%) were available for follow-up. The mean test–retest interval was 37 months (interquartile range 36–38 months). Demographic and clinical characteristics are shown in Table 1.
Demographic and clinical characteristics of NDPD patients, EPD patients, and HCS at baseline and 3-year follow-up

Note
DART-IQ, Dutch Adult Reading Test; HCS, healthy control subjects.
* p < .05 compared to controls.
† p < .05 compared to EPD group.
‡ p < .001 compared to controls.
Procedure
Clinical assessment
A detailed clinical examination was performed at baseline and annually thereafter over a 3-year period. Information about demographic variables, disease history, and drug treatment was obtained at each visit using a semistructured interview. All patients were examined by research nurses with experience in PD. Nurses were trained in administration and scoring of study instruments before starting this project and they performed assessments under supervision of the project neurologist to ensure reliability of ratings (Post et al., Reference Post, Merkus, de Bie, de Haan and Speelman2005). A clinical diagnosis of PD was revalidated by the project neurologist through review of the medical records. Only patients whose diagnosis was confirmed were included in the present analysis.
Extrapyramidal symptoms were rated in “on” phase using the motor section of the Unified Parkinson’s Disease Rating Scale (UPDRS; Fahn et al., Reference Fahn, Elton, Fahn, Marsden, Calne and Goldstein1987). The stage of PD was determined with the Hoehn and Yahr Rating Scale (Reference Hoehn and Yahr1967). Functional status was evaluated using the Schwab and England Activities of Daily Living (SE-ADL) Scale (Schwab & England, Reference Schwab, England, Gillingham and Donaldson1969), the Barthel Activities of Daily Living Index (Mahoney & Barthel, Reference Mahoney and Barthel1965), and the Functional Independence Measure (FIM; Keith et al., Reference Keith, Granger, Hamilton, Sherwin, Eisenberg and Grzesiak1987). The FIM is divided into motor (13 items, possible score range 13–91) and cognitive (5 items, range 5–35) subscales. Higher scores on all scales indicate better functional capacity. Duration of disease was defined as the time between the appearance of the first symptom of PD as reported by the patient and the moment of assessment. Different drugs were pooled and expressed as a levodopa equivalent dose (LED; Esselink et al., Reference Esselink, de Bie, de Haan, Lenders, Nijssen, Staal, Smeding, Schuurman, Bosch and Speelman2004).Footnote a The Hospital Anxiety and Depression Scale (HADS; Zigmond & Snaith, Reference Zigmond and Snaith1983) was used as a screening instrument of affective symptoms.
Neuropsychological assessment
A comprehensive neuropsychological test battery was administered at baseline and 3-year follow-up. All subjects were examined by the same investigator (D.M.) on both assessments. The examination was suspended whenever a patient indicated that he or she went into “off” phase.
Six cognitive domains were evaluated: psychomotor speed, attention, language, memory, executive functions, and visuospatial skills. Psychomotor speed was examined using the Wechsler Adult Intelligence Scale-Revised (WAIS-R) Digit Symbol Test (Wechsler, Reference Wechsler1981), Trail Making Test part A (TMT-A; Reitan, Reference Reitan1992), and Stroop Color Word Test part A (word reading) and part B (color naming) (Stroop, Reference Stroop1935). Attention was assessed with the Trail Making Test part B (TMT-B; Reitan, Reference Reitan1992), Stroop Color Word Test part C (interference condition) (Stroop, Reference Stroop1935), and an adapted version of WAIS-R forward and backward digit span (Lindeboom & Matto, Reference Lindeboom and Matto1994). Language function was examined with the Boston Naming Test (BNT; Kaplan et al., Reference Kaplan, Goodglass and Weintraub1983). Memory was assessed with the Rey Auditory Verbal Learning Test (RAVLT; Rey, Reference Rey1964), Rivermead Behavioural Memory Test (RBMT) Logical Memory (LM) subtest (Wilson et al., Reference Wilson, Cockburn and Baddeley1985), Wechsler Memory Scale-III Faces Recognition subtest (Wechsler, Reference Wechsler1997b), and Visual Association Test (Lindeboom et al., Reference Lindeboom, Schmand, Tulner, Walstra and Jonker2002). Executive functions were examined with the Modified Wisconsin Card Sorting Test (MWCST; Nelson, Reference Nelson1976), Category fluency (animals and supermarket items) (Luteijn & Barelds, Reference Luteijn and Barelds2004), Controlled Oral Word Association Test (COWAT; Benton & Hamsher, Reference Benton and Hamsher1976), Tower of London-Drexel Test (TOL; Culbertson & Zilmer, Reference Culbertson and Zilmer2001), and Wechsler Adult Intelligence Scale (Third Version) (WAIS-III) Similarities (Wechsler, Reference Wechsler1997a). Visuospatial and constructive abilities were assessed with the Judgment of Line Orientation (JOLO; Benton et al., Reference Benton, Hamsher, Varney and Spreen1983), Clock Drawing Test (Royall et al., Reference Royall, Cordes and Polk1998), and the subtest Visuospatial Reasoning of the Groningen Intelligence Test (GIT; Luteijn & Barelds, Reference Luteijn and Barelds2004). To minimize practice effects, we used alternate forms at follow-up where available (RAVLT, RBMT, and COWAT). Due to time constraints and/or patients’ fatigue or cooperation factors, not all tests were administered to all participants.
Statistical Analyses
Group differences in demographic and clinical characteristics at baseline and follow-up were analyzed with one-way analysis of variance, Kruskal–Wallis test, independent sample t test, Mann–Whitney test, and chi-square test where appropriate.
A standardized regression-based method (Frerichs & Tuokko, Reference Frerichs and Tuokko2005; McSweeney et al., Reference McSweeney, Naugle, Chelune and Luders1993) was used to establish the normative pattern and magnitude of cognitive change. This method takes into account sources of measurement error inherent in evaluating cognitive change over time, such as practice effects and regression to the mean, as well as demographic variables that may affect test performance, and initial level of performance. We conducted multiple regression analyses in the control group using baseline test scores, age, sex, and education as possible determinants to derive equations for predicting retest scores for each cognitive measure. The resulting equations were then used to obtain predicted retest scores for PD patients. The differences between the observed and the predicted retest scores were divided by the SE of the estimate to obtain standardized z scores. Negative z scores indicate lower than expected test performance. Paired sample t tests were used to compare observed and predicted follow-up test scores in the two PD groups.
Additionally, standard scores were derived from available normative data for each neuropsychological measure to assess the frequency of cognitive deficits at baseline and follow-up in a more clinically meaningful manner. A test score was categorized as impaired if it was at least 2 SDs below the mean of the normative sample after correction for age and (if possible) for level of education. Normative data provided in test manuals were used. For some tests, normative data were taken from other sources: BNT—Marien et al. (Reference Marien, Mempaey, Vervaet, Saerens and de Deyn1998); TMT-A, TMT-B, Stroop Test, RBMT, and COWAT—Schmand et al. (Reference Schmand, Houx and de Koning2003); and MWCST—Lineweaver et al. (Reference Lineweaver, Bond, Thomas and Salmon1999). For TOL and Clock Drawing Test, standardized residual scores were used as described above. To adjust for the Flynn effect (Flynn, Reference Flynn1987) due to the use of the older version of Digit Symbol Test, we corrected normative data for this test by subtracting 1 SD from the observed scores.
A multivariate normative comparison method (Huizenga et al., Reference Huizenga, Smeding, Grasman and Schmand2007) was employed to identify individual patients exhibiting a significant decline in cognitive performance compared with healthy controls. The pattern of change in test performance of each PD patient over the follow-up interval was compared with the control group to assess whether the patient deviates from the norm on several cognitive variables simultaneously while controlling for false-positive rate due to multiple comparisons. For this analysis, regression-based z scores were used as the dependent variables. We hypothesized that both NDPD and EPD patients would exhibit greater cognitive change than controls (p < .05, one-sided).
Patients with cognitive decline as determined with the multivariate normative comparison method were contrasted with cognitively stable patients to identify baseline demographic and clinical characteristics associated with cognitive deterioration in PD. To examine the contribution of specific motor signs of PD to cognitive decline, the UPDRS motor section was subdivided into six domains (Levy et al., Reference Levy, Tang, Louis, Cote, Alfaro, Mejia, Stern and Marder2000). Facial expression was quantified with item 19. Tremor score was calculated by adding items 20 (tremor at rest) and 21 (action or postural tremor of hands). Rigidity was measured with item 22. Bradykinesia was evaluated with combination of items 24 (hand movements), 25 (rapid alternating movements of hands), 26 (leg agility), and 31 (body bradykinesia and hypokinesia). Speech was rated with item 18. Last, a score for axial impairment was obtained by adding items 27–30 (rising from a chair, posture, gait, and postural stability). Subsequently, all variables that were univariately associated with cognitive decline at p ≤ .15 were entered into a hierarchical multivariate logistic regression analysis, with cognitive status at follow-up as the dependent variable. Per block step, the improvement of the regression model was compared using the likelihood ratio test. The goodness of fit of the model was assessed with the Hosmer–Lemeshow Test. Given the explorative nature of this analysis, we did not statistically correct for multiple comparisons (Rothman, Reference Rothman1990).
Furthermore, we sought to establish the proportion of patients developing dementia at follow-up. We applied clinical diagnostic criteria for dementia recently proposed by the Movement Disorders Society Task Force, which require the presence of cognitive deficits in at least two domains and functional disability resulting from cognitive decline (Emre et al., Reference Emre, Aarsland, Brown, Burn, Duyckaerts, Mizuno, Broe, Cummings, Dickson, Gauthier, Goldman, Goetz, Korczyn, Lees, Levy, Litvan, McKeith, Olanow, Poewe, Quinn, Sampaio, Tolosa and Dubois2007). To this end, composite scores were computed for each cognitive domain by averaging regression-based z scores from the individual tests that contributed to the particular domain and subjecting these composite scores to a multivariate normative comparison method. Cognitive decline was defined here as decrement in two areas of cognitive function other than psychomotor speed relative to the control group. Functional impairment was operationally defined as a score of 4 or less (corresponding to minimal assistance in performing daily tasks) on at least one item from the FIM-cognitive subscale related to the following activities: language comprehension, language expression, social interaction, problem solving, and memory.
At follow-up, 6% of the test scores were missing in the NDPD and EPD groups and 1% in the control group. All analyses were repeated after imputation of these missing data. A missing value was replaced by the worst value observed within the particular patient group when a patient had attempted to perform a test but was unable to do it. In other cases, the missing value was replaced by the mean group score at follow-up. p Values .05 or less were considered significant, unless otherwise indicated.
RESULTS
NDPD patients without follow-up were older, had later disease onset, and performed slower on Stroop Test word reading condition at baseline than those who returned to the second evaluation (all p values < .05). Regarding the EPD group, patients without follow-up were older, had later onset of disease, had greater degree of axial impairment, received higher LED, and performed worse on TMT-B at baseline than those who participated in the second evaluation (all p values < .05).
Test–Retest Reliability and Cognitive Change in Control Group
The test–retest reliability coefficients in the control group for the 27 measures examined ranged from .34 to .89, with a median of .68. For most of the tests, the levels of stability over time were adequate given the long follow-up interval. The proportion of variance explained by baseline test scores and demographic variables in predicting expected retest scores ranged between .15 and .80. Using the standard cutoff criterion of z = ±1.645 [corresponding to a score outside the 90% confidence interval (CI), α = .10, two-tailed], all tests were found to fit the expected distribution (i.e., 5% classified as improved and 5% as deteriorated), except BNT and MWCST number of perseverative errors, which were associated with an increased risk of misclassification (χ2 goodness of fit, p < .001).
Cognitive Change in NDPD Group
Magnitude of cognitive change
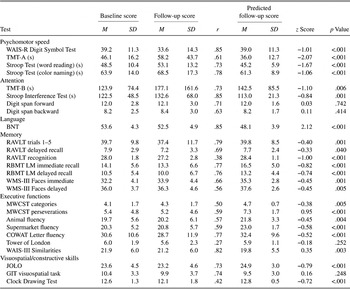
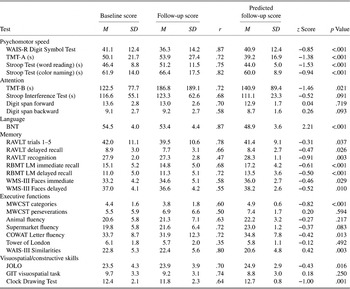
Table 2 summarizes baseline and follow-up scores, predicted retest scores, and standardized z scores for NDPD patients. For 20 of the 27 measures, observed retest scores were significantly lower than predicted scores, suggesting a greater decrease in performance over time than in healthy controls. Tests that tap short-term and working memory (digit span forward and backward), planning (TOL), and spatial reasoning (GIT visuospatial task) showed no decline. Follow-up performance on BNT and MWCST perseverative errors exceeded predicted retest scores, but these findings are questionable given the poor classification accuracy of these measures in the control group.
Observed baseline and follow-up test scores, test–retest reliability (Pearson r), predicted follow-up scores, standardized z scores, and p values for observed versus predicted follow-up scores (paired t test) in NDPD patients (n = 89)

Notes
WMS-III, Wechsler Memory Scale-III. z Score = [observed follow-up score − predicted follow-up score]/SE of the estimate from regression analysis. Negative z scores indicate lower than expected retest score. No corrections were made for multiple comparisons.
As indicated by z scores, tests of psychomotor speed and attention (TMT-B) showed the greatest degree of decline. Within the memory domain, decline in performance was more prominent on measures of verbal recognition memory, immediate and delayed story recall, than on word list learning or visual memory. Tests of executive function showed small but significant rates of decline. Observed retest scores for the WAIS-III Similarities test were better than predicted. Within the visuospatial domain, tests of spatial orientation (JOLO) and constructive skills (Clock Drawing) showed modest declines.
Frequency of cognitive deficits at baseline and 3-year follow-up
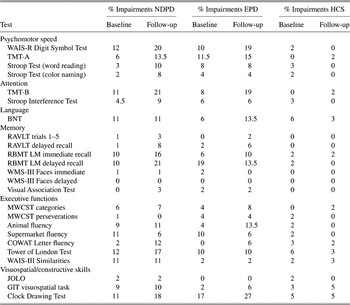
Comparison with normative data revealed that impairments in the NDPD group at baseline were most frequent on Digit Symbol Test (12%), TOL (12%), TMT-B (11%), Clock Drawing Test (10%), and RBMT LM (10%). After 3 years, these deficits became even more prevalent and there was an additional increase in the frequency of impairments on measures of psychomotor speed, selective attentional (Stroop interference) and executive skills (COWAT), and memory (RAVLT delayed recall). Whereas impairments on BNT, WAIS-III Similarities, and supermarket fluency were fairly frequent at baseline, they remained unchanged or slightly decreased at follow-up assessment. The frequency of impairment on the remaining tasks remained stable or changed only slightly. In contrast to NDPD patients, the prevalence of cognitive deficits in the control group was low at baseline, and it remained fairly stable during the follow-up interval (Table 3).
Frequency of cognitive impairments at baseline and 3-year follow-up in NDPD patients, EPD patients, and HCS

Notes
WMS-III, Wechsler Memory Scale-III; HCS, healthy control subjects. Impairment was defined as a score below 2 SDs of age and (if possible education) norms. No corrections were made for multiple comparisons.
Cognitive change at the individual level
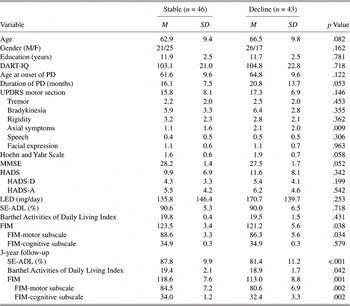
Multivariate comparisons revealed that 43 out of 89 NDPD patients (48%) exhibited decline in cognitive performance during follow-up to a degree that exceeded the 5th percentile in controls. Patients exhibiting cognitive decline were compared with cognitively stable patients with respect to baseline demographic and clinical variables (Table 4). Differences in the UPDRS motor section and the Hoehn and Yahr Scale between patients with cognitive decline and cognitively stable patients in the univariate analyses were probably due to axial impairment because other motor symptoms at baseline were comparable across the two patient groups. Therefore, the UPDRS and Hoehn and Yahr scores were not included in the multivariate regression analysis. Furthermore, age was not included in the analysis because of its strong correlation with age at PD onset. For hierarchical regression analysis, age at onset and disease duration were entered as independent variables in the first step. In the second step, axial impairment at baseline was added to the model. The results showed that adding age at onset and disease duration as predictors in the first step of the analysis significantly improved the model (likelihood ratio test: p = .021). The regression model appeared to adequately fit the data (Hosmer–Lemeshow Test: χ2 = 11.13; p = .19). Disease duration was an independent predictor of cognitive change at follow-up [odds ratio (OR) = 1.96, 95% CI: 1.02–3.74; p = .043]. Adding axial impairment at baseline as a predictor did not improve the regression model. In the final step, with all candidate predictors included in the equation, none of the independent variables turned out to be significantly associated with cognitive decline. Multicollinearity between predictors was not present (.11 < r < .39).
Baseline demographic and clinical characteristics of NDPD patients with stable cognitive performance and cognitive decline after 3 years

Notes
DART, Dutch Adult Reading Test; HADS-D, Depression subscale; HADS-A, Anxiety subscale. No corrections were made for multiple comparisons.
Dementia at follow-up
Multivariate normative comparison using composite domain scores revealed that 16 NDPD patients (18%) showed decline in two or more cognitive areas. Four of them (4.5% of NDPD patients) exhibited significant decline in at least two cognitive domains other than psychomotor speed and had evidence of functional disability at follow-up, defined as a score of ≤4 on at least one item on the FIM-cognitive subscale. Review of medical records revealed that out of the 122 patients from the original sample who participated in annual clinical examination over a 3-year period, an additional 5 patients (4%) were diagnosed as demented by their consultant neurologist between the last two study visits. Thus, in all, 8.5% of NDPD patients developed dementia during follow-up.
Cognitive Change in EPD Group
Comparison with either control subjects (Table 5) or normative data (Table 3) revealed deteriorating performance in the EPD group over the follow-up interval across several cognitive domains, particularly on measures of attention, psychomotor speed, and constructive skills. Analysis of cognitive change at the individual level showed that 26 out of the 52 patients (50%) displayed cognitive decline exceeding 5th percentile in controls. Following the same procedure as in the NDPD group, univariate analyses were conducted to select candidate predictors of cognitive decline. Patients with EPD who showed decline in cognitive function over the 3-year follow-up interval were older and more often male and had later onset of disease, lower scores on a global measure of cognitive status, greater overall severity of motor disorder, and greater degree of axial impairment and bradykinesia at baseline assessment than those with stable cognitive performance. There were no differences between the groups with respect to education, premorbid intelligence, duration of PD, the prevalence of affective symptoms, severity of tremor, rigidity, speech impediments and facial mobility, or LED. Subsequently, the hierarchical logistic regression was performed, with age at onset and sex entered first in the model, followed by baseline axial symptoms and bradykinesia. Likelihood ratio tests showed that the model significantly improved at each step of the analysis (step 1: p = .001; step 2: p = .003). At the final step, with all independent variables entered in the equation, age at disease onset (OR = 1.20, 95% CI: 1.02–1.40; p = .025) and axial symptoms at baseline (OR = 1.79, 95% CI: 1.05–3.05; p = .032) were found to be significant predictors of cognitive decline in the EPD group. The regression model adequately fitted the data (Hosmer–Lemeshow Test: χ2 = 8.52; p = .38).
Observed baseline and follow-up test scores, test–retest reliability (Pearson r), predicted follow-up scores, standardized z scores, and p values for observed versus predicted follow-up scores (paired t test) in EPD patients (n = 52)

Notes
WMS-III, Wechsler Memory Scale-III. z Score = [observed follow-up score − predicted follow-up score]/SE of the estimate from regression analysis. Negative z scores indicate lower than expected retest score. No corrections were made for multiple comparisons.
Two patients (4%) showed decline in two or more cognitive areas when using composite domain scores along with evidence of functional disability. Out of the 67 patients who participated in the 3-year clinical assessment, two additional patients (3%) were diagnosed as demented by their consultant neurologist. Thus, in all, 7% of EPD patients developed dementia during follow-up.
DISCUSSION
This study examined the evolution and predictors of cognitive impairment over 3 years in patients with PD. In an attempt to overcome methodological limitations of previous research in this area, our approach included a prospective follow-up of a well-defined inception cohort of patients from the time of diagnosis in addition to established cases, comprehensive neuropsychological assessment, demographically matched control group, and analytic methods that control for sources of error in test–retest designs and allow evaluation of change in individual patients.
We found a significant decrease in performance on most cognitive measures in NDPD patients (Table 2). The most severe decline occurred on measures of psychomotor speed and attention. In the domains of memory, visuospatial skills, and executive function, deterioration was smaller in magnitude but still significantly greater than in controls. Comparison with normative data revealed already at baseline a higher prevalence of impairments across several cognitive measures in patients than in controls. Three years later, the frequency of deficits in PD patients further increased on tests of psychomotor speed, attention, constructive skills, verbal memory, and selective executive abilities (Table 3). Analysis of cognitive change at an individual level revealed that nearly half of the patients exhibited cognitive decline. This decline appeared to occur in a diffuse manner, but deterioration in psychomotor speed and attention seemed to be the most prominent.
An important methodological issue concerns the extent to which cognitive changes observed in our patient sample are affected by motor impairment. In this respect, it is important to note that the measures that showed the greatest change involve a timed component and motor skills. However, correlation analyses using regression-based z scores and UPDRS change scores between baseline and follow-up assessment as variables showed that within the NDPD group, an increase in motor impairment was significantly related only with the rate of decline on the Digit Symbol Test (r = −.23) (data not shown). Among patients with EPD, an increase in motor impairment was found to be significantly related only with changes in performance on RBMT LM immediate recall (r = −.30) and GIT visuospatial task (r = −.31), which are both nonmotor tasks (data not shown). Thus, it is seems unlikely that the cognitive changes observed in our patient sample can be accounted for in terms of motor impairment alone.
The present finding of a diffuse decline across multiple cognitive abilities is consistent with some previous (uncontrolled) studies that prospectively assessed PD patients over longer time intervals with an extensive neuropsychological test battery (Caparros-Lefebvre et al., Reference Caparros-Lefebvre, Pecheux, Petit, Duhamel and Petit1995; Palazzini et al., Reference Palazzini, Soliveri, Filippini, Fetoni, Zappacosta, Scigliano, Monza, Caraceni and Girotti1995). In a recent meta-analysis of 25 longitudinal studies, we found small but significant declines in global cognitive ability, memory, and visuoconstructive skills among initially nondemented PD patients during a mean follow-up interval of 2.5 years (Muslimovic et al., Reference Muslimovic, Schmand, Speelman and de Haan2007). Although methodological differences preclude direct comparisons, the present results confirm and extend these previous observations by demonstrating decline in performance on measures of memory, constructive skills, and executive function 3 years after diagnosis. The present results concerning domains of psychomotor speed and attention differ from our review of the literature, which indicated a rather stable pattern of performance over time in these two domains. This discrepancy may in part be due to different methods of assessment. Of the seven studies included in the meta-analysis that assessed psychomotor speed and attention, only two used the Digit Symbol Test and three employed TMT. On the other hand, the most frequently used measure was Digit Span Test. Notably, digit span forward and backward were the only two attentional measures that did not reveal change in our current patient sample. In view of our findings that the Digit Symbol Test, TMT, and Stroop Test are highly sensitive to longitudinal change, it is possible that our meta-analysis would have produced different results if more studies had employed these tests. Another important finding is that traditional measures of executive function, such as the Wisconsin Card Sorting Test, word fluency, and Tower of London, were found to exhibit a relatively smaller degree of decline in our NDPD patients than some tests of verbal memory and visuospatial abilities. The comparatively lower level of change on tests of executive function is in contrast to the observations from cross-sectional comparisons of patients at different stages of disease (Owen et al., Reference Owen, James, Leigh, Summers, Marsden, Quinn, Lange and Robbins1992). Thus, the present longitudinal findings, in keeping with our recent review of the literature, suggest that executive function may not be the earliest or primary cognitive domain to show decline in PD.
We found that 9% of patients developed dementia 3 years after diagnosis. However, there are several issues that need to be considered when interpreting this finding. First, diagnostic criteria for dementia applied in this study (i.e., Movement Disorders Society Task Force) (Emre et al., Reference Emre, Aarsland, Brown, Burn, Duyckaerts, Mizuno, Broe, Cummings, Dickson, Gauthier, Goldman, Goetz, Korczyn, Lees, Levy, Litvan, McKeith, Olanow, Poewe, Quinn, Sampaio, Tolosa and Dubois2007) require functional impairment resulting from cognitive dysfunction. We attempted to minimize the influence of motor impairment by investigating the functional status with the FIM-cognitive subscale, which contains questions about activities that are unlikely to be affected by motor symptoms (e.g., comprehension, social interaction, problem solving, and forgetfulness). This information was acquired by asking patients to indicate the extent to which they perform these activities independently. However, this method of assessment relying on self-report may have led to underestimation of the frequency of dementia due to possibly reduced insight into daily functioning, considering the fact that almost a half of our patients showed evidence of cognitive decline. In this respect, it is important to note that even when cognitive decline rather than dementia was used as outcome measure, it still appeared to be functionally relevant. This is reflected by our finding that patients with adverse cognitive outcome attained significantly lower scores on each of the functional scales relative to cognitively stable patients at follow-up (Table 4). The relation between the cognitive decline and the FIM-cognitive subscale remained significant even after the effects of motor impairment had been taken into account.
Another issue that might have influenced our findings is the presence of selection bias due to the loss to follow-up. Of the nine patients who developed dementia within 3 years after diagnosis, four participated in the follow-up, whereas the remaining five patients were diagnosed as demented by their neurologist. Given the high sensitivity of neuropsychological tests to detect cognitive changes, it is likely that patients with milder forms of dementia were missed in the group that was lost to follow-up. Thus, the frequency of dementia probably would have been somewhat higher if these patients had been included, because they were older at baseline, and were therefore at greater risk of developing dementia (Emre et al., Reference Emre, Aarsland, Brown, Burn, Duyckaerts, Mizuno, Broe, Cummings, Dickson, Gauthier, Goldman, Goetz, Korczyn, Lees, Levy, Litvan, McKeith, Olanow, Poewe, Quinn, Sampaio, Tolosa and Dubois2007).
Despite these potentially confounding factors, the proportion of patients with dementia in this study is similar to that in a recent report, in which 10% of 126 PD patients from a community sample developed dementia 3.5 years after diagnosis (Williams-Gray et al., Reference Williams-Gray, Foltynie, Brayne, Robbins and Barker2007). However, a direct comparison of these findings is difficult because in this earlier study, the presence of cognitive impairment was inferred from the MMSE and functional disability was quantified with the SE-ADL Scale. Nonetheless, this highlights the need for a uniform operational definition of dementia in PD in future studies if progress is to be made in our understanding of this important concomitant of the disease.
The trajectory of decline in patients with more advanced PD appeared to be similar to that observed among our newly diagnosed patients. However, there are two important methodological problems that are likely to have affected this finding. First, our established sample appears to have been biased already at inclusion in the study toward relatively better functioning patients with slower disease progression. Patients who agreed to participate at baseline were younger than those who refused to take part in the study. This selection bias is a likely explanation for a relatively stable course of motor impairment in our established sample, which is in contrast to progression of motor symptoms seen among newly diagnosed patients (see UPDRS motor section and Hoehn and Yahr Scale in Table 1). Second, selection bias during the follow-up interval might have influenced our findings in this sample. Patients who were lost to neuropsychological follow-up (n = 12) were older and had later disease onset, more severe axial symptoms, and more deficits on TMT-B at baseline than those who were retested. In view of our finding that older age at disease onset and greater severity of axial symptoms were significantly associated with cognitive decline, it is likely that the current results underestimate the true extent of cognitive deterioration and dementia. It should be noted that chronological age was not included in the regression model due to its strong correlation with age at onset of PD. Therefore, chronological age may also be a potential predictor of cognitive decline in this group. Given the selection bias in our established sample, firm conclusions about the effect of disease duration longer than 3 years on cognitive course in PD cannot be drawn.
A final finding of this study is that none of the baseline demographic and clinical features appeared to be associated with cognitive change in the first few years following the PD diagnosis. In the EPD group, age at disease onset and axial impairment at baseline are identified as the main predictors of cognitive decline at follow-up. This latter finding is consistent with previous longitudinal studies (Aarsland et al., Reference Aarsland, Andersen, Larsen, Perry, Wentzel-Larsen, Lolk and Kragh-Sørensen2004; Burn et al., Reference Burn, Rowan, Allan, Molloy, O’Brien and McKeith2006; Williams-Gray et al., Reference Williams-Gray, Foltynie, Brayne, Robbins and Barker2007) and adds further support to the notion that motor symptoms assumed to result from pathological changes in nondopaminergic brain systems (i.e., postural instability and gait difficulty) are likely to be of prognostic significance for cognitive course.
Some methodological limitations of this study should be recognized. First, 23% of newly diagnosed patients and 19% of established patients were lost during the follow-up interval, and this attrition rate was higher than that among control subjects (9%). Furthermore, some patients (6% in each group) had deceased. Because mortality is associated with dementia in PD (Levy et al., Reference Levy, Tang, Louis, Cote, Alfaro, Mejia, Stern and Marder2002), the attrition due to death in our samples may not be random, and this could have influenced our results. Second, the majority of our patients formed a clinic-based sample, and the degree to which the present findings can be generalized to the PD population at large remains to be determined. However, our inception cohort was composed by inviting every newly diagnosed patient referred to outpatient clinics, and therefore, they are likely to represent the kind of patients most specialists deal with in their practices. Third, a follow-up interval of 3 years is modest in duration, recognizing that PD tends to progress rather slowly over several years. Fourth, the available norms for several tests used in this study only permit a correction for age but not for level of education. This might have distorted somewhat the frequency of cognitive deficits in our sample. Finally, the classification of tests into cognitive domains is arbitrary to some degree. For example, many tests (Stroop Test, TMT-A, and TMT-B) that purport to assess different aspects of attention are also used as measures of executive function.
In conclusion, the present longitudinal evaluation of neuropsychological performance indicates a progressive course of cognitive impairment in PD beyond cognitive changes associated with normal aging. Cognitive decline in PD is evident across several cognitive domains but appears to be particularly prominent for psychomotor speed and attention. Axial impairment (i.e., postural instability and gait difficulty) and age at disease onset are major predictors of cognitive decline in later stages of PD. This information about the cognitive prognosis in PD may be relevant for patients and their families and could help to identify patients requiring closer attention and monitoring. In addition, these results may be useful for future trials evaluating disease-modifying drugs. Overall, our study highlights the advantage of prospectively investigating patients from an early point in the course of disease and illustrates the methodological difficulties in studying established cases.
Acknowledgments
This work was funded by the Prinses Beatrix Fonds (Grant PGO 01-0138 to B.S.). B.P., J.D.S., and R.J. de H. are members of the Co-morbidity and Ageing in Rehabilitation Patients; the influence on Activities (CARPA) study group. The CARPA study group is supported by a grant from ZonMw, The Hague, The Netherlands. The information in this manuscript and the manuscript itself have never been published either electronically or in print. There are no financial or other relationships that may create a conflict of interest. We thank the patients for their willingness to participate in this research. We are grateful to the research nurses D. Standaar, M. Postma, L. Daeter, and A. Gorissen. We also thank the staff from neurology departments of Medical Centre Alkmaar, Meander Medical Centre, Amersfoort, Slotervaart Hospital, Lucas Andreas hospital, Onze Lieve Vrouw Gasthuis, and Academic Medical Centre in Amsterdam for patient recruitment and logistic support. We are grateful to the Dutch Parkinson’s Disease Association.