INTRODUCTION
Approaches to the study of marine biodiversity include identification of spatial patterns through surveying and mapping, description of patterns and their relationships with ecosystem function and production (Costello, Reference Costello1998; Desroy et al., Reference Desroy, Warembourg, Dewarumez and Dauvin2002). Well-informed decisions can be taken if information about the resource and changes over time is available. This descriptive information remains an important tool, as underlined by the Rio Convention on Biological Diversity, in the process of identifying areas of conservational importance (Costello, Reference Costello1998; Desroy et al., Reference Desroy, Warembourg, Dewarumez and Dauvin2002).
Information on the habitat characteristics associated with a species is important because it is central to the understanding of their distribution and abundance (Spivak et al., Reference Spivak, Anger, Bas, Luppi and Ismael1994; Speich & Wahl, Reference Speich, Wahl, Ralph, Hunt, Raphael and Piatt1995; Mezquita et al., Reference Mezquita, Sanz-Brau and Wansard2000). In addition to seasonal variation, there may be spatial variation in the benthic fauna. Spatial variability often is related to changes in substrate, but may be influenced by other factors including depth, temperature, salinity, physical disturbance and competition (Thrush, Reference Thrush1991; Snelgrove, Reference Snelgrove1998). Most obvious is the tendency for hard substrates to support encrusting or sedentary organisms while soft substrates allow organisms to live within the sediment (Woodin & Jackson, Reference Woodin and Jackson1979).
The benthic infaunal communities are organized structurally, numerically and functionally in relation to gradients of resource availability with other environmental factors (Pearson & Rosenberg, Reference Pearson and Rosenberg1978; Wieking & Kröncke, Reference Wieking and Kröncke2005). The distribution patterns of soft bottom benthic macrofauna are driven by a complex interplay of biological and abiotic phenomena. In addition, they are characterized by an elevated spatial and temporal variability at different scales (Gray & Elliot, Reference Gray and Elliot2009). Depth-related patterns (e.g. depth-size relationships) are an important topic in the study of marine biology, especially concerning deep-sea fauna both at species and community levels. The existence of boundaries of greater faunal renewal at certain depths between depth bands of high faunal homogeneity (zonation) has been proposed in many deep-sea studies from small macrobenthic invertebrates (e.g. gastropods – Rex, Reference Rex1976; polychaetes or cumaceans – Grassle et al., Reference Grassle, Sanders and Smith1979) to megabenthic fishes (Day & Pearcy, Reference Day and Pearcy1968; Haedrich et al., Reference Haedrich, Rowe and Polloni1975, Reference Haedrich, Rowe and Polloni1980; Stefanescu et al., Reference Stefanescu, Lloris and Rucabado1993).
The present study was done to create the benchmark data on macrobenthic distribution from the estuary up to the continental slope region of the south-east coast of India. Such data have value in this region as the fishery resources are rich and benthic fish productivity can be deduced through modelling for sustainable exploitation through management. With this objective the present study was undertaken:
-
1. To collect data on macrobenthic assemblages in different benthic zones such as estuary (Vellar), inshore (up to 25 m), continental shelf (up to 200 m) and continental slope (up to 1000 m) in the south-east coast of India.
-
2. To analyse the relationship between macrobenthos and the environmental parameters in the study area and
-
3. To characterize the feeding guild composition of polychaetes along the depth gradient.
MATERIALS AND METHODS
Study area
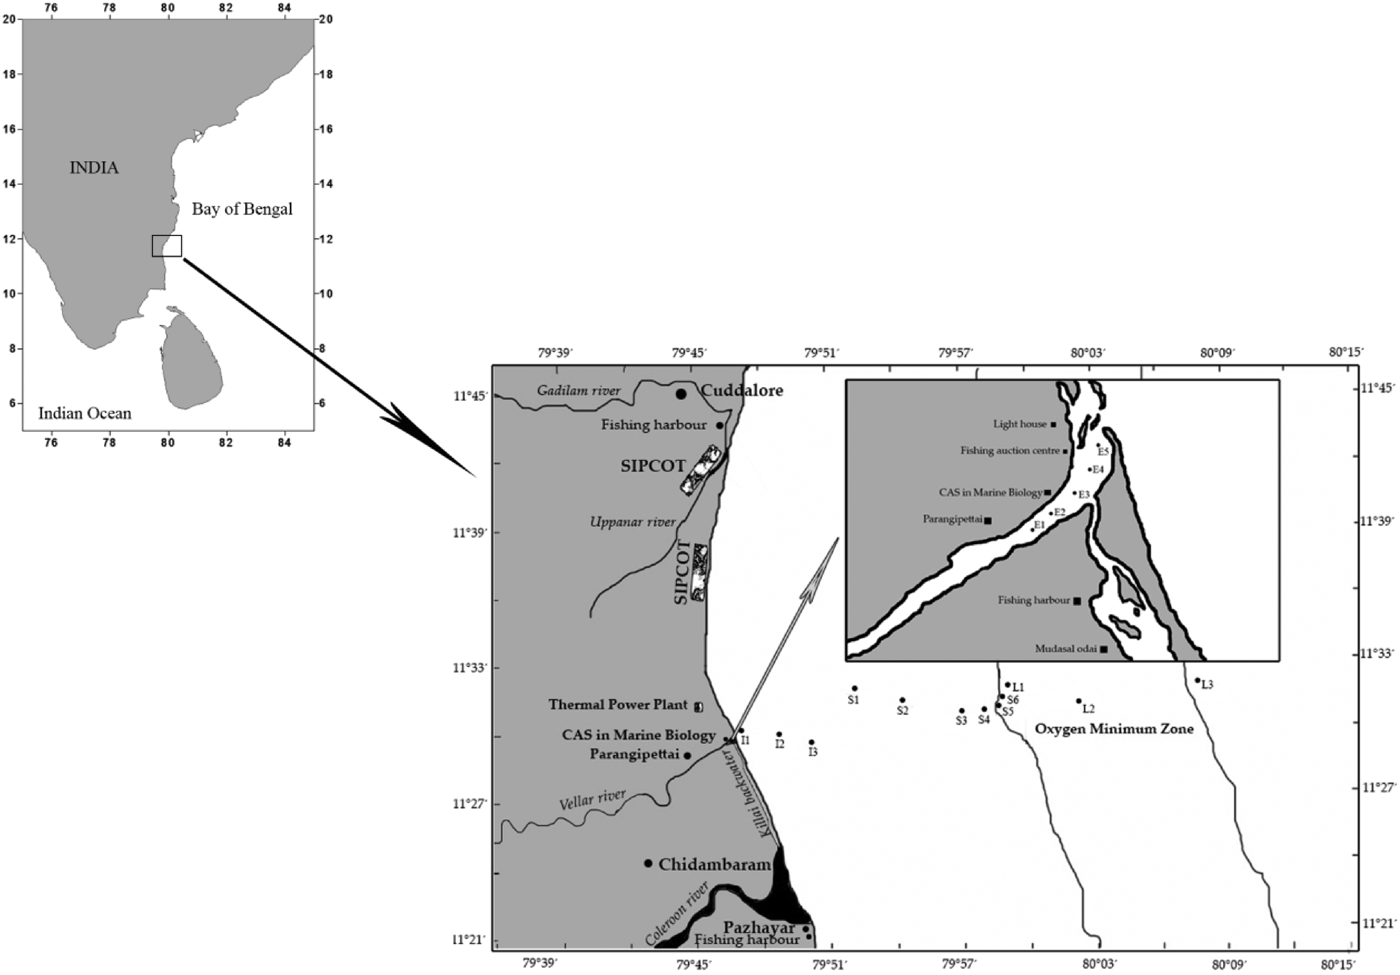
In the study area (Figure 1) minor rivers such as Adappar, Gadillam, Uppanar, Vellar and Coleroon empty their contents. There are two fishing harbours on the northern and southern sides of the transect.
Stations (depths) sampled in the south-east coast of India. E1, E2, E3, E4 & E5 – estuary; I5, I15 & I25 – near shore; S1 (30–50 m), S2 (51–75 m), S3 (76–100 m), S4 (101–150 m) and S5 (151–175 m), S6 (176–200 m) – continental shelf; L1 (201–400 m), L2 (401–800 m) and L3 (>800 m) – continental slope.

Environmental parameters
Information on physico-chemical characteristics of the estuarine and inshore bottom water was collected using centigrade thermometer (temperature), refractometer (salinity) and pH meter (pH). In the continental shelf and slope areas, bottom seawater temperature, salinity and depth were measured with the help of CTD (Conductivity Temperature Depth) (Sea-Bird) facility (SBE 11 deck unit and SBE 9 underwater) available in FORV Sagar Sampada. It consists of a deck unit (for real-time readout) and an underwater unit. Water samples were collected by CTD rosette niskin bottles fired from the onboard unit for calculating dissolved oxygen by Winkler's method following Strickland & Parsons (Reference Strickland and Parsons1972).
Sediment granulometry in the study area was done by the Pipette method as proposed by Krumbein & Pettijohn (Reference Krumbein and Pettijohn1938). Total Organic Carbon content (TOC) was estimated using the chromic acid oxidation method followed by titration with ammonium ferrous sulphate (Walkley–Black method) as modified by Gaudette et al. (Reference Gaudette, Wilson, Toner and David1974).
Field sampling: habitat distribution of benthic macrofauna
The benthic samples were collected from the estuary (2007 –post-monsoon, summer, pre-monsoon and monsoon) and inshore area (2007: 5–25 m depth – post-monsoon, summer, pre-monsoon and monsoon) using boats. From the continental shelf (cruises no. 260–2008, 275–2010 and 290–2011: 30–200 m depth) and continental slope area (cruise no. 225–2004, 236–2005 and 245–2006: 200–1000 m depth) samples were collected on board FORV ‘Sagar Sampada’.
For analysing benthic fauna of the estuary samples were collected from Rhizophora zone – E1 (1.7 m), Avicennia zone –E2 (2.1 m), from a non-mangrove area opposite to Marine Biological station –E3 (2.4 m), seagrass bed – E4 (2.7 m) and mouth –E5 (3.3 m). Samples were collected during high tide using a long-armed Peterson grab, which covered an area of 0.0251 m2. From each station triplicate samples were collected. In the inshore waters, samples were collected at 5, 15 and 25 m depths. Van Veen grab (0.1 m2) was used for unit sampling. At least two grab hauls were made at each site. Grab hauls were obtained according to standard protocols of Holme & McIntyre (Reference Holme and McIntyre1984). From the shelf and slope areas, sediment samples were collected using Smith–McIntyre grab which covered an area of 0.2 m2 at depth ranges of 30–50 m, 51–75 m, 76–100 m, 101–150 m, 151–175 m, 176–200 m, 201–400 m, 401–800 m and >800 m. Duplicate samples were collected from each depth. A total of 58 samples (estuary − 4 seasons × 5 stations = 20; inshore – 3 stations × 4 seasons = 12; continental shelf − 2 cruises × 6 stations & 1 cruise × 5 stations = 17 and continental slope = 3 cruises × 3 stations = 9) were collected from (estuary to slope) the study area. For the sake of convenience in analysis and presentation of data, the estuarine and inshore samples were converted into 0.2 m2 and the mean value of the samples was taken for each station.
Processing of the samples
After taking out a small quantity of sediment (300 g) for textural analysis and to estimate total organic matter, the rest was transferred into a plastic barrel, gently washed with copious (running) seawater and the material allowed to pass through a sieve of 0.5 mm mesh size. Sieving was carried out onboard over a wooden platform designed for the purpose. After sieving, the organisms were carefully separated and together with residual sediment, if any, the samples were fixed in 5–7% (neutral) formaldehyde, labelled and stored for further examination.
In the laboratory, the samples were washed with fresh water using 0.5 mm screen allowing dissolved sediment to pass through. Prior to extraction, selective staining of the fauna was done for recognition and sorting of specimens. For this, the samples were bulk-stained with Rose Bengal (Pfannkuche & Thiel, Reference Pfannkuche, Thiel, Higgins and Thiel1988). Stained macrobenthos was sorted within 1–2 h, since over-staining would make it difficult to remove and would impair the structural examination under the microscope. All macrobenthic forms were picked up using forceps (and brushes) and the material later sorted using a 40× stereoscopic microscope. The specimens were then preserved in methylated spirit for taxonomic identification.
For qualitative enumeration, each sample was examined under a binocular stereomicroscope (Olympus, 40×, Japan). The organisms were separated into different taxonomic groups for further identification. All taxa were identified to their species, generic or other higher levels to the extent possible with the help of standard taxonomic references (Polychaeta: Fauvel, Reference Fauvel1953; Day, Reference Day1967; Decapoda: FAO Identification Sheets, 1984; Alcock, Reference Alcock1985; Mollusca: Abott & Dance, Reference Abott and Dance1982; Rao, Reference Rao2003; Pisces: Smith & Heemstra, Reference Smith and Heemstra1986; http://www.marinespecies.org/; https://inpn.mnhn.fr/accueil/index; http://species-identification.org/index.php).
Polychaetes feeding guild assignments
According to Fauchald & Jumars (Reference Fauchald and Jumars1979), a feeding guild is a set of organisms that exploit food resources through a similar intake mechanism, independently of their phylogenetic relationships. Feeding guilds of a benthic community are divided initially into macrophagous and microphagous modes. Although macrophagous is subdivided into two sub-modes (herbivores and carnivores), the microphagous is subdivided into three sub-modes (filter feeders, deposit feeders and omnivorous). The above conceptual framework of feeding guild composition was suggested for ecological studies and environmental assessment. The validity of the above framework was tested by Pagliosa (Reference Pagliosa2005). In this study following Fauchald & Jumars (Reference Fauchald and Jumars1979), the feeding guilds were classified as carnivores, surface deposit feeders, subsurface deposit feeders, filter feeders and omnivores.
Statistical analysis
The diversity indices were calculated using the statistical package PERMANOVA+ for PRIMER. To link environmental variables with macrobenthos, the distance based linear model (DISTLM) was employed using the above package. The environmental parameters were log transformed and normalized before calculating the resemblance using Euclidean distance for matching these with the biota. To augment the sample size further bootstrapping(resampling) averages were calculated.
RESULTS
Environmental parameters
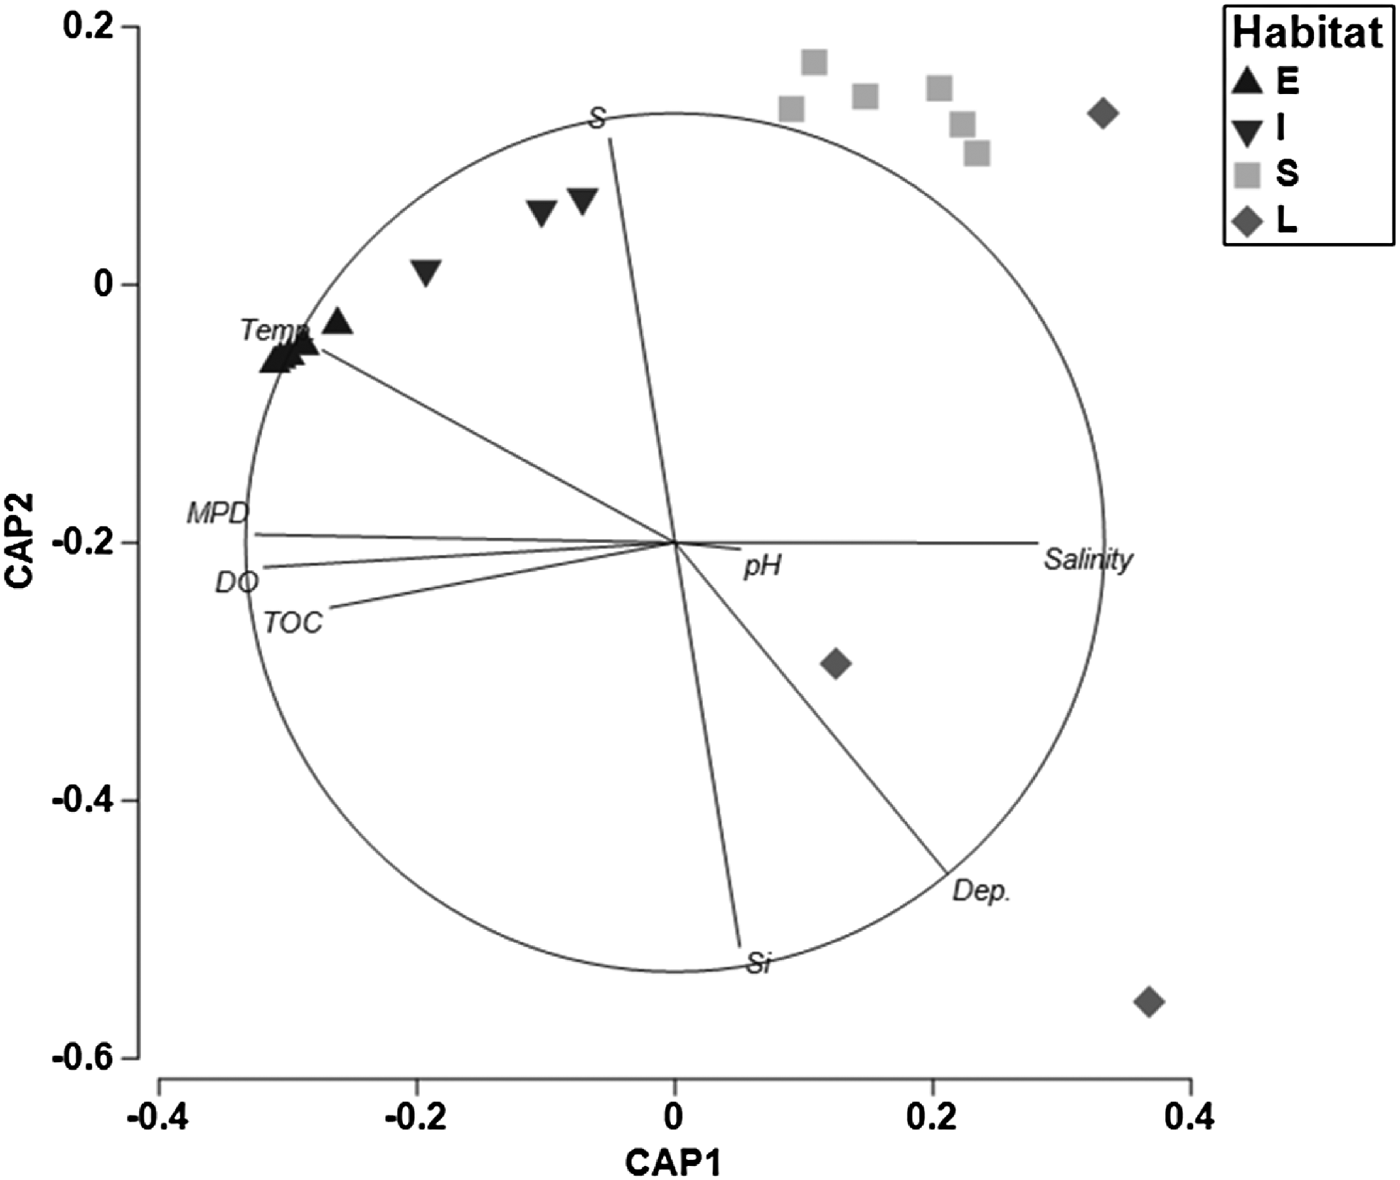
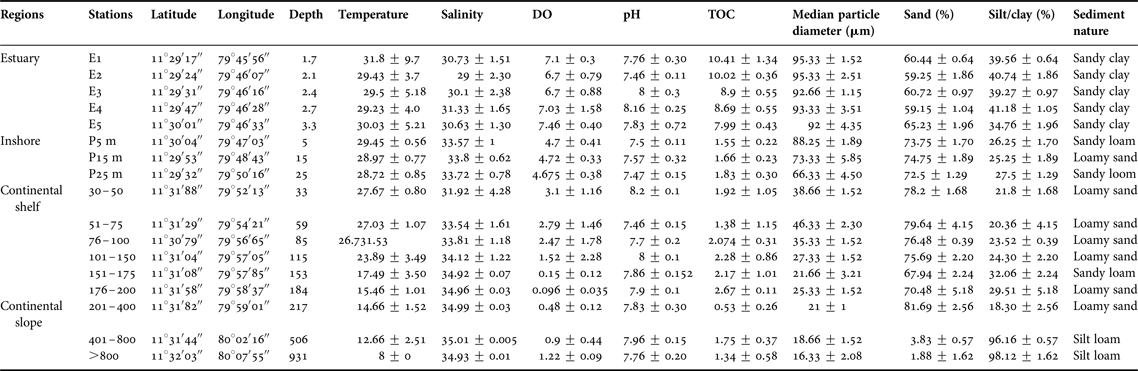
The temperature varied from 8 (>800 m) to 31.8 ± 9.7 °C (E1). The dissolved oxygen content ranged from 0.096 ± 0.035 mL L−1 (176–200 m) to 7.46 ± 0.40 mL L−1 (E5). Total organic matter content ranged between 0.53 ± 0.26 at 201–400 m and 10.41 ± 1.34 mg g−1 at E1. Salinity increased with depth from 29 ± 2.3 PSU (E2) to 35.01 ± 0.005 PSU (401–800 m). The pH was in the range of 7.46 ± 0.11 at E2–8.2 ± 0.1 at 30–50 m. The median particle diameter varied from 16.33 ± 2.08 (>800 m) to 95.33 ± 2.51 µm (E2) (Table 1). Generally the nature of sediment was sandy clay in the estuary, sandy loam inshore, medium sand at shelf and silt loam at slope regions. Although temperature, dissolved oxygen and total organic carbon generally decreased with an increase in depth, the other parameters increased. This trend was quite clear in the CAP plot drawn (Figure 2), where the vectors representing temperature, median particle diameter, dissolved oxygen, sand and total organic carbon point towards the shallower depths and those representing salinity, depth, silt/clay percentage and pH point towards the deeper region.
Vector overlay of environmental variables with the CAP axes of the south-east coast of India; DO – dissolved oxygen; TOC – total organic carbon; S – Sand; Si – silt/clay; MPD – Median Particle Diameter; Dep., Depth; region groups E, estuary; I, inshore; S, continental shelf; SL, continental slope.

Environmental parameters (latitude, longitude, depth, temperature, salinity, DO (dissolved oxygen), pH, TOC (total organic carbon), median particle diameter, sand, silt/clay and sediment nature) recorded at various regions in the study area (values are means ± standard deviation).

Composition of macrobenthos
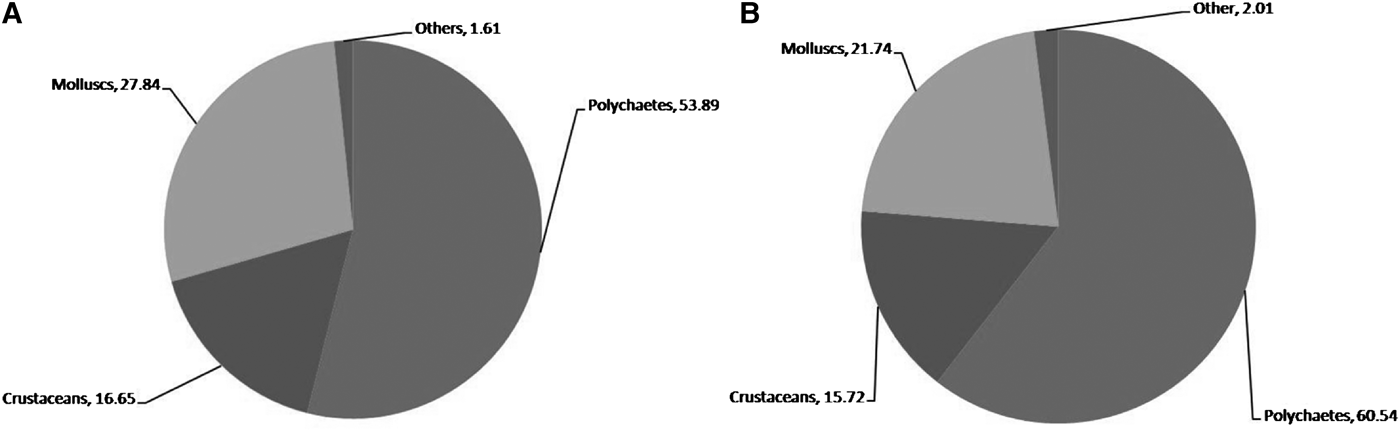
The mean number of organisms collected during each collection was 5951 organisms. The total number of species recorded in the study area was 300 belonging to four diverse taxa (Figure 3). These included polychaetes (53.89% in terms of abundance and 60.54% in terms of species), molluscs (27.84 and 21.74%), crustaceans (16.65 and 15.72%) and others including echinoderms and cnidarians (1.61 and 2.01%). The mean abundance of macrobenthos varied from 35 individuals/0.2 m2 (>800 m) to 816 individuals/0.2 m2 (E5). The number of species ranged between 45 species/0.2 m2 (25 m) and 17 species/0.2 m2 (401–800 m).
Percentage contribution of benthic organisms to total number of organisms collected (A) and total number of species recorded (B) of macrobenthos in the south-east coast of India.

Estuary
As many as 69 macrobenthic species were identified and polychaeta was the dominant group contributing 40.85–45.10% of the total faunal abundance. Of the 38 polychaete families identified in all the stations sampled, 30 were observed in the estuary. Among the polychaetes, family Opheliidae contributed more (9.39%) followed by Eunicidae (8.84%), Syllidae (7.18) and Sabellidae (7.18%). Overall five molluscan families were recorded in this region. The Veneridae contributed the highest at 44.53%. Crustaceans such as amphipods, decapods and tanaids were also recorded. Echinoderms and cnidarians were found in low numbers in this region. Species such as Tanaididae sp. Meretrix casta, Meretrix meretrix, Pirenella cingulata, Calanus sp., Tegillarca granosa, Umbonium vestiarium and Turritella sp. were found in higher numbers (Table 2).
Mean abundance (individuals/0.2 m2) of macrobenthic species in the study area.

Inshore
Overall 81 macrobenthic species belonging to three groups such as polychaetes, molluscs and crustaceans were recorded in this region. The majority of macrofaunal animals were polychaetes (56.66–63.23% of the total) represented by species belonging to 20 families. The polychaete families Eunicidae (21.46%) and Orbiniidae (12.29%) were found to be dominant in the inshore region. The contribution of Nassariidae was maximum (14.38%) followed by Turritellidae (11.30%) among the molluscs. The only crustacean taxa present in this region were Amphipods and Tanaids. The dominant species in this region were Onuphis sp., Goniada sp., Turritella duplicata, Hesione sp., Notomastus latericeus and Eunice australis (Table 2).
Shelf
Overall 167 species were recorded and polychaetes were found to be dominant in this region (shelf), and their contribution was in the range of 70.59–95.65% at various depths. Thirty-two polychaete families were observed, with Cirratulidae, Paraonidae and Spionidae being dominant (18.84, 16.64 and 10.99% respectively). The highest contribution of crustaceans was by Ampeliscidae, Corophiidae and Ampithoidae (22.22, 9.40 and 8.54%). Other groups such as Bivalvia, Echinodermata and Cnidaria were found in low numbers. In the continental shelf region species such as Cirratulus concinnus, Levinsenia gracilis, Isolda pulchella and Prionospio sp. were found to be abundant (Table 2).
Slope
Only 52 species were found with polychaetes being the dominant group, contributing 64.10–79.02%. Of the 18 polychaete families identified in this region, families Cirratulidae and Spionidae made the highest contribution (29.01% and 24.69%). In the second dominant group (crustaceans), Ampeliscidae, Ampithoidae and Diastylidae contributed more. Other groups such as bivalves, gastropods and echinoderms were also present. Species such as Tharyx sp. and Prionospio sp. were found more in this region (Table 2).
Diversity
Generally the number of species (39 ± 7.21 species/0.2 m2 in inshore – 26.66 ± 12.66 species/0.2 m2 in slope), abundance (665.6 ± 96.23individuals/0.2 m2 in estuary – 72.3 ± 61.23 individuals/0.2 m2 in slope) and Shannon diversity (Hlog2) (5.28 ± 0.86 in shelf – 4.49 ± 0.61 in slope), total taxonomic distinctness (4501.424 ± 1753.08 in shelf – 2810.66 ± 762.44 in slope) and phylogenetic diversity index (4296.813 ± 1770.55 in shelf – 2494.778 ± 865.76 in slope) decreased with increase in depth. The Margalef's index varied from 11.29 ± 4.61 (shelf) to 6.72 ± 0.46 (estuary) (Table 3). The evenness index ranged between 0.98 ± 0.002 (estuary) and 0.96 ± 0.03 (shelf) and the Simpson richness ranged from 0.97 ± 0.00 (estuary) to 0.98 ± 0.02 (shelf) (Table 3).
Diversity (mean ± standard deviation) of macrobenthos at different regions of the south-east coast of India.

d, Margalef's index; J’, evenness; H‘(log2), Shannon diversity; 1-Lambda’, Simpson richness; sDelta+, total taxonomic distinctness; sPhi+, phylogenetic diversity index.
Influence of habitat heterogeneity on macrobenthos
MULTIVARIATE ANALYSIS OF COMMUNITY STRUCTURE
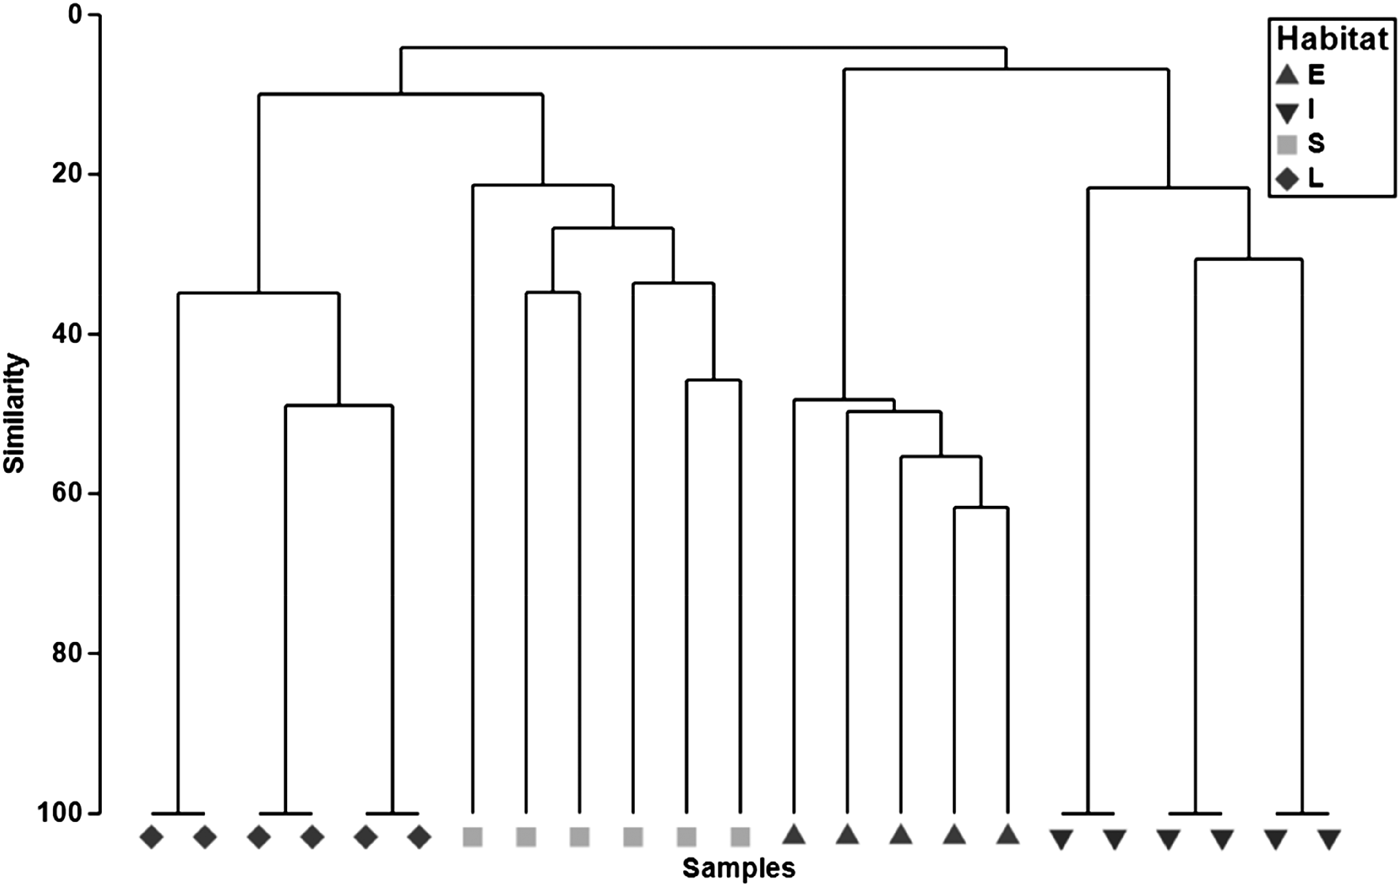
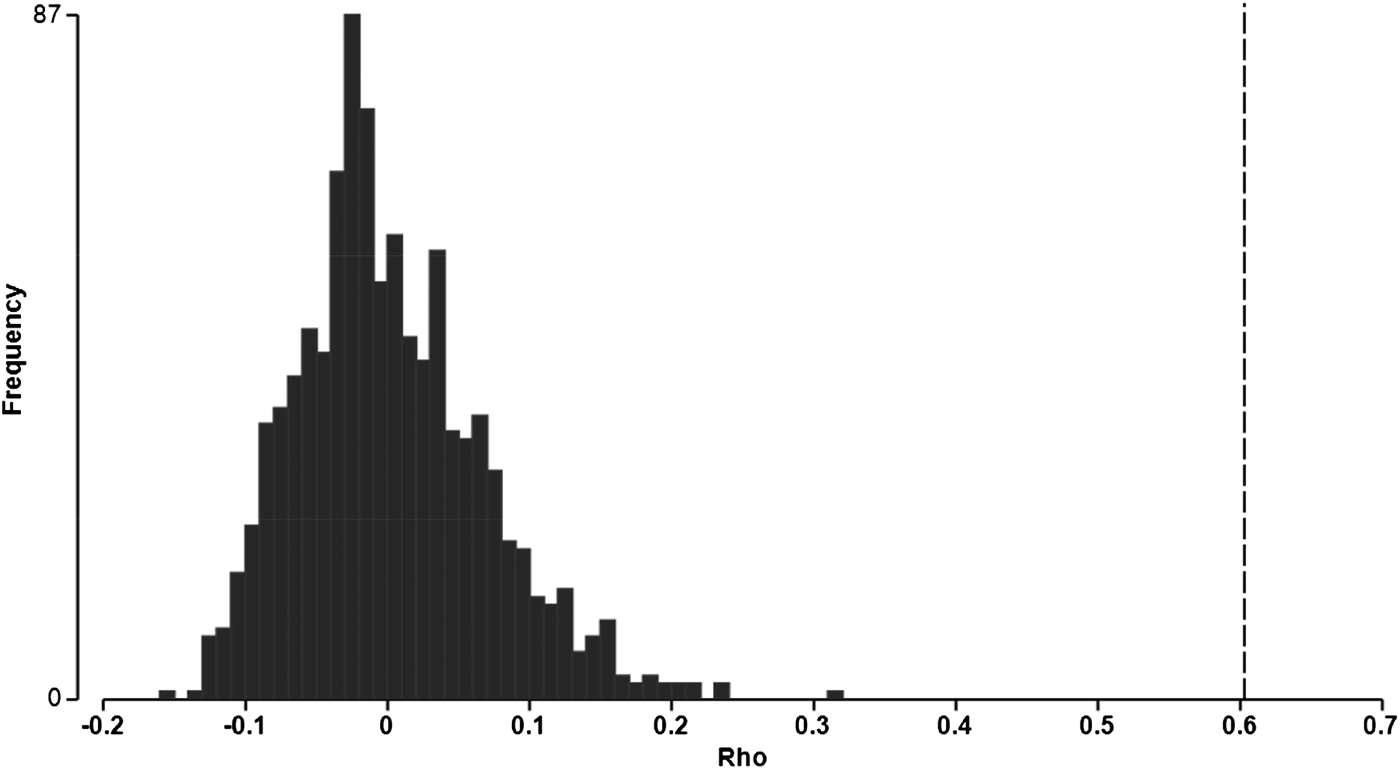
The similarity between the depths sampled ranged from 0.94% (inshore – 25 m depth and shelf 51–75 m) to 61.7% (E1 and E4). The dendrogram (tree diagram) derived showed four groups (one each in each region). The samples collected from each region were linked to the respective groups. That way four large groups were formed representing the four regions from where the samples were collected. These large groups ultimately were linked at very low similarity levels indicating distinct assemblages in each region (Figure 4). The statistical significance of serial changes in species composition (assemblage) was tested using RELATE. The Spearman rank correlation (Rho) value obtained was 0.608 having the sample statistic of 0.2% indicating significant serial changes in species composition from estuary to slope (Figure 5).
Dendrogram drawn for macrofauna collected from south-east coast of India using factor (E – estuary; I – inshore; S – continental shelf; L – continental slope).

Histogram showing significant serial changes in species composition of macrobenthos in the study area.

BOOTSTRAP AVERAGE
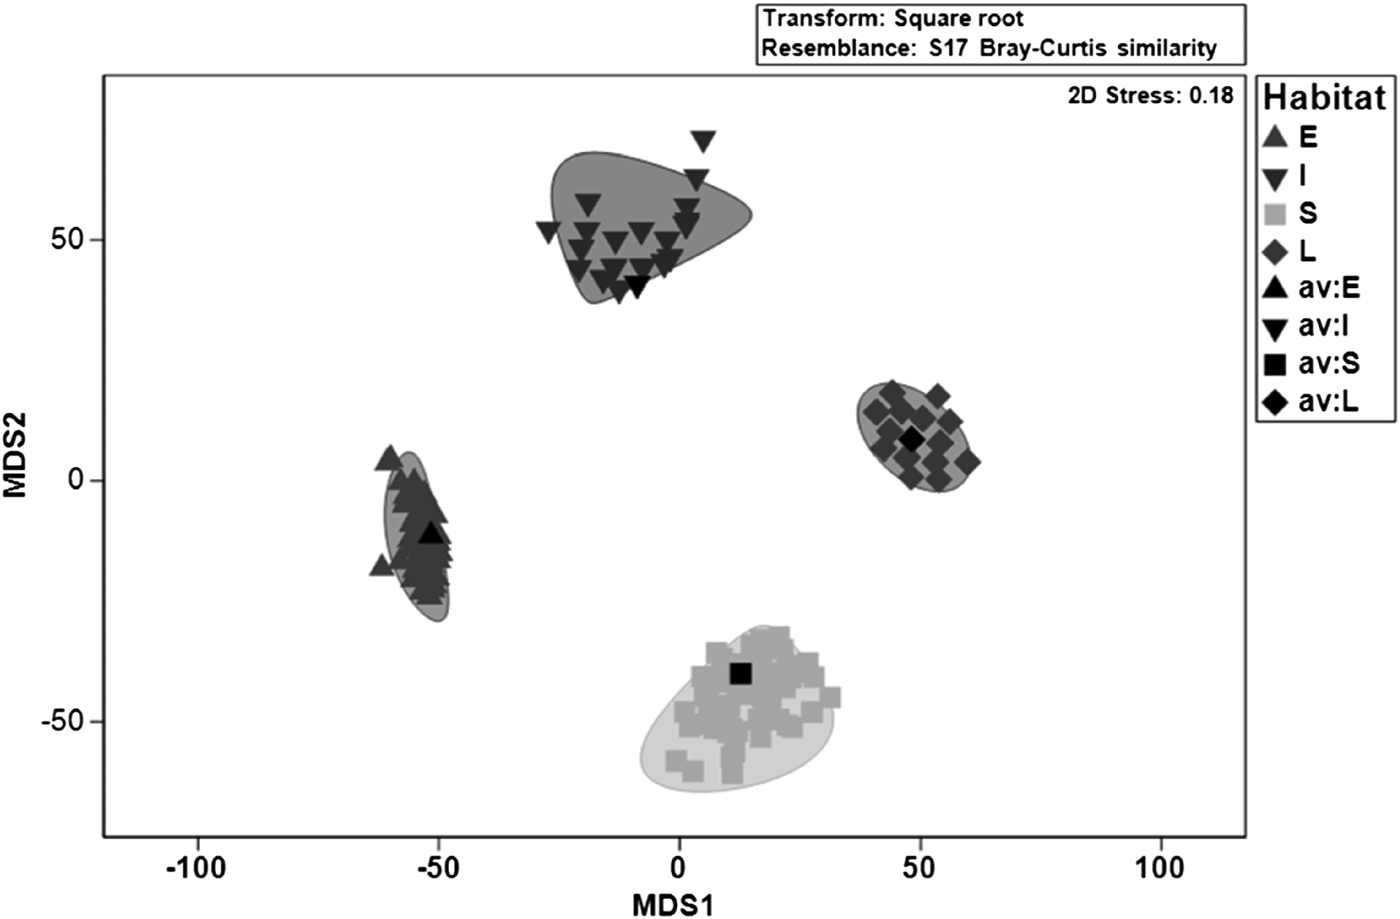
Cluster analysis does not reflect effectively the interrelationship between the regions. Therefore Bootstrap average was done to construct the smoothed nominal 95% bootstrap regions on the 2D plot. It is helpful in visualizing the differences among samples and useful in assessing how distinct the samples are from one another in the multivariate pattern. In the plot due to gradual changes in the macrobenthic species composition, regions are gradated very clearly. The estuarine region is lying on the left side, inshore on top, shelf at bottom and slope on the right (Figure 6). The calculated group means of these repeated average values confirmed the above trend.
Bootstrapping averages from macrobenthic species at different regions of the study area; E, estuary; I, inshore; S, continental shelf; L, continental slope.

PERMUTATIONAL MULTIVARIATE ANALYSIS OF VARIANCE (PERMANOVA)
The PERMANOVA (Permutational Multivariate Analysis of Variance) also showed significant differences overall between the regions (Pseudo F = 5.6517, P = 0.001). Pair-wise tests of PERMANOVA done showed the macrobenthic population in estuary to differ significantly with the other regions (estuarine and inshore region: t = 2.5035, P = 0.02); estuarine and continental shelf: t = 2.9012, P = 0.003), estuarine and slope (t = 3.061, P = 0.023); inshore and continental shelf −t = 1.9725, P = 0.016 and continental shelf and continental slope (t = 1.9599, P = 0.007). However the differences between inshore and slope were not significant (t = 1.8983, P = 0.101).
SIMILARITY PERCENTAGE (SIMPER)
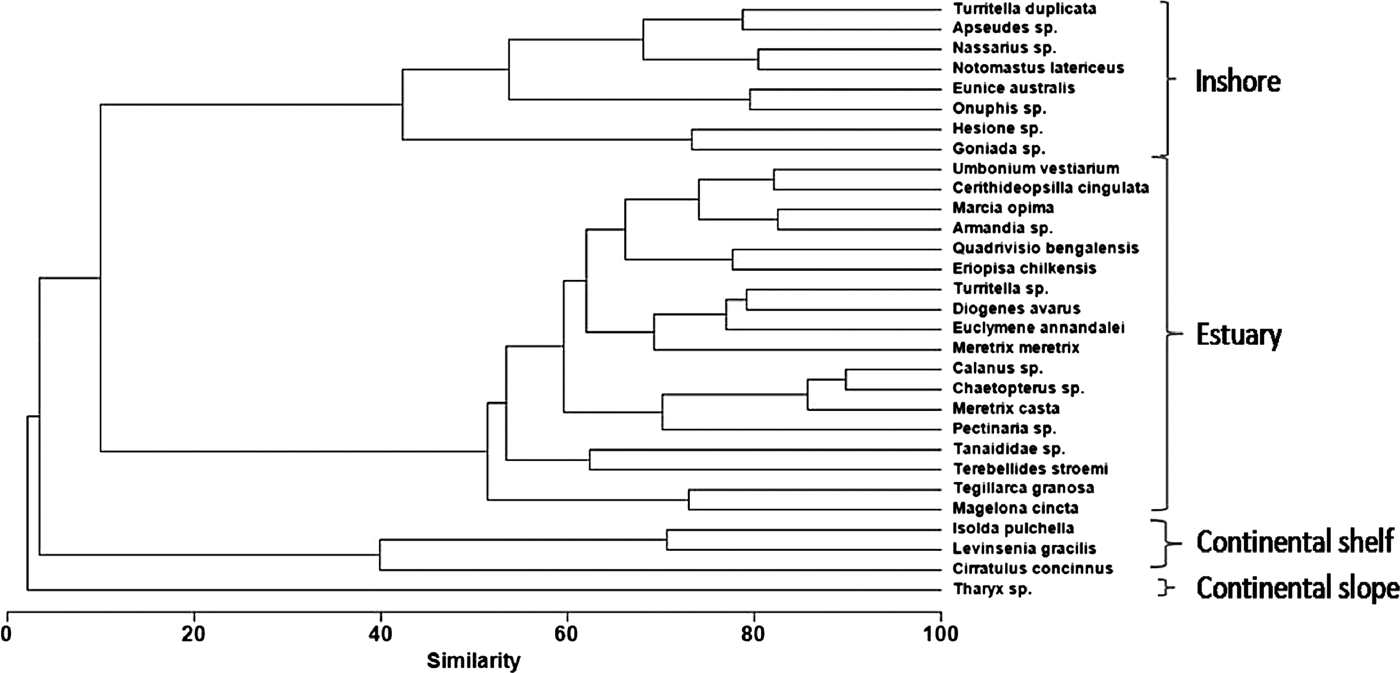
Similarity percentage (SIMPER) was done to find out the species characterizing each region (estuary, inshore, shelf and slope). Although the similarity levels among the samples collected from each region were low (51.43% in estuary, 24.64% in inshore, 27.63% in shelf and 39.52 in slope), the dissimilarity among the regions was on the much higher side (93.19% in estuary and inshore – 96.82% in estuary and continental shelf followed by 90.05% in continental shelf and continental slop, 96.22% in estuary and continental slope, 93.74% in inshore and continental slope and 96.63% in inshore and continental shelf). The species of macro benthos characterizing each region are given in the dendrogram. The estuarine (E) region was characterized by species such as Tanaididae sp. Pirenella cingulata, Meretrix meretrix, Meretrix casta, Tegillarca granosa, Turritella sp., Calanus sp., Umbonium vestiarium, Quadrivisio bengalensis, Diogenes avarus, Pectinaria sp., Magelona cincta, Chaetopterus sp., Marcia opima, Armandia sp., Euclymene annandalei, Eriopisa chilkensis and Terebellides stroemi (Figure 7). The inshore region was characterized by molluscs and polychaetes besides Tanaids (Turritella duplicata, Nassarius sp., Notomastus latericeus, Onuphis sp., Goniada sp., Hesione sp., Eunice australis and Apseudes sp.). The samples collected from the continental shelf area were characterized by polychaete species such as Cirratulus concinnus, Levinsenia gracilis and Isolda pulchella. The slope region which is at the bottom of the dendrogram was characterized by only one polychaete species (Tharyx sp.).
Macrobenthic species characterizing the four regions (estuary; inshore; continental shelf; continental slope) in the study area.

Distribution of feeding types of polychaetes
Overall the surface deposit-feeders (SDF) (37.67%) were found to be the dominant feeding type in the entire region, followed by carnivorous (C), subsurface deposit feeder (SSDF), filter feeder (FF) and omnivorous (O) with 34.39, 15.12, 8.26 and 4.46% respectively (Table 4). In the estuarine region, among the various feeding types the carnivorous (15.15–51.72%) constituted the highest percentage followed by others (SDF: 0–39.39%, SSDF: 13.79–31.58%, FF: 3.45–23.91% and O: 0–15.15% respectively). The same trend was observed in the inshore region as well (C: 40.77–61.96%, SDF: 22.29–38.46%, SSDF: 7.07–28.92%, FF: 0–11.54% and O: 0–2.41% respectively). In the shelf region, the SDF (30.95–96.21%) was found to be more than other feeders (C: 2.27–50%, SSDF: 0.76–13.10%, O: 0–7.79% and FF: 0–2.38%). Here the omnivorous and filter feeders were very rare. The frequency of SDF was also high (70.83–75%) in the slope region. The carnivorous feeders were found in the range of 8–19% followed by subsurface deposit feeders (5–20%).The omnivorous and filter feeders were not present in the slope region.
Feeding types of macrobenthic infaunal polychaetes with their relative abundance (%) at different regions sampled in Bay of Bengal. SSDF, subsurface deposit feeders; SDF, surface deposit feeders; C, carnivores; O, omnivores, FF, filter feeders.

Factors influencing the community distribution
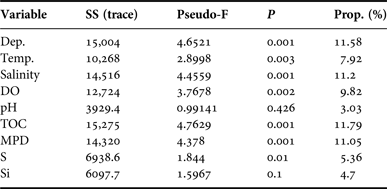
In the distance based linear model (DISTLM) used to find out the relationship between the abundance of macrofauna and environmental variables, a marginal test was done. In the marginal test, all the environmental variables except pH such as total organic carbon (P = 0.001), median particle diameter (P = 0.001), depth (P = 0.001), salinity (P = 0.001), dissolved oxygen (P = 0.001), temperature (P = 0.001), sand (P = 0.005) and silt/clay (P = 0.005) showed a significant relationship with macrobenthos (Table 5). The total variability explained by all the variables chosen in the sequential test was 76.45%. Variables such as total organic carbon (11.79%), depth (11.58%), salinity (11.2%), median particle diameter (11.05%) and dissolved oxygen (9.82%) explained more of the total variability explained.
Results of marginal tests of DISTLM.

DISCUSSION
Soft bottom macrobenthic communities are key components in the functioning of coastal and marine ecosystems (Lu, Reference Lu2005). These bring about considerable changes in physical and chemical composition of sediments, especially in the water–sediment interface (Gaudencio & Cabral, Reference Gaudencio and Cabral2007; Shou et al., Reference Shou, Huang, Zeng, Gao, Liao and Chen2009). Macrofauna in marine sediment plays an important role in ecosystem processes such as nutrient cycling, pollutant metabolism, dispersal and burial as well as secondary production (Snelgrove, Reference Snelgrove1998).
Composition and abundance
Among macrobenthos, polychaetes are an important group of organisms. In the present study polychaetes were dominant, constituting 53.89% of the total number of organisms collected and 60.67% of the number of species. Similar observations have been made previously by Teixeira et al. (Reference Teixeira, Salas, Neto, Patrício, Pinto, Veríssimo, García-Charton, Marcos, Pérez-Ruzafa and Marques2008) in the lower Mondego estuary (Portugal), Helguera et al. (Reference Helguera, Díaz-Asencio, Fernández-Garcés, Gómez-Batista, Guillén, Díaz-Asencio and Armenteros2011) in the semi-enclosed bay of Cienfuegos, Caribbean Sea and Veas et al. (Reference Veas, Mirandab, Quiñones and Carrasco2012) in the continental shelf and shallow bays off central-southern Chile. The predominance of polychaetes was also recorded in slopes of the North-east Atlantic region (Flach & de Bruin, Reference Flach and de Bruin1999).
Murugesan et al. (Reference Murugesan, Ajithkumar, Khan and Balasubramanian2009) found the polychaetes to constitute 50% of the macrofauna in Vellar estuary. In the inshore waters of Parangipettai coast Kundu et al. (Reference Kundu, Mondal, Lyla and Khan2010) observed the polychaetes to constitute 45% of the total macrobenthic abundance. Manokaran et al. (Reference Manokaran, Khan and Lyla2015) reported that the benthic fauna consisted mainly of polychaetes (88.51%) in all three depth zones (shallow (30–75 m), middle (76–150 m) and deeper (>150 m)) of the south-east continental shelf. Joydas & Damodaran (Reference Joydas and Damodaran2009) also observed the dominance of polychaetes (56.97%) in the macrofauna of the shelf in the west coast of India. The dominance of polychaetes in the shelf and slope regions of India has been reported by various workers (Ganesh, Reference Ganesh2003; Jayaraj et al., Reference Jayaraj, Jayalakshmi and Saraladevi2007; Ganesh & Raman, Reference Ganesh and Raman2007; Pavithran et al., Reference Pavithran, Ingole, Nanajkar and Goltekar2009; Ingole et al., Reference Ingole, Sautya, Sivadas, Singh and Nanajkar2010; Joydas & Damodaran, Reference Joydas and Damodaran2013).
Polychaetes have roles in the food chain, bioturbation and sediment reworking. The dominance of polychaetes among the macrobenthic organisms is attributed to their wide distribution in a variety of marine and estuarine habitat types. Therefore they are among the most frequent, abundant and species-rich group of marine benthos, characterized by high species richness and diversity in marine sediments as well as high biomass and density. They often constitute over one-third of the total number of macrobenthic species (Ushakov, Reference Ushakov1965; Fauchald & Jumars, Reference Fauchald and Jumars1979). Their dominance and wide distribution is also attributed to their quick re-productivity (Hutchings, Reference Hutchings1998).
In all the 11 dominant macrobenthic polychaetes species found in the four regions were Cirratulus concinnus, Magelona cincta, Onuphis sp., Terebellides stroemi, Goniada sp., Chaetopterus sp., Prionospio sp., Armandia sp., Glycera sp., Pectinaria sp. and Diopatra neapolitana.
In the present study the second dominant group was molluscs, forming 27.84% of the total number of organisms as well as 21.74% of the number of species, as found in many previous works (Louzao et al., Reference Louzao, Anadón, Arrontes, Álvarez-Claudio, Fuente, Ocharan, Anadón and Acuna2009; Helguera et al., Reference Helguera, Díaz-Asencio, Fernández-Garcés, Gómez-Batista, Guillén, Díaz-Asencio and Armenteros2011; Muniz et al., Reference Muniz, Venturini, Hutton, Kandratavicius, Pita, Brugnoli, Burone and García-Rodríguez2011). Louzao et al. (Reference Louzao, Anadón, Arrontes, Álvarez-Claudio, Fuente, Ocharan, Anadón and Acuna2009) recorded 57 species (28.8%) of molluscs which constituted the second most dominant group among macrobenthos. The reasons for their dominance are that the members of mollusc groups tend to be less mobile and (possibly) have a high ratio of omnivores and filter feeders. The molluscs were found to be more dominant in the estuarine (30.77% of total number of organisms and 10.14% of total number of species) and inshore (36% of total number of organisms and 45.68% of total number of species) regions than the others (continental shelf – 3.19% of the total number of organisms and 8.98% of total number of species and continental slope – 25% of total number of organisms and 11.06% of total number of species). Omnivores and filter-feeders can be theorized to prefer coarse sediment habitats with higher food content in the near-bottom water column, favouring an epibenthic lifestyle to acquire that food (Gage & Tyler, Reference Gage and Tyler1991).
Overall the six dominant macrobenthic molluscan species found in the four regions were Meretrix meretrix, Meretrix casta, Pirenella cingulata, Tegillarca granosa, Turritella sp. and Umbonium vestiarium.
Influence of habitat heterogeneity on feeding guilds of polychaetes
Generally, high abundance of carnivores is found on sandy bottoms due to proliferation of potential prey organisms in their interstitial spaces (Muniz & Pires, Reference Muniz and Pires1999). Chasse (Reference Chasse1972) related the distribution of carnivores with their metabolism, pointing out that these may be dependent on higher concentrations of dissolved oxygen, coarser sediments and stronger water circulation (i.e. increased turbulence). It has been argued that the distribution of these carnivorous polychaetes in coarser sands is associated with a greater mobility of the interstitial organisms that the polychaetes feed on and to higher oxygen penetration (Gaston, Reference Gaston1987). The higher relative abundance of carnivores in estuarine and inshore regions may be due to stronger water circulation in this region induced by the river Vellar which joins the Bay of Bengal here. Manokaran et al. (Reference Manokaran, Khan, Lyla, Raja and Ansari2013) stated that the higher proportion of carnivores in near-shore waters at Singarayakonda coupled with their higher richness values was due to stronger water circulation arising out of river Krishna joining the Bay of Bengal here.
Wildish & Kristmanson (Reference Wildish and Kristmanson1997) stated that surface deposit feeders are generally associated with areas with little hydrodynamic action on the seafloor, as currents limit their feeding and locomotion abilities. This holds good in the present day also for the dominance of surface deposit feeders in shelf and slope as Hacker et al. (Reference Hacker, Firing and Hummon1998) and Manokaran et al. (Reference Manokaran, Khan, Lyla, Raja and Ansari2013) reported little hydrodynamic action on the seafloor. In the present study, the higher abundance of surface deposit feeders was found in the seafloor with little hydrodynamic action in the continental shelf and slope regions of Bay of Bengal.
Diversity
Generally the higher diversity values were found at shallower depths and lower values were found at deeper depths. The same trend was observed in different regions (shelf, slope and basin) in the west coast of India (Ingole et al., Reference Ingole, Sautya, Sivadas, Singh and Nanajkar2010). Increased diversity could be due to increased proportion of coarser sediment in the shallower depth (Long & Lewis, Reference Long and Lewis1987) associated with prey availability and abundance and higher oxygen levels. Clear-cut zonation patterns in the form of a serial change in community structure with increasing depth are a striking feature of shallow water benthic communities on both hard and soft substrata. The causes of zonation patterns are varied and may differ according to circumstances, but include environmental gradients such as depth, light or wave energy, competition and predation. Elimination of a particular predator may affect the patterns which are due to differential mortality of species caused by that predator (Clarke & Warwick, Reference Clarke and Warwick2001). The serial change in species composition with increases in depth (estuarine to slope regions) studied in the present study (Spearman rank correlation – Rho value 0.608 falling distinctly away from the 95% confidence limit) indicated significant changes which are associated also with change in temperature, sediment size, hydrodynamics and food availability.
Factors influencing the community distribution
In the distance based linear model (DISTLM), the environmental variables explained about 76.45% of the total variability in macrofauna. This is quite significant. In the marginal test many variables such as total organic carbon, median particle diameter, depth, salinity, dissolved oxygen and temperature showed a significant relationship with macrobenthos and explained more (>70%) of the total variability.
CONCLUSIONS
This study revealed several important characteristics of the macrofaunal communities and their response to heterogeneity of different regions in the south-east coast of India. The physiographic provinces and their related environmental characteristics in the study area generated habitat heterogeneity which is summarized below together with the corresponding community characteristics. The molluscs were dominant in the estuarine (E1–E5) and inshore regions next to polychaetes. Generally, this region has high sand content with high organic carbon. Therefore, it contained the highest abundance with moderately high diversity and carnivorous feeding type. The shelf (30–200 m) region was dominated by only polychaetes with sandy sediment and decreasing oxygen level. It included part of the OMZ at 153 m. The shelf contained moderately low abundance with the dominance of surface deposit feeding types. The slope (201–>800 m) region was also characterized by only polychaetes with silty/clay content and included the oxygen minimum zone.
In DISTLM analysis, the total variability explained by all the variables was 76.45%. These hold good as the areas chosen for the present study vary widely from the estuary through inshore to shelf and slope (shallower depth to deeper depth 1–1000 m depth; lower organic carbon of 0.53 ± 0.26 to higher level of 10.41 ± 1.34 mg g−1; lower salinity of 29 ± 2.3 PSU to seawater salinity of 35.01 ± 0.005 PSU; higher oxygen content of 7.46 ± 0.40 mL L−1 to the lowest level of 0.096 ± 0.035 mL L−1. Therefore the dominant taxa, faunal composition and feeding types differed along the gradient. In addition to the environmental variables, variables such as availability of food could have been included, but this was not covered in the present study. Such studies could be expanded to other estuarine areas with higher water runoff so as to understand the influence of water dynamics on the community structure of macrobenthos in the coastal region.
ACKNOWLEDGEMENTS
The authors are grateful to Prof. K. Kathiresan, Director and Dean of their Centre, for the encouragement and the University authorities for the facilities.
FINANCIAL SUPPORT
The funding support by the Centre for Marine Living Resources and Ecology (CMLRE) of the Ministry of Earth Sciences (MoES), Government of India is gratefully acknowledged.