


Introduction
As basic silicate melts cool and crystallise under certain pressure, temperature, compositional and oxygen fugacity conditions, they can unmix to form an emulsion of two immiscible liquids: one rich in Si and the other dominated by Fe (e.g. Charlier and Grove, Reference Charlier and Grove2012). Existing work on the evolution of silicate liquid immiscibility in crystal mush and bulk magmas has typically focused on the chemistry of the unmixed liquids (e.g. Roedder, Reference Roedder1951; Veksler et al., Reference Veksler, Dorfman, Borisov, Wirth and Dingwell2007; Charlier and Grove, Reference Charlier and Grove2012). However, limited textural observations suggest that cooling rate may have a major effect on the distribution and coarsening of an emulsion (Martin and Kushiro, Reference Martin and Kushiro1991). As the migration and accumulation of these unmixed liquids are potentially linked to the differentiation of crustal magma bodies (e.g. Veksler et al., Reference Veksler, Dorfman, Borisov, Wirth and Dingwell2007) and the formation of some economic mineral deposits (e.g. magnetite–hematite–apatite ores; Frietsch, Reference Frietsch1978), further work is essential to establish the controls on their microstructural evolution.
Previous studies investigating the microstructures of systems containing immiscible silicate liquids have typically focused on centimetre-sized experimental charges (e.g. Veksler et al., Reference Veksler, Dorfman, Danyushevsky, Jakobsen and Dingwell2006., Reference Veksler, Dorfman, Rhede, Wirth, Borisov and Dingwell2008; Charlier and Grove, Reference Charlier and Grove2012) or kilometre-scale igneous intrusions (Holness et al., Reference Holness, Stripp, Humphreys, Veksler, Nielsen and Tegner2011), each with very different thermal histories. Experimental investigations are limited to cooling rates of ≳1°C/h, as slower cooling rates typically result in long-term instability in the run conditions (e.g. Veksler et al., Reference Veksler, Dorfman, Danyushevsky, Jakobsen and Dingwell2006, Reference Veksler, Dorfman, Rhede, Wirth, Borisov and Dingwell2008; Charlier and Grove, Reference Charlier and Grove2012). Conversely, although the much slower cooling rates of large igneous intrusions are not as well constrained, they are likely to be on the order of 10–7°C/h (Cawthorn and Walraven, Reference Cawthorn and Walraven1998). Published descriptions of unmixed silicate liquid microstructures preserved in natural systems with cooling rates intermediate between these two extremes are rare. Examples include glass quenched during drilling of the partially solidified crust of the Kīlauea Iki lava lake in Hawaii (Honour et al., Reference Honour, Holness, Charlier, Piazolo, Namur, Prosa, Martin, Helz, Maclennan and Jean2019a) and microstructures in interstitial glass in naturally cooled tholeiitic dykes and sills (e.g. Philpotts, Reference Philpotts1978, Reference Philpotts1979, Reference Philpotts1982).
In this study, we investigate emulsion microstructure preserved in the mesostasis of three basaltic dykes from the northeast of England. Using a conductive thermal model, we calculate the cooling rates across the dykes, while plagioclase aspect ratios and grain sizes are used to constrain the fluid dynamical regime during crystallisation. The cooling rates of the dykes are slower than can be accessed routinely through experimental petrology but are significantly faster than cooling rates in larger igneous intrusions. Hence, they provide an opportunity to constrain emulsion microstructures at intermediate cooling rates, and by studying samples across individual dykes and from intrusions of different sizes, we are able to investigate the nucleation and evolution of unmixed liquids as a function of cooling rate. Dykes show significant differences in the spatial variation of mineral grain shapes and sizes compared to tabular intrusions of similar thickness but with significantly shallower dips (i.e. sills), as a result of orientation-controlled differences in fluid dynamical regime during solidification (Holness et al., Reference Holness, Neufeld, Gilbert and Macdonald2017). Following Holness et al. (Reference Holness, Neufeld, Gilbert and Macdonald2017), we argue that the Paleogene dykes of Northeast England are an exception to this general tendency, with microstructural characteristics indicative of sill-like fluid dynamical behaviour.
Geological setting
During the Palaeogene, a mantle plume in the North Atlantic (today located beneath Iceland; Saunders et al., Reference Saunders, Fitton, Kerr, Norry and Kent1997) caused uplift and thinning of the NW European continental margin, resulting in the ascent of magmas to high crustal levels and emplacement of large igneous bodies in western Scotland (the Skye, Rum-Muck, Arran and Mull central complexes). Emplacement of the Mull Central Complex was associated with the intrusion of a large NW–SE trending dyke swarm across western Scotland, northern England and into the North Sea (Harker and Clough, Reference Harker and Clough1904; Sloan, Reference Sloan1971), extending at least 600 km from its source (Fig. 1; Underhill, Reference Underhill2009; Wall et al., Reference Wall, Cartwright, Davies and McGrandle2010). The swarm is dated between 58.04 and 60.56 Ma (Mitchell et al., Reference Mitchell, Rands and Ineson1989; Chambers and Pringle, Reference Chambers and Pringle2001) and is thought to be related to a large caldera collapse event (Macdonald et al., Reference Macdonald, Baginski, Upton, Pinkerton, MacInnes and MacGillivray2010).
Overview of the Mull dyke swarm in Scotland, together with the location of the dykes examined here in Northeast England. Adapted from Holmes and Harwood (Reference Holmes and Harwood1929).

Variations in magma propagation rate are thought to have caused the thickness and spacing of the Mull dyke swarms to increase with distance from their source (Jolly and Sanderson, Reference Jolly and Sanderson1995). Modern-day dyke intrusion events in the East African Rift and Iceland have propagation rates in the range 0.3–4.7 km/h (e.g. Peltier et al., Reference Peltier, Ferrazzini, Staudacher and Bachèlery2005; Wright et al., Reference Wright, Ebinger, Biggs, Ayele, Yirgu, Keir and Stork2006; Ayele et al., Reference Ayele, Keir, Ebinger, Wright, Stuart, Buck, Jacques, Ogubazghi and Sholan2009; Ágústsdóttir et al., Reference Ágústsdóttir, Woods, Greenfield, Green, White, Winder, Brandsdóttir, Steinthórsson and Soosalu2016). Hence, we infer that the dykes of the Mull swarm took a minimum of 28 days to propagate 200 km from their source to the coast of Northeast England. Following the cessation of flow in the dykes, we assume that the magma crystallised as a closed system (e.g. Holness et al., Reference Holness, Neufeld, Gilbert and Macdonald2017).
The basaltic dykes of the Mull swarm are geochemically analogous to the Central Mull tholeiitic magma (Kerr et al., Reference Kerr, Kent, Thomson, Seedhouse and Donaldson1999; Macdonald et al., Reference Macdonald, Baginski, Upton, Pinkerton, MacInnes and MacGillivray2010). They were classified on the basis of their petrography and geochemistry by Holmes and Harwood (Reference Holmes and Harwood1929) and typical whole-rock compositions of the dykes investigated in this study are presented in Table 1. They have varying modal proportions of plagioclase, olivine and pyroxene, with a glassy matrix preserving evidence of liquid immiscibility (Holmes and Harwood, Reference Holmes and Harwood1929). We focus on three dykes: (1) the Hartley North dyke (which Teall, Reference Teall1884 termed the Collywell dyke) is fine-grained with a sinuous strike through a host rock of shale with sandy bands (Jones, Reference Jones1967; Land, Reference Land1974); (2) the Tynemouth dyke, which cuts the Coal Measures sandstone at the current level of exposure (Land, Reference Land1974) and extends SE into the North Sea (Teall, Reference Teall1884, Reference Teall1889; Heslop and Smythe, Reference Heslop and Smythe1910; Holmes and Harwood, Reference Holmes and Harwood1929; Jones, Reference Jones1967; Land, Reference Land1974); and (3) the Morpeth dyke, which is fine-grained, has the highest measured density of the Palaeogene dykes of Northeast England (Teall, Reference Teall1884; Heslop and Smythe, Reference Heslop and Smythe1910; Holmes and Harwood, Reference Holmes and Harwood1929) and is hosted within sandstone interbedded on a 10–20 m scale with fissile mudstone.
Whole-rock geochemistry (wt.%) of the Palaeogene dykes of Northeast England, taken from Holmes and Harwood (Reference Holmes and Harwood1929).

n.a. = not analysed
Samples and sample collection
Samples were collected during fieldwork in July 2016, supplemented by additional samples from the Harker Collection of the Sedgwick Museum (University of Cambridge). The Hartley North dyke was sampled 20 m from the N–S trending Collywell Bay sea wall, on the foreshore at low tide (Table 2). Here, the dyke has a strike of 105°, with a variable width (0.83–1.04 m; Fig. 2c) and chilled margins. The Tynemouth dyke is only exposed at low tide and samples were collected along the foreshore, north of the western end of the Tynemouth north pier, at the base of Castle Rock (Fig. 2a–b). At this location, it is 3.18 m wide and strikes 103°, with undulating margins on a 0.1–0.2 m scale (Table 2). The Morpeth dyke was sampled on the eastern bank of the Wansbeck, south-east of the North-Eastern Railway viaduct (Table 2), where it lies within a 5.25 m wide steep-sided gully perpendicular to the river. There is no visible outcrop and samples of olivine-rich basalt were obtained from scattered >0.3 m diameter boulders and <10 cm chips (Fig. 2d). Teall's (Reference Teall1884) description of the Morpeth dyke locality was published 34 years after the viaduct was built when there was significant building work along the bank of the Wansbeck; it is possible that it was quarried out and used for construction, thus creating the well-defined gully.
Field photographs of the sampling locations in this study. (a) Tynemouth Dyke, sampling localities outlined with white circles; (b) Tynemouth Dyke exposed north of the Tynemouth North pier; (c) Hartley North Dyke sampling localities outlined with white circles; (d) the Morpeth dyke locality.

Field locations of the Palaeogene dykes of Northeast England analysed in this study.

Analytical methods
Samples were analysed in the Department of Earth Sciences, University of Cambridge, using optical microscopy and a Quanta FEG 650 F scanning electron microscope (SEM), set to 10 kV at spot 3, with a 30 µm aperture and a working distance of 10 mm. Back-scatter electron (BSE) images were collected for the polished samples.
Average apparent aspect ratios of plagioclase grains were calculated by measuring the long and short axes of >250 crystals per sample from digital photomicrographs under crossed polars. All discernible plagioclase grains were measured in each photograph. Aspect ratios were calculated using ImageJ software (Schneider et al., Reference Schneider, Rasband and Eliceiri2012). The 2σ confidence interval of the average apparent aspect ratio was calculated using the bootstrap method (James et al., Reference James, Witten, Hastie and Tibshirani2013) as the shape of the underlying distribution is unknown. Plagioclase grain sizes were also calculated using the average of the long axis length of >250 plagioclase grains. Fe-rich droplet diameters were measured using CorelDrawX9 from BSE images. All discernible Fe-rich droplet diameters were measured in each photograph.
Preliminary electron probe micro-analysis (EPMA) data were collected on plagioclase crystals in our samples using a CAMECA SX-100 electron microprobe with five wavelength-dispersive spectrometers at the Department of Earth Sciences, University of Cambridge. The instrument uses in-house PeakSight software with ZAF correction. Appropriate natural and synthetic primary standards were used. Plagioclase compositions were analysed at 15 kV, 10 nA with a focused beam; Na and Si were analysed for 10 s on peak, Al for 20 s, Ca, Mg, and K for 30 s, and Ti and Fe for 60 s. Relevant mineral and glass secondary standards were run at regular intervals to check for precision and reproducibility.
Results
Petrography
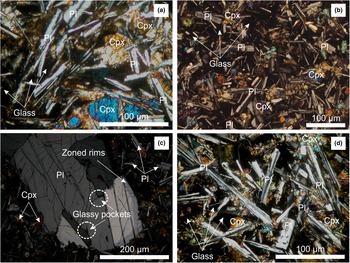
The Hartley North dyke is dominated by a matrix of fine-grained plagioclase, clinopyroxene and glass, with variable modal Fe–Ti oxide (Fig. 3a). The amount of glass increases from 16 vol.% on the chilled margins to 22 vol.% in the centre of the intrusion. The average matrix plagioclase long axis length (Table 3) increases towards the dyke centre, from 189 µm to 231 µm, and the average apparent aspect ratio decreases from 6.0 to 4.6 (Fig. 4a; Table 3). Rare, large (<2 mm × 0.8 mm) plagioclase phenocrysts with zoned rims are present throughout. Clinopyroxene is fine grained on the chilled margins (<10 µm) but reaches 100 µm diameter in the dyke centre where the crystals tend to form small clusters. Spherical amygdales filled with calcite and silica are abundant (0.5–1.8 mm in diameter), particularly in the centre of the dyke.
Crossed polar photomicrographs of the Palaeogene dykes of Northeast England: (a) centre of the Hartley North dyke; (b) centre of the Tynemouth dyke with abundant plagioclase laths and a glassy mesostasis; (c) a cluster of zoned plagioclase phenocrysts in the centre of the Tynemouth dyke; and (d) margin of the Morpeth dyke (spatial information taken from the catalogue of the Harker Collection).
Average apparent plagioclase aspect ratios measured across the (a) Hartley North dyke and (b) Tynemouth dyke. The dashed line is the predicted average apparent aspect ratio trend following Holness (Reference Holness2014).

Petrographic measurements of the Palaeogene dykes of Northeast England.

Notes: Distances from the dyke margins were measured from the north to south. Plagioclase grain size is reported as average apparent long axis, and shape is reported as the average apparent aspect ratio.
HC = samples from the Harker Collection, University of Cambridge. *Denotes the position within the dyke transect given in the catalogue of the Harker Collection. n.a. – not analysed.
The Tynemouth dyke is dominated by a fine-grained matrix of elongated plagioclase laths, clinopyroxene, oxides and glass (Fig. 3b–c) with rare olivine grains, typically <50 µm in diameter. The glass distribution is patchy but the average glass mode increases from 18 vol.% on the chilled margin to 26 vol.% in the centre of the intrusion. The glass in the dyke centre is commonly devitrified. The average apparent aspect ratio of the matrix plagioclase (Fig. 4) decreases from 5.4 on the chilled margins to 3.9 in the centre (Table 3), as does the relative number of matrix plagioclase grains per unit area. The dyke contains large plagioclase phenocrysts (<9 mm × 4 mm) with sharply-defined, <0.5 mm wide irregular rim zones and concentrically-arranged melt inclusions that outline internal growth zones. The anorthite number (molar Na/[Na + Ca]) of the large plagioclase phenocrysts decreases from the centre to the rims of the crystals (Supplementary Fig. S1, Table S1). The number of plagioclase phenocrysts increases towards the intrusion centre, where they form polycrystalline clusters with a shared outer rim zone; the plagioclase rim zone is absent on crystal faces adjacent to pockets of glass within the polycrystalline cluster (Fig. 3c). The grain size range of matrix plagioclase in the Tynemouth dyke broadens towards the intrusion centre and the average long axis length increases from 143 µm to 236 µm (Table 3). Clinopyroxene grains are small (<80 µm diameter) and isolated in the matrix on the chilled margins, whereas in the centre of the dyke they are larger (<150 µm diameter) and form clusters or partially enclose plagioclase grains. Fe–Ti oxide grains are <50 µm across and are typically found in the mesostasis. Spherical amygdales filled with calcite and silica are irregularly distributed throughout the Tynemouth dyke, increasing in number and size towards the centre.
The Morpeth dyke is characterised by a matrix of elongated plagioclase laths, clinopyroxene, olivine, oxides and glass (Fig. 3d). The glass mode is analogous to the Tynemouth and Hartley North dykes at ~25 vol.%. Although spatial variations in matrix plagioclase average apparent aspect ratio and grain size could not be quantified due to the lack of outcrop, the long axis length in our samples reaches ~500 µm, while the average plagioclase apparent aspect ratio is 4.8. Large plagioclase phenocrysts (3 mm × 2 mm) are rare but have strongly zoned rims and melt inclusions in their core. Clinopyroxene is evenly distributed, with grain diameters ranging between 50–200 µm. Rare olivine grains (100–300 µm diameter) form small monomineralic clusters, typically comprising 3–4 grains. Spherical amygdales filled with calcite and silica are present in all of our samples.
Immiscibility microstructures
Evidence of unmixing of the interstitial liquid of the Palaeogene dykes of Northeast England was first reported by Philpotts (Reference Philpotts1982). The whole-rock composition implies that the Fe-rich immiscible liquid is the minor phase, while the Si-rich conjugate forms the major phase (i.e. Fe-rich droplets are dispersed within a continuous Si-rich liquid). The glass in the dykes is generally altered, with increasing devitrification towards the centres, resulting in poorer microstructural preservation. However, droplets of immiscible Fe-rich material are always present in the mesostasis, regardless of sample position within the dyke or the dyke width (Fig. 5a–f). Where glass is still present, the Fe-rich droplets are spherical to sub-spherical, with a high refractive index and a white-to-brownish colour in plane polarised light. Where the glass is fully or partially devitrified, the droplets are framboidal (Fig. 5).
BSE images of the Fe-rich emulsion in the Tynemouth dyke. Images (a) to (f) show a progressive transect southwards towards the dyke's centre, with exact distance from the north margin given in the bottom left of each photo. Note the predominance of Fe-rich droplets that are attached to plagioclase, compared to those isolated in the glass, particularly close to the margin.

The Fe-rich droplets are larger (up to 20 µm diameter) and more abundant in the centre of the dykes than at their margins. On the margins, the Fe-rich droplets are preferentially attached or proximal to plagioclase grains. Towards the dyke centres, the Fe-rich droplets show no preferential association with any crystal phase and there is an increased prevalence of isolated droplets (i.e. droplets that appear unconnected to any crystal phase in 2D section). Where Fe-rich droplets are attached to plagioclase grains, they have apparent wetting angles >90°. They are not found adjacent to mafic phases and we found no evidence of two droplets coalescing (i.e. no Fe-rich droplets with ‘figure-of-eight’ shapes).
There are variations in the emulsion microstructure between the three dykes. In the Morpeth dyke, the Fe-rich droplets are larger and have a higher number density than in the Tynemouth and Hartley North dykes (even in samples from the margin of the dyke; Fig. 6). Fe-rich droplets in the Hartley North dyke are the least abundant and the smallest of those in the three dykes (Fig. 6g–i).
Plane-polarised light images of emulsion microstructures for all three dykes, showing the Fe-rich droplets in the glassy mesostasis. The glass of the mesostasis is commonly brown, with the Fe-rich droplets ranging from white to dark brown. The Fe-rich droplets are typically attached to plagioclase. (a–c) Sample from the margin of the Morpeth dyke (Table 3); (d–e) sample from the centre of the Tynemouth dyke; (f) sample from the margin of the Tynemouth dyke; and (g–i) sample from the margin of the Hartley North dyke.

Discussion
The crystallisation regime
The shape of plagioclase grains grown under interface-controlled conditions is a function of crystallisation time (Holness, Reference Holness2014). In vigorously convecting magma within a tabular body, plagioclase crystals grow in suspension and the resultant averaging of the thermal history of each grain means that their shape is invariant across the width of the intrusion (Holness et al., Reference Holness, Neufeld, Gilbert and Macdonald2017). In contrast, if the crystallising magma is either static or weakly convecting, solidification is dominated by the nucleation and growth of crystals on inwards-propagating solidification fronts: in such bodies plagioclase average apparent aspect ratio decreases from the intrusion margins towards the centre (Holness et al., Reference Holness, Neufeld, Gilbert and Macdonald2017). Assuming diffusive heat loss, the average apparent plagioclase aspect ratio at any point across a tabular intrusion that solidified by the inwards-propagation of solidification fronts is given by (Holness Reference Holness2014):
 $$\eqalign{{\rm plagioclase\ aspect\ ratio} &= [ {\rm log}\lpar {\rm cooling\ time\ in\ years} \rpar \cr &\ \quad-6.34 ] / {\lpar {-1.79} \rpar}}$$
Consequently, we can use the spatial variation of plagioclase grain shape to test whether vigorous convection occurred during crystallisation of the investigated dykes.
The highest plagioclase average apparent aspect ratios are observed on the margins of the Hartley North and Tynemouth dykes, while the lowest ratios are measured in their centres. The plagioclase average apparent aspect ratios across the Hartley North and Tynemouth dykes match the trends predicted for non-convecting magma bodies using equation 1, but are systematically off-set to higher values (Fig. 4). It is well-known that aspect ratio decreases as crystallisation proceeds, due to the effects of impingement (Martin et al., Reference Martin, Griffiths and Campbell1987; Pupier et al., Reference Pupier, Duchene and Toplis2008; Schiavi et al., Reference Schiavi, Walte and Keppler2009; Applegarth et al., Reference Applegarth, Tuffen, James, Pinkerton and Cashman2013) but the Holness (Reference Holness2014) relationship between plagioclase grain shape and cooling timescales described in equation 1 was developed using fully-solidified dolerites. We suggest that the relatively high aspect ratios observed in our samples may be a consequence of the significant volume of uncrystallised material comprising the mesostasis: the average apparent aspect ratio of the plagioclase did not attain the expected low values as crystallisation was incomplete. We also note that there are a number of spherical amygdales in the dykes, which suggest that magma degassed during crystallisation. Devolatilisation could drive plagioclase oversaturation (Yoder et al., Reference Yoder, Stewart and Smith1957; Hort, Reference Hort1998) and an increase in plagioclase growth rate, which might also result in higher average apparent aspect ratios than predicted by the Holness (Reference Holness2014) relationship (Fig. 4).
In addition to differences in the spatial variation of plagioclase grain shape in convecting and non-convecting systems, the average grain size is larger and the range of grain sizes is narrower in convecting tabular intrusions, relative to non-convecting intrusions of the same width (i.e. with similar cooling timescales; Holness et al., Reference Holness, Neufeld, Gilbert and Macdonald2017). The cumulative frequency of the plagioclase long axis length from the centre and margin of the Hartley North and Tynemouth dykes is shown in Fig. 7, as well as grain size data from previously identified convecting (a 3.7 m wide basaltic dyke from the Isle of Mull) and non-convecting intrusions (the 3.5 m thick Traigh Bhàn na Sgùrra sill of the Isle of Mull), which have similar widths to the Northeast England intrusions (i.e. within an order of magnitude; Holness et al., Reference Holness, Neufeld, Gilbert and Macdonald2017). The cumulative frequency distributions of plagioclase long axis length from the centre and margin of the Tynemouth and Hartley North dykes are similar to those of the non-convecting Traigh Bhàn na Sgùrra sill, rather than the convecting dyke. Together with the spatial variation of plagioclase grain shape, these data suggest that crystallisation in the Northeast England dykes was dominated by the inwards propagation of solidification fronts, in agreement with Holness et al. (Reference Holness, Neufeld, Gilbert and Macdonald2017), who identified non-convective crystallisation in the Moneyacres dyke in Ayrshire (another member of the Mull dyke swarm). The absence of convection following dyke propagation may have been due to a high crystallite load, resulting in a high magma viscosity (Holness et al., Reference Holness, Neufeld, Gilbert and Macdonald2017).
The cumulative frequency distributions of grain sizes (measured as the length of the apparent long axis of plagioclase as viewed in thin section) in the centres (a) and margins (b) of the Tynemouth and Hartley North dykes. A typical convecting dyke (a 3.7 m wide basaltic dyke on the coast of the Isle of Mull) and a non-convecting sill (the 3.5 m wide Traigh Bhan na Sgurra basaltic sill on the Isle of Mull) with similar average grain sizes to the Northeast England dykes are shown for comparison (data from Holness et al., Reference Holness, Neufeld, Gilbert and Macdonald2017). Static systems have a greater range of grain sizes than convecting systems; the Tynemouth and Hartley North dykes correspond more closely with the static example).

We consider it unlikely that silicate liquid unmixing occurred during dyke propagation: magma compositions only approach the silicate liquid binodal after significant differentiation (i.e. probably after crystallisation of groundmass plagioclase); we see no evidence of bimodal melt inclusion populations in large plagioclase phenocrysts (indicative of the trapping of two immiscible liquids c.f. Jakobsen et al., Reference Jakobsen, Veksler, Tegner and Brooks2011; Fischer et al., Reference Fischer, Wang, Charlier, Namur, Roberts, Veksler, Cawthorn and Holtz2016, although this might be masked by devitrification); and preliminary geochemical transects across the large plagioclase phenocrysts show no evidence of decreasing TiO2 concentrations towards the rim, which is indicative of liquid unmixing during crystallisation (c.f. Humphreys, Reference Humphreys2011; Fig. S1). Unmixing therefore occurred in a static magma, once matrix plagioclase had started to crystallise.
Thermal modelling of cooling rate
As the magma in the dykes was static (or only weakly convecting) during solidification, we use a 1D thermal model to calculate the cooling rate at different positions across the intrusions for comparison with the size and abundance of unmixed Fe-rich droplets. The cooling rate of any sample from a tabular basaltic intrusion can be approximated assuming conductive in situ heat transfer into the host rock, following the approximation of (Holness et al., Reference Holness, Richardson and Helz2012):
 $$\tau \; = \; 0.1\displaystyle{{w^2} \over K}\left( {1 + \cos \left( {\displaystyle{{2\pi z} \over w}} \right)} \right)$$
where τ is the time taken to cool from 1200°C to 1000°C (the assumed temperature range of crystallisation, following Cashman, Reference Cashman1993; and Holness et al., Reference Holness, Richardson and Helz2012), z is the position within the body measured from the centre (in metres), w is the total intrusion thickness (in metres) and κ is thermal diffusivity (m2/s). We assume a far-field host rock temperature of 0°C and set κ to 4.8·10−7 m2/s on the basis of thermal diffusivity measurements of basalt at 1000°C (Hartlieb et al., Reference Hartlieb, Toifl, Kuchar, Meisels and Antretter2016).
Our 1D cooling model suggests the Hartley North dyke took 5 days to crystallise in the centre and 0.5 days near the margins (defined in Table 3), corresponding to average cooling rates of ~1.7°C/h and ~16.7°C/h, respectively. The Tynemouth dyke took 43 days to crystallise in the centre and 0.5 days near the margins (defined in Table 3), corresponding to average cooling rates of ~0.2°C/h and ~17°C/h, respectively. Assuming the Morpeth dyke was no wider than the gully in which it was sampled, the centre is predicted to have had a maximum cooling time of 117 days, with an associated average cooling rate of ~0.1°C/h.
The effect of cooling rate on emulsion behaviour
In a static regime, the microstructure of magmatic emulsions is controlled chiefly by temperature and time (e.g. Martin and Kushiro, Reference Martin and Kushiro1991). Additional factors that can affect microstructural evolution include composition, pressure and  $f_{O_2}$ (e.g. Charlier and Grove, Reference Charlier and Grove2012). However, these are second-order variables (Martin and Kushiro, Reference Martin and Kushiro1991) and are unlikely to vary significantly between compositionally similar mafic dykes (Table 1) emplaced at comparable depths.
Nucleation
Compositional boundary layers can develop at the interface between crystals and their host liquids; the thickness of these layers depends on the crystal growth rate, the elemental diffusion rates within the liquid and the relative motion of crystals and their surrounding liquid (Levich, Reference Levich and Amundson1962; Zellmer et al., Reference Zellmer, Sakamoto, Hwang, Matsuda, Iizuka, Moebis and Yurimoto2016). The development of these compositional boundary layers can promote the onset of liquid unmixing, causing Fe-rich droplets to preferentially nucleate on (or near) plagioclase grains (Philpotts, Reference Philpotts1981). Compositional gradients around crystals are best developed during rapid crystal growth and we would therefore expect Fe-rich droplets to have a greater association with plagioclase crystals at higher cooling rates. This accounts for the greater number of Fe-rich droplets attached to plagioclase crystals in the rapidly cooled margins of the Hartley North and Tynemouth dykes, relative to their slower cooler centres.
Considering both samples from different places within the same dyke and samples from different dykes, we find that slower cooling rates correlate with increased numbers of Fe-rich droplets in the interstices (including both heterogeneously nucleated attached droplets and homogeneously nucleated isolated droplets). This is at odds with the experiments of Martin and Kushiro (Reference Martin and Kushiro1991), which contain more droplets at higher cooling rates, leading the authors to conclude that slow cooling promotes increased droplet coalescence rather than a decrease in nucleation rate. We suggest that the disparity between our observations and these experimental results can be explained by magma cooling rates at the dyke margins being fast enough that there is insufficient time for droplets to nucleate before the glass transition temperature was reached. Additionally, the smaller grain size and higher aspect ratios of the network-forming plagioclase grains near the intrusion margins (i.e. at high cooling rates) reduced the size of the interstitial liquid pockets, impeding nucleation and resulting in fewer Fe-rich droplets (e.g. Putnis and Mauthe, Reference Putnis and Mauthe2001; Holness and Sawyer, Reference Holness and Sawyer2008).
The Morpeth dyke has the most Fe-rich bulk composition of our samples and the Hartley North dyke is the most Fe poor (Table 1). The bulk FeO content of the dykes correlates with the size and abundance of the Fe-rich droplets, and thus the volume fraction of Fe-rich immiscible liquid. This agrees with the experimental results of Charlier and Grove (Reference Charlier and Grove2012), which demonstrate that differing whole-rock compositions affect the shape and size of the silicate liquid immiscibility field and thus the relative volumes of the two immiscible liquids: the abundance of the Fe-rich liquid generally increases with total FeO in the bulk melt (other elements such as P, alkalis and volatiles also have a minor affect the size of the binodal; e.g. Lester et al., Reference Lester, Clark, Kyser and Naslund2013).
Only whole-rock data are available for the dykes in this study; these consistently have an Mg# [molar Mg/ (Mg + Fetotal)] of ~57 (Table 1), which is significantly higher than the Mg# from existing experiments quantifying the silicate liquid immiscibility field (e.g. bulk-liquid compositions studied by Charlier and Grove, Reference Charlier and Grove2012, had a Mg# of 29–36). Although the interstitial liquid in the dykes probably has a lower Mg# than their bulk composition (due to olivine and clinopyroxene crystallisation), it is not possible to quantitatively constrain the position of the dyke magmas on a binodal using the available geochemical data. This could be achieved with further geochemical work extending the silicate liquid immiscibility experimental database over a greater range of starting compositions.
Emulsion coarsening
In our samples, slower cooling rates are associated with larger Fe-rich droplets and a wider droplet size distribution, both across a single intrusion and between intrusions. For example, across the Tynemouth dyke, a three orders of magnitude increase in cooling rate correlates with an order of magnitude increase in droplet size (Fig. 8) and a widening of the droplet size distribution. Similarly, droplets are larger and more variable in size in the centre of the slower cooling Tynemouth dyke than in the centre of the smaller, and therefore faster cooling, Hartley North dyke. This implies Fe-rich droplet size does not scale linearly with cooling rate and supports previous experimental work that suggests Fe-rich droplet size and cooling rate are related by an exponential law (Martin and Kushiro, Reference Martin and Kushiro1991). Regressing the data of Martin and Kushiro (Reference Martin and Kushiro1991) suggests that variations in Fe-rich droplet size are related to the cooling rate of tholeiitic basalts via:
 $$y = 73.159{\rm e}^{- 0.646x}$$
where x is the average of the five largest diameter (μm) Fe-rich droplets in each sample and y is cooling rate (°C/h).
The relationship between Fe-rich droplet size (average of five largest droplets per sample) and the cooling rate (Table 3) for the Hartley North and Tynemouth dykes. Data from Martin and Kushiro (Reference Martin and Kushiro1991) are shown for comparison. The grey dots are for data from Martin and Kushiro (Reference Martin and Kushiro1991) with a trendline showing an exponential regression, while the black dashes are for the whole data set with a trendline showing a power law regression.
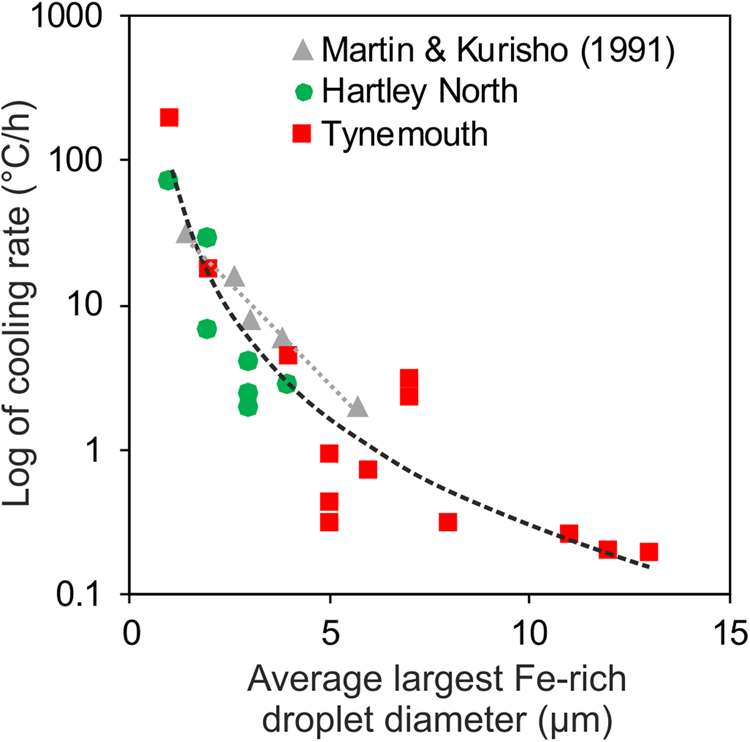
Using the largest Fe-rich droplets in the centre of the Hartley North dyke, equation 3 predicts a cooling rate of 5.5°C/h, which is faster than the 1.7°C/h calculated using the simple 1D cooling model of Holness et al. (Reference Holness, Richardson and Helz2012). While these estimates are comparable within an order of magnitude, the disparity could be caused by factors other than cooling rate controlling the Fe-rich droplet size. The coarseness of Fe-rich droplets in unmixed silicate melts is a function of diffusion-controlled droplet growth, Ostwald ripening and/or coalescence. Diffusion-controlled Fe-rich droplet growth is driven by widening of the silicate liquid immiscibility binodal during cooling or chemical equilibration (Honour et al., Reference Honour, Holness, Partridge and Charlier2019b). Ostwald ripening is driven by differences in the surface curvature of the Fe-rich droplets as a function of size (Ostwald, Reference Ostwald1897; McNaught, Reference McNaught1997). Coalescence occurs as droplets collide and is a function of droplet radius, viscosity, density and the interfacial energy (Yao et al., Reference Yao, Maris, Pennington and Seidel2005). Recent progress in defining the binodal for silicate liquid immiscibility (Charlier and Grove, Reference Charlier and Grove2012) and investigating the microstructure of unmixing magmas with constant cooling rates (Farr et al., Reference Farr, Honour and Holness2017; Honour et al., Reference Honour, Holness, Partridge and Charlier2019b) indicates that liquid composition may also affect droplet size due to an expansion or reduction in the volume of Fe-rich liquid.
The largest Fe-rich droplets in our samples from the Tynemouth and Morpeth dykes are bigger than those measured by Martin and Kushiro (Reference Martin and Kushiro1991). Their model is not calibrated for cooling rates <2°C/h and thus does not adequately capture the range of cooling rates that our 1D cooling model predicts for the Northeast England dykes. Combining our new data for the Northeast England dykes with the experiments of Martin and Kushiro (Reference Martin and Kushiro1991) extends the range of cooling rates (Fig. 8), and we find that the relationship between droplet size and cooling rate (°C/h) is better expressed by the power law regression:
 $$y = 84.681x^{- 2.461}$$
where x is the average of the five largest diameter (μm) Fe-rich droplets in each sample.
At fast cooling rates (>5°C/h) and low proportions of interstitial liquid on the dyke margins (Table 3), the time between the liquid intersecting the binodal and reaching the glass transition could be <60 h, based on the known apex temperature of the silicate liquid immiscibility binodal (1025°C; Charlier and Grove, Reference Charlier and Grove2012) and the glass transition temperature (experimentally determined to be 725°C for a Kīlauea basalt from the Kīlauea Iki lava lake; Ryan and Sammis, Reference Ryan and Sammis1981). Note, this is likely to be a maximum timescale as the glass transition temperature increases with faster cooling rates (Giordano et al., Reference Giordano, Nichols and Dingwell2005) and the Kīlauea Iki lava lake cooling rate was three orders of magnitude slower than even the central regions of the dykes studied here (Helz et al., Reference Helz, Clague, Sisson, Thornber, Poland, Takahashi and Landowski2014). The results of Honour et al. (Reference Honour, Holness, Partridge and Charlier2019b) show that 60 h is insufficient time for coarsening of the Fe-rich droplets to be a result of Ostwald ripening.
In the dyke centres, where cooling rates were slower and there was a higher proportion of interstitial liquid, the coarser droplet size may be a consequence of diffusive processes (either Ostwald ripening or droplet growth driven by chemical equilibration as the binodal widens down-temperature) and/or coalescence. Such diffusive processes are accelerated by a decrease in viscosity of the Si-rich immiscible liquid due to high volatile content, prior to degassing (Kohn, Reference Kohn2000). We do not see rapid increases in the Fe-rich droplet size across the dyke width (Table 3), as would be expected if droplet coarsening were driven by coalescence. Hence, we suggest that diffusion-controlled growth is the most probable coarsening mechanism, in agreement with the experimental results of Honour et al. (Reference Honour, Holness, Partridge and Charlier2019b), who show that droplet coalescence is negligible in rapidly quenched ferrobasaltic experiments.
Microstructures
In many natural examples of rapidly-cooled basaltic rocks containing evidence of immiscibility, the faces of plagioclase grains parallel with the long axis (e.g. (100) and (010)) and in contact with glass are not planar but are decorated with micrometre-scale pillar-like structures that are invariably enclosed by Fe-rich droplets of a slightly larger diameter (Philpotts, Reference Philpotts1981). Philpotts (Reference Philpotts1981) suggests that pillar formation post-dates the attachment of the Fe-rich droplets, with the droplet destabilising the planar crystal face due to local enhancement of plagioclase growth where mass diffusion is faster through the low-viscosity Fe-rich liquid. This hypothesis is supported by the enrichment of the pillars in elements with a low concentration in the Fe-rich immiscible liquid, such as Na, Al and Si (Honour et al., Reference Honour, Holness, Partridge and Charlier2019b). No plagioclase pillars are observed in our Northeast England dykes, which is surprising given that Fe-rich droplets are attached to plagioclase grains in all three intrusions. On the dyke margins, the cooling rate was >10°C/h, which is faster than in experimental studies and other natural samples where pillars have been observed (i.e. lava flows and lava lake crust; Charlier and Grove, Reference Charlier and Grove2012). One possibility is that observable pillars are absent in our samples from dyke margins because the plagioclase growth rate (~5 × 10–12 m/s; Kirkpatrick, Reference Kirkpatrick1977) was too slow to permit pillar development before the system cooled through the glass transition. However, this cannot explain the absence of pillars in the centre of the dykes where cooling rates were slower. An alternative explanation may be that the nucleation of the Fe-rich droplets on the plagioclase growth faces occurred too late in the growth history for significant pillar formation.
Conclusions
We conclude that:
(1) Plagioclase aspect ratios and grain sizes are consistent with the magma in the Tynemouth and Hartley North dykes being static, or only weakly convecting, during crystallisation.
(2) 1D thermal modelling assuming conductive heat transfer suggests that the Hartley North (1.03 m wide), Tynemouth (3.18 m wide) and Morpeth (<5.25 m wide) dykes took 5, 43 and <117 days to crystallise, respectively. This equates to cooling rates in the dyke centres between 0.1 and 1.7°C/h.
(3) The emulsion microstructure varies as a function of cooling rate, both between intrusions and within individual intrusions. Slower cooling rates and increasing size of interstitial melt pockets correlate with increasing Fe-rich droplet number density.
(4) Both the largest Fe-rich droplet size and the range of droplet sizes increase at slower cooling rates. The size of the largest droplets and the dyke cooling rate are related by the expression y = 84.681x –2.461. Hence, our study demonstrates that Fe-rich droplet size correlates with the cooling rate of igneous intrusions of similar compositions.
Acknowledgements
Many thanks to Brian Young and the late Henry Emeleus for advice on fieldwork localities. We are grateful to the Sedgwick Museum at the University of Cambridge for the loan of samples. We would like to thank Ilya Veksler and two anonymous reviewers for their thoughtful and constructive comments. We also wish to thank Giulio Lampronti and Iris Buisman at the University of Cambridge for assistance with SEM analyses. VCH was funded by a Natural Environmental Research Council Doctoral Training Programme studentship project (Grant Ref: NE/L002507/1) and MJS was funded by a Junior Research Fellowship at Christ's College, Cambridge.
Supplementary material
To view supplementary material for this article, please visit https://doi.org/10.1180/mgm.2019.71



