


Introduction
There are six recent publications on Antarctic resistivity surveys (Reference BentleyBentley 1977, Reference Anderson1979, Reference Bentley, Jezek, Blankenship, Lovell and AlbertBentley and others 1979, Reference Shabtaie and BentleyShabtaie and Bentley 1979, Reference Shabtaie, Bentley, Blankenship, Lovell and GassettShabtaie and others 1980, Reference Thyssen and ShabtaieThyssen and Shabtaie 1980). The sites of these and earlier Investigations, namely, Ross Ice Shelf, Roosevelt Island, McMurdo Ice Shelf, and Dome C, are cold, dry-surface environments. The present work was undertaken on the west side of the Antarctic Peninsula, an area far warmer than the other areas studied. The surface of George VI Ice Shelf undergoes extensive melting, leading to the formation of large melt-water lakes in summer (Reference ReynoldsReynolds 1981[b]).
This work was carried out along the line of an established survey network called the M scheme (71°55'S, 67°30'W, Fig.l), principally at two stake rosettes Juliet and K1lo, referred to hereafter as RJ1 and RK2, respectively. The main source of ice is Goodenough Glacier which flows towards Alexander Island from the Palmer Land plateau (Reference Bishop and WaltonBishop and Walton 1981), a dry-snow environment with mean annual air temperatures around -20°C. The remaining snow is derived from local precipitation much of which is saturated by melt water during the summer months (Reference ReynoldsReynolds 1981[b]).
The Antarctic Peninsula showing (a) the position of George VI Ice Shelf, (b) RJ1 and RK2, part of a stake network called the M scheme (dotted), which lie on a flow line (arrow) of Goodenough Glacier (after Bishop and Walton 1981).

Field measurements
A standard Schlumberger electrode configuration was used for all profiles. Current was provided by a bank of up to six 90 V dry cells. Stainless steel tubes 1 m in length and 19.05 mm in outside diameter were used as electrodes. To reduce the contact resistance the snow around the electrodes was soaked with a salt solution. The potential and current were monitored by Keithley 602B electrometers which have an input impedance (for voltage measurements) greater than 101* ohm. Plots of the mutual decay of voltage and current were obtained from the outputs of the electrometers on a Minigor 510 XY-Yt chart recorder. Calibration checks in the field showed that voltage and current displayed on the chart recorder were within ±2%.
One of the problems encountered was the presence of background electrical fields detected in the potential recording circuit. A quasi-static potential (Vb, up to 150 mV) was observed in the absence of an applied current. In addition, micropulsations were detected of the order of a few tens of millivolts in amplitude and at a frequency of 6 to 10 Hz. Lower frequency oscillations were also present. Although generally attributable to natural perturbations in the Earth's magneto-telluric field, some oscillations seemed to be more prevalent at times of high wind. This may be due to electrostatic charging of ground drift and/or wind-induced movement of the cables which were suspended at least 1 m above the snow surface. The varying level of background electrical noise was normally insufficient to stop measurements although at times it reduced their reliability. However, there were occasions when ground drift and blowing snow caused so much “white”noise that measurements were terminated.
Conduction of electricity in ice is by the movement of protons. They appear to be freely discharged from the ice at the cathode but become increasingly depleted at the anode. This results in an increased contact resistance and a reduction in current. When current is applied, the ground potential must decrease concurrently with the depletion of the applied current as Ohm's Law is obeyed in the bulk of the ice. The duration of the decay varied from about 10 s to several minutes, the latter being more common at large electrode spacings. It is this decay which was monitored in the experiments. Examples of the voltagecurrent decays can be seen in Figure 2.
Examples of voltage-current decay graphs. See text for further details.

In most cases, maximum voltage and current occurred when the circuit was closed, and both magnitudes decreased linearly with respect to each other (Fig.2(a)) and exponentially with time. At large electrode spacings, and especially when the decay took a couple of minutes, there was time for the background electric fields to change and a curve resulted instead of a straight line. Sometimes both background drift and a steady increase of current and voltage occurred at the same time. There were times when both the current and the voltage fluctuated simultaneously causing rapid oscillations along the normal decay line. This can be clearly seen in Figure 2(b). The normal decay occurred along AB whereupon the background potential increased producing the curve BC. Three small inclined lines can be seen originating from BC with similar gradients to that of AB. I f no zero drift occurs the V-I fluctuations are not distinct because they lie within the normal decay l i ne (AB in Fig.2(b)). The cause of these fluctuations could not be discerned, but i t is thought that it is not due to intermittent contact at the current electrodes.
The advantage of using a chart recorder in XY or Yt modes linked directly to either or both of the current and potential measuring systems is that data are recorded continuously rather than at discrete times. The value of the voltage-current data improves with the amount of information available especially when background potentials and micropulsations are present.
Data reduction
The linear slope of the decay of ground potential with current, according to Ohm's Law, determines a resistance R from which an apparent resistivity pas of the medium can be computed. This is derived s from a solution to Laplace's equation with two current sources in a semi-infinite homogeneous medium,

whereR = ∆V/∆I, and a and b/2 are the current and potential electrode half-spacings respectively.
Voltage-current graphs from the chart recorder were digitized and a linear regression analysis carried out. The gradient of the decay line R was substituted in Equation (1). In cases where the decay was too small to be reliable or micropulsations reduced the resolution, the mean ground potential ∇ and mean applied current ⊤ were used instead to determine a parameter R0 in place of ∆V/∆I, where
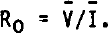
Figure 3 represents the various parameters which feature in the analysis. Vo is the potential extrapolated for zero applied current which on many occasions did not equal the background potential measured before (Vbl) and after (Vb2) the voltage-current response. The deviation is due essentially to variations in the natural t elluric potentials discussed earlier. The best estimate of the resistance R0' to be substituted in Equation (1) when the decay is small is given by

where Vb = (Vbl + Vb2)/2 is the mean background potential. As many sets of data were obtained at each electrode spacing for both normal and reversed current flow the arithmetic mean of all the non-spurious values of pas was taken as the true apparent resistivity value.sIts associated uncertainty was chosen to be the standard error of the mean. The main source of scatter, apart from telluric events, is caused by the variable condition of the snow surface. The best measurements were made on cold overcast days or at night.
Details of the statistical parameters used. The voltage-current decay measured is shown by the solid bar with gradient R. Lines with gradients R0 and R0 are also regression lines explained i n the text.

Results and interpretation
The apparent resistivity profiles have been interpreted using a BASIC computer program developed by Dr P Jackson (personal communication) based on Ghosh's convolution method for VES (Reference GhoshGhosh 1971). The program synthesizes an apparent resistivity profile for an n-layered model in which the variables are layer thickness and resistivity. Model profiles were compared with the field data and adjustments to the layering and resistivity values were made by trial and error to obtain as near correspondence as possible to the field data. However, in cases where a very good conductor, such as sea-water, underlies a relatively resistive layer, such as an ice shelf, Ghosh's method can produce inaccurate profiles because the Ghosh filter has too few coefficients to track a rapidly falling resistivity curve (Reference AndersonAnderson 1979, Reference Haines and CampbellHaines and Campbell 1980). Haines and Campbell (1980) have found that Ghosh's method produces spurious apparent resistivity curves if the conducting layer P2 has a resistivity less than around 1/20 that of the overlying medium PI i.e. a reflection coefficient K such that -1.0<K<-0.9, where K = (p2 - PI)/(P2 + PlK The jump in resistivity between two layers where K<-0.9 can be smoothed by introducing a series of thin layers of intermediate resistivity where each layer has a higher reflection coefficient. To check the validity of this, three apparent resistivity profiles were compared. Two were obtained using Ghosh's method, one being an ice shelf directly over sea-water and the other the same model except for the introduction of five extra layers of thickness 0.1 m with K = -0.8 between the ice shelf and sea-water to smooth the resistivity jump. The third was obtained from an exact expression for apparent resistivity for a two-layer case (Reference Telford, Geldart, Sheriff and KeysTelford and others 1976). The profile for the direct iceshelf /sea-water model produced a poor match whereas the profile from the smoothed model fitted the exact curve to better than 1%; the five extra layers have no physical significance and are put in solely to satisfy the condition that K>-0.9. Consequently the limitations of the Ghosh method have been overcome in a simple manner.
The apparent resistivity profiles illustrated in Figure 4 are consistent with the ice shelf being afloat on sea-water of oceanic salinity, resistivity 0.3 ohm m and indeterminate thickness. Increasing the thickness of sea-water to greater than 120 m (a value derived from seismic data) in the computer models has no effect on the apparent resistivity profiles over the range of electrode half-spacings used. To have the ice shelf afloat on sea-water does not preclude the possibility of the existence of a thin layer, perhaps several metres thick, of water of lower salinity below the ice-shelf base. There are two sources of fresh water. First, the base of the ice shelf is melting; Reference Bishop and WaltonBishop and Walton (1981) have estimated that there is an average basal melting rate of about 2 m a−1 in the vicinity of the M scheme. Secondly, during the summer, run-off from the glaciers of eastern Alexander Island and some of the fresh water in the surface melt-water lakes drains through the ice shelf, sometimes catastrophically (Reference ReynoldsReynolds 1981[b]). The only information that can be gleaned about the sub-ice water is that it has a low resistivity. A value of 0.3 ohm m, corresponding to a sea-water salinity of 35°/oo, has been used, based on measurements of sea-water salinity made at the northern ice front of George VI Ice Shelf (Reference Lennon, Loynes, Paren and PotterLennon and others 1982). The computed profiles at large separations deviate significantly from the field curves only when the water resistivity exceeds about 1000 ohm m, a value typical of low-salinity brackish water.
Log-log plots of apparent resistivity profiles versus electrode half-separation for RJ1 and RK2. The curves are computed profiles derived from computer models (depicted with layer resitivities x 10−4 ohm m beneath the graphs) which best fit the data (plotted with standard deviations).

Estimates of the thickness of the ice shelf obtained in 1976 and 1977 by sledgeborne radio echosounding (RES) were 336±10 m for RJ1 and 363±10 m for RK2 (A H W Woodruff personal communication). Initially ice thicknesses were determined solely from the interpretation of the apparent resistivity profiles (F1g.4) and were estimated to be 330±10 m and 370±10 m respectively, for the two sites. It is reassuring that the VES models do yield ice thicknesses within 5% of those obtained by RES. As the RES ice thicknesses are useful independent and accurate data, they have been incorporated as known parameters in all subsequent electrical resistivity modelling.
Figure 4 shows that for a<100 m the absolute value of resistivity differs~between the two profiles at each site. This difference is related primarily to surface conditions along the line of each array. For example, the ice-shelf surface was wetter for profile RK2-2, when pockets and pools of melt water were present within 1 m of the surface and much of the firn was saturated, than for RK2-1. Profile RJ1-3 was completed by mid-January 1980 while the surface was still comparatively dry. By the end of January 1980 melt was becoming more of a problem. For example, along the northern half of the RJ1-4 array, some of the electrodes had penetrated through several alternate bands of solid ice and firn, through an air gap several tens of millimetres wide and into a pond of water 150 mm deep between two solid ice layers. The effects of free water (resistivity 1.5 to 5 kohm m, as determined using a conductivity bridge) reduce the gross resistivity of permeable surface layers. In addition, seasonal and diurnal temperature fluctuations should affect the resistivity of surface layers. Whether or not a resistivity-temperature dependence exists for bulk Ice at a temperature greater than -10.C remains an open question; however the surface resistivity of ice decreases as the melting point is approached (Reference Maeno and NishimuraMaeno and Nishimura 1978). Some of the decrease in resistivity between profiles at the same site can be explained by a slight warming of the surface during the summer.
One of the alms of this work was to determine the extent to which the free water that forms on the surface of George VI Ice Shelf in summer and is subsequently refrozen affects the electrical properties of ice In a percolation/soaked zone. This has been discussed in part by Reference Reynolds and ParenReynolds and Paren (1980). The electrical results indicate that refrozen free water affects resistivity only Indirectly. The true resistivities at two sites on George VI Ice Shelf (Fig.4) and one on Ross Ice Shelf have been compared at depths of 10 m (PIO) and 100 m (PIOO)- At station BC on the Ross Ice Shelf, the ice-shelf density does not reach 0.9 Mg m−3 until a depth of about 50 m (Reference BentleyBentley 1977) and densification is primarily by compaction. Resistivity decreases between 10 and 100 m such that Pio/plOO equals about 8 (Reference BentleyBentley 1977). At RJ1 and RK2 there is a considerable range of densities within the top 10 m from 0.58 to 0.913 Mg m−3 (Reference Bishop and WaltonBishop and Walton 1981). At RJ1 there is a higher proportion of firn to Ice than at RK2. Some compact- Ion of firn layers occurs but densification is dominated by percolation and refreezing of melt water, so that PIO/P100 = 3. At RK2 tne flrn 1S soaked during the summer months and densification is almost exclusively by refreezing of melt water; PIO/PIOO ls tnen equal only to about 1.4. The ratio of resistivity (P10/PIQO) is tnus an an indication of the variation of density with depth. A large resistivity ratio implies low surface densities. A small resistivity ratio suggests a narrow range of density and that densification is affected by the percolation and refreezing of melt water.
For George VI Ice Shelf the resistivities obtained for ice at 100 m depth are within 4% of 48 kohm m; a steady-state temperature analysis such as that of Crary (1961) gives the temperature of 100 m depth to be around -10.C. At station BC on the Ross Ice Shelf, the resistivity at the same depth (temperature around -23.C) is within 10% of 70 kohm m (Bentley 1977). If temperature is taken into account by assigning an activation energy of 0.15 eV (Reference AndersonBentley 1979), the difference in resistivity between the two ice shelves is less than 10%, indicating that polar ice has a very narrow range of resistivity irrespective of the controlling densification mechanism and the source of ice. It is improbable that the two ice shelves have exactly the same impurity concentrations. Consequently the similarity of the resistivities between the two ice shelves also implies that ionic impurities and resistivity are not strongly related.
Figure 4also shows that there is an anisotropy of about 6% between the profiles parallel and perpendicular to the flow line at rosette Juliet. The differences between the two profiles at short electrode half-spacings (a<100 m) have already been explained In terms of changing surface conditions, whereas the difference at larger spacings probably has another explanation. A similar phenomenon has been reported by Bentley (1977, 1979) for half-spacings > 30 m for two sets of resistivity profiles on the Ross Ice Shelf, where he found a difference of 12%. The effect is probably physically significant but one can do no more than speculate as to its cause. Bentley (1977) discounted preferred c-axis orientation as being responsible and suggested that a conductivity anomaly at a few metres depth could perhaps be produced by a healed crevasse. Buried crevasses transverse to the ice flow which may have incorporated snow could provide the necessary higher resistance barrier.
Computed apparent resistivity profiles which do not take into account any variation of resistivity with temperature provide the best fit to the field data. For this reason I believe that the resistivity of solid ice at a temperature greater than -10*C is independent of temperature. Nevertheless, in the modelling technique, the effect of temperature on resistivity has been considered. Assuming that the ice shelf is in steady-state and has no lateral temperature gradient the analysis of Crary (1961) has been used to obtain a temperature profile through the ice shelf. From equation 3 of Crary (1961), the iceshelf temperature gradient Is proportional to

where  is the surface accumulation rate,
 the basal melting rate, h the depth, H the ice-shelf thickness, and α the thermal diffusivlty of 1ce. It is further assumed that resistivity p is related to temperature by the Arrhenius function

where E i s the activation energy (eV), k is Boltzmann's constant 8.62 × 10⁻⁵ eV K−1, and T the absolute temperature (K). From these assumptions it i s possible to obtain for each s i te a true-resist ivity / depth profile, each of which has been subdivided with aresistivity interval between adjacent layers of 2 000 ohm m. Each layer resistivity was then put into the Ghosh VES program in order to obtain an apparent resistivity profile. Realistic values were assigned for the surface and basal iceshelf temperature, thermal diffusivity, and accumul ation rate. Dominant parameters were found to be the activation energy E.in the Arrhenius equation and basal melting rate m. The coldest part of an ice shelf in steady-state with no lateral temperature gradients is the surface; on George VI Ice Shelf, the mean annual temperature i s between -7* and -10*C (Reference ReynoldsReynolds 1981[a]) and the base is at the freezing temperature of sea-water, -2.C. For such a temperature regime, and with resistivities determined by the modelling techniques, an Interpretation having a zero activation energy would be consistent with the findings of Camplin and others (1978). Nevertheless, models with an activation energy of 0.15 eV have been used; the fit tofield data Improved with increasing basal melting rate m, and estimates were obtained for minimum bottom melt rate ifim (Fig.5). The minimum basal melting rate still compatible with field data was m = 2 m a−1 for RJl-4, and 1 m a−1 for RK2-1. Shabtaie (personal communication) has used a computer model developed by Bentley (1977) to analyse the data from RK2. He assumed an activation energy of 0.25 eV, and obtained a basal melt rate of 1 m a−1.
On the remaining two profiles (RK2-2 and RJ1-3) best fits were obtained only if a layer electrically equivalent to a 5 m thick band of higher resistivity (250 to 300 kohm m) was included at the base of the ice shelf. This layer is not considered to have any physical significance for three main reasons. First, such a layer is not present on both profiles at each site. Second, the data at large electrode half-spacings for RK2-2 and RJ1-3 are not thought to be as reliable as data at equivalent spacings on the other two profiles (RK2-1 and RJl-4). Third, a high resistivity layer at the base of George VI Ice Shelf is difficult to explain glaciologically. Similar highresistivity basal ice layers have been suggested for various sites on the Ross Ice Shelf (Shabtaie and Bentley 1979) and Dome C (Thyssen and Shabtaie 1980). It is therefore plausible that this basal ice, dating to the Wisconsin (Thomas 1976, Lorius and others 1979) which is a period climatically distinct from the Holocene, has different electrical properties. But on Palmer Land where the ice is significantly thinner, it is inconceivable that sufficient Wisconsin ice exists to provide a similar explanation. There is independent evidence for a basal melt rate for George VI Ice Shelf of the order of 2 m a−1 (Bishop and Walton 1981, Lennon and others 1982). This requires the ice at the base of the ice shelf at rosette Juliet, which has been afloat for 175±10 a a (based on data from Bishop and Walton 1981) to have been within 150 m or so of the surface of the ice at the grounding line, i.e. 70% of the ice column has been melted away. There is no known glaciological mechanism able to compress the whole of the Holocene ice column into 100 m at the grounding line of Goodenough Glacier.
Computed apparent resistivity profiles showing the effect of changing basal melting rate m for RJ1-4 and RK2-1 in computer models with a basal temperature of -2° and an activation energy of 0.15 eV.

Conclusions
The gross resistivity of shallow permeable layers tends to be reduced by warm, wet surface conditions. The ratio of resistivities at depths of 10 and 100 m is an indication of the variation of density with depth; a ratio of 8 is typical of an ice shelf (e.g. Ross Ice Shelf) where compaction is the main mechanism of densification, while a smaller ratio (such as found at rosettes Juliet and Kilo on George VI Ice Shelf) suggests that densification is influenced by percolation and refreezing of melt water.
The bulk of the ice shelf, which lies within 5. to 8.C of its sea-water melting temperature, behaves as if it has either no resistivity-temperature dependence in this temperature range or a slight dependence (activation energy of 0.15 eV) requiring a minimum basal melting rate of 1 to 2 m a−1. Such a rate is consistent with oceanographic measurements made at the northern ice front (Lennon and others 1982) and with independent theoretical estimates from surface measurements (Bishop and Walton 1981). The resistivities of the ice at 100 m depth on George VI Ice Shelf differ by less than 10% from those at the same depth at station BC on the Ross Ice Shelf if an activation energy of 0.15 eV is assumed. This indicates that polar ice has a very narrow range of resistivity irrespective of the controlling densification mechanism. Seismic measurements made during 1980-81 by C S M Doake, about 12 km south of the M scheme, have yielded sea-water thicknesses of between 60 and 120 m which are taken as being reasonable estimates for water depths beneath the resistivity sites. Deep bedrock troughs to the west and to the east of RK2 have also been revealed by the seismic sounding. The apparent resistivity profiles are consistent with there being sea-water of oceanic salinity under the ice shelf.
Acknowledgements
I am grateful to Dr P Jackson for providing the BASIC computer program, and to Dr C Bentley and S Shabtaie for useful comments. This paper has benefited greatly from discussions with Dr J G Paren.



