I. Introduction
In a recent article, Holmes and Anderson (Reference Holmes and Anderson2017) report evidence of a general convergence in alcohol consumption patterns among countries, in terms of both total per capita consumption of alcohol, and the mix of beer, wine, and spirits in that total (see, also, Colen and Swinnen, Reference Colen and Swinnen2016; Anderson, Meloni, and Swinnen, Reference Anderson, Meloni and Swinnen2018). These studies of national alcohol consumption patterns provide both inspiration and a launching pad for the present study.
Among nations, the United States is one of the world's largest consumers of alcoholic beverages, but it is a physically large and culturally and economically diverse country. Simple analysis of state-level data reveals large and apparently persistent differences among U.S. states in terms of total per capita consumption of alcohol, and the mix (e.g., see Haughwout and Slater, Reference Haughwout and Slater2018). Representative consumers in most U.S. states drink more beer than any other form of alcohol, but they vary in terms of how much they drink and the extent to which they are specialized in beer drinking, and these differences are persistent, although not totally unchanging.
Using methods similar to those of Holmes and Anderson (Reference Holmes and Anderson2017), Fogarty and Voon (Reference Fogarty and Voon2018) analyzed trends in U.S. state-level per capital consumption of beer, wine, and spirits for the years 1972–2012. In brief, they concluded that “…from the early 1970s through the early 2000s, a pattern of convergence in both the level of consumption and the consumption mix was evident, but since the early 2000s, and unlike the pattern observed globally, there has been a reversal of this trend” (Fogarty and Voon, Reference Fogarty and Voon2018, p. 121). In our analysis of convergence using similar data and methods, we reach similar conclusions (Hart and Alston, Reference Hart and Alston2019).
As well as being interested in convergence, we are also interested in the lack of it. What accounts for the large and persistent spatial differences in U.S. alcohol consumption patterns nowadays, when markets are well integrated spatially, interstate trade barriers are comparatively small, and prices are similar across the nation (and, indeed, among countries)? A deeper understanding of the determinants of U.S. national consumption patterns on a finer spatial scale might also shed light on the international patterns.
The persistent spatial differences in consumption patterns appear to reflect differences in preferences among populations, which we explore by examining their links with socioeconomic and demographic characteristics of U.S. populations. We estimate econometric models of demand for beer and wine using scanner data from supermarkets, for 2006–2016. In these data we observe diverging trends within product categories. Market shares of higher-priced (craft) beer are growing, whereas shares of lower-priced (macro) beer are diminishing. We also see an increase in the share of higher-priced wine. The analysis yields useful estimates of elasticities of demand with respect to prices and income (or total expenditure), as well as plausible measures of differences in demand associated with various socioeconomic and demographic characteristics.
II. Spatial Patterns in Per Capita Alcohol Consumption and the Mix
We begin with a review of the differences in alcohol consumption among the 50 states (and the District of Columbia), and how those differences have been changing. Figure 1 presents box and whiskers plots of the state-level data, as five-year averages (seven-year average for 1970–1976), for the shares of total per capita consumption coming from beer, spirits, and wine (see Panel (a)), as well as total per capita consumption (see Panel (b)), for the period 1970–2016.Footnote 1 The plots in Panel (a) show considerable variation in average per capita consumption of ethanol across the states in each five-year interval, but suggest consumption per capita has converged somewhat across states while generally trending down. Comparing the plots for the 1970s and 1980s to the early 2000s reveals some decrease in the variance of consumption per capita. However, the plots in Panel (b) reveal more than a simple convergence in consumption patterns. Across the 40-year period, the national average share of beer rose and fell symmetrically; in the latter period, shares of both spirits and wine rose at the expense of beer. These plots also reveal a noticeable increase in the variance of beer and wine shares among states. Hence, although national alcohol shares among types of alcohol are becoming more equal, on average, the states may be diverging in terms of the extent to which they specialize in beer, spirits, or wine.
Consumption of Alcohol in U.S. States, Five-Year Averages, 1970 to 2016

What can account for these persistent differences among states? Candidate explanations include interstate differences in prices and income among consumers, differences in policies, and differences in tastes—some of which might be connected to the causes of the differences in policies and prices. In the context of international data, both Colen and Swinnen (Reference Colen and Swinnen2016) and Holmes and Anderson (Reference Holmes and Anderson2017) focus on differences in per capita income and prices paid by consumers as factors influencing per capita demands among nations. In our context, U.S. designated market areas (DMAs) play the role of nations, and we use county-level measures of per capita income, and DMA-level measures of prices.
While these conventional variables belong in any economic model of consumer behavior, prices and income alone are unlikely to account for the large and persistent differences in alcohol consumption we observe among U.S. DMAs. A more obvious answer for a non-economist might be cultural differences—we eat and drink in ways that our grandparents, parents, friends, and neighbors did because that is what they taught us to do; some tastes are acquired, some habits are persistent if not addictive, and we identify to some extent with the culture from which we came. If these aspects are important, in general and on average we would expect to observe Americans of, say, German descent drinking significantly more beer and less wine per capita, compared with other Americans of, say, Italian descent, holding other factors constant. In our analysis, we employ data on this aspect of the demographic structure of the population, which varies significantly among states, and among counties within them, in ways that could account for persistent spatial differences.Footnote 2
III. Demographic Influences on Demand for Alcohol: Data and Model
Scanner sales data from Nielsen are used in the estimations.Footnote 3 The data include close to two billion observations of store-level, UPC-specific, weekly sales totals covering thousands of brands of beer and wine for 270 metropolitan areas, or DMAs. The composition of the dataset by store-type is 76% grocery, 14% drug, 4% mass merchandiser, 4% convenience, and 2% liquor stores. Owing to differences across states in laws governing the sale of alcohol in stores, only grocery store sales data are used. The data are aggregated to DMA-specific monthly totals for three categories of beer (craft, macro, and imported), as well as three categories of wine (low-priced dry, high-priced dry, and other, where “dry” includes sparkling as well as still wine, and “other” includes sweet and fortified wine). The resulting data set for beer is an unbalanced panel consisting of 19,790 observations, across 181 DMAs and 120 time periods. For wine, the data set includes 19,985 observations, across 182 DMAs and 120 time periods.
In order to estimate elasticities that are conditional on total per capita expenditure on all goods, and not just expenditure on beer and wine, we implement a two-stage approach, as discussed by Edgerton (Reference Edgerton1997). For the first stage, which is not specifically of interest here, and not reported, we use estimates of a single-equation model of per capita demand for beer and wine with the variables in logarithmic differential form. In the second stage, we estimate a system of demand equations for sub-categories of beer and wine. We model demand for each category as a function of the prices of the six types of beverages, total expenditure on beer and wine, and various socioeconomic and demographic variables.
County-level data on ethnicity (the proportions of the population claiming different national ethnic origins for 2005–2009) and household income (annual observations) come from the United States Census Bureau American FactFinder (2018). These data are aggregated to the DMA level and then merged with the Nielsen scanner data. We compute the “ancestral” (predicted) rate of consumption of a particular alcohol type, in a particular DMA, by multiplying the proportions of residents in the DMA claiming ancestry from different nations, by the corresponding national rates of consumption of that alcohol type (during 1961–1964 from Holmes and Anderson, Reference Holmes and Anderson2017). We also include measures of population density (to capture rural versus urban influences), voting for Trump versus Clinton in the 2016 U.S. Presidential election (a crude proxy for various cultural attributes), and the Hispanic share of the population.
The models estimated can be thought of as belonging to the class of “differential demand systems,” perhaps best exemplified by the Rotterdam model (Theil, Reference Theil1965). Models like this are typically applied to time-series data, such that the logarithmic differentials (or, in practice, logarithmic differences for discrete-time data) are growth rates of variables. Here we are focused on differences among market areas associated with socioeconomic and demographic variables rather than differences within DMAs over time associated with prices. Hence, instead of modeling month-to-month differences within a DMA, we model differences relative to the mean for all DMAs, within a month.
IV. Demographic Aspects of Demand for Beer and Wine: Evidence from Scanner Data
We first estimate a single-equation logarithmic differential model of demand for total beer and wine as a function of price and income (i.e., expenditure on all goods) deflated by the CPI for all goods. Then we estimate systems of equations, specified using the Rotterdam model, to model the allocation of expenditure on both beer and wine across three categories of beer (craft, macro, and imported) and three categories of wine (low-priced dry, high-priced dry, and other). In these equations, to address endogeneity concerns such as those raised by LaFrance (Reference LaFrance1991), we use the predicted values of the Divisia volume index from the first-stage estimates rather than the directly computed values. Only DMAs with both wine and beer sales in grocery stores are included in the estimation.
Elasticities derived from the Rotterdam model for the system of six categories of beer and wine are reported in Table 1. Elasticities are computed at the means of the sample data, and the elasticities with respect to demographic demand shifters can be interpreted as the percentage change in demand for a product in response to a 1% increase of the demand shift variable relative to its mean. The own- and cross-price elasticities are computed mainly as a check on the performance of the model; we are primarily interested in the response to the demand shifters. Since we are modeling allocations of group expenditure, the Marshallian price elasticities in Table 1 are conditional on total expenditure on beer and wine.
Elasticities from the Rotterdam Model Estimated Using DMA-Level Data, 2006–2015

Notes: Marshallian price elasticities and expenditure elasticities, conditional on total beer and wine expenditure. Second-stage estimation. The asterisks *, **, and *** denote statistical significance at the 10%, 5%, and 1% levels, respectively.
Source: Created by the authors using sales data from Nielsen, election data from Github (2017), ancestry and population density from the United States Census Bureau American FactFinder (2018), and international consumption data from Holmes and Anderson (Reference Holmes and Anderson2017).
The model generally performs well, but because the expenditure share of “other wine” is very small, some of the corresponding elasticities and their standard errors in that equation are quite large, and some of the measured effects are not statistically significant—especially among the demographic factors. The own-price elasticities of demand are negative and elastic for each category, consistent with expectations and encouraging us to place some confidence in the performance of the model. The cross-price elasticities suggest that the three beer categories are substitutes for one another (with the exception of macro and imported beer), but we note a few complementarities between some categories of beer and wine, as well as between some wine categories. The estimated expenditure elasticities—reflecting allocation of increases in total expenditure on beer and wine among the six categories—are plausible magnitudes and ranked as expected with larger values for craft beer, import beer, high-priced wine, and other wine; these groups represent the premium categories, whereas macro beer and low-priced wine are the lower-end categories.
The elasticity with respect to the “Trump” variable indicates that, in regions where Trump had greater voter support in the 2016 Presidential election, consumers tend to demand more macro beer, but less of everything else. The responses to the ancestral preference variables are generally consistent with expectations, but with some small surprises in terms of the effects on demand for imported beer and high-priced wine. An increase in the ancestral preference for beer is associated with a decrease or no change in demand for all categories of wine and an increase in demand for macro and craft beer, but a decrease in demand for imported beer. An increase in the ancestral preference for wine is associated with an increase in demand for low-priced wine and a decrease in demand for macro beer, but also increases in demand for craft and imported beer and a decrease in demand for high-priced wine. The increase in the demand for imported beer associated with an increase in the Hispanic share of the population probably reflects a demand by people with Mexican antecedents for the many popular beers imported from Mexico. On average, compared to urban, rural residents tend to drink more. The population density variable suggests that representative consumers in more urban areas demand more high-priced wine and imported beer, but less craft beer and less low-priced wine.
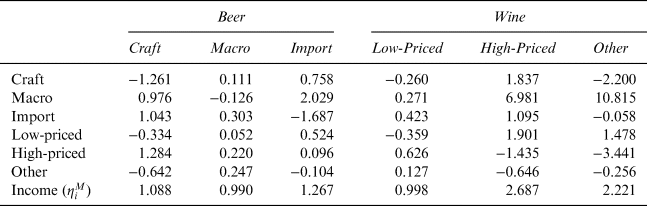
Elasticities of demand for each type of beer and wine with respect to income (total expenditure on all goods) and with respect to prices conditional on income, combining the first-stage estimates with the second-stage estimates from Table 1, are reported in Table 2. These policy-relevant elasticities are intuitive.
Marshallian Price and Expenditure Elasticities, Conditional on Total Expenditure

Notes: Marshallian price elasticities and expenditure elasticities, conditional on income. Calculated from first- and second-stage estimates.
Source: Created by the authors using sales data from Nielsen, election data from Github (2017), ancestry and population density from the United States Census Bureau American FactFinder (2018), and international consumption data from Holmes and Anderson (Reference Holmes and Anderson2017).
V. Conclusion
Alcohol consumption patterns in the United States are associated with enduring socioeconomic and demographic characteristics of the population. Total alcohol consumption and shares among sub-categories of beer and wine differ significantly among populations and regions across the country, and persistently. Our findings suggest that even after people immigrate to the United States their ancestral beverage preferences persist to some extent and are passed on to their descendants to some extent. Our analysis using spatially disaggregated data on subcategories of beer and wine reveals insight into the relationships between alcohol consumption and socioeconomic characteristics of populations.