I. INTRODUCTION
Tungsten (W) has been chosen as the plasma facing material in the divertor of ITER due to its high thermal conductivity, high melting point, and low erosion rate.Reference ’t Hoen, Balden, Manhard, Mayer, Elgeti, Kleyn and Zeijlmans van Emmichoven1–Reference Pitts, Carpentier, Escourbiac, Hirai, Komarov, Lisgo, Kukushkin, Loarte, Merola, Sashala Naik, Mitteau, Sugihara, Bazylev and Stangeby3 Another advantage of using W is that the tritium retention is very low,Reference Fan, You, Ni, Yang, Liu, Benstetter, Liu and Liu2,Reference Roth, Tsitrone, Loarte, Loarer, Counsell, Neu, Philipps, Brezinsek, Lehnen, Coad, Grisolia, Schmid, Krieger, Kallenbach, Lipschultz, Doerner, Causey, Alimov, Shu, Ogorodnikova, Kirschner, Federici and Kukushkin4 which is important for the operational safety and efficiency. Experiments have revealed that severe loading conditions with plasma (e.g., high fluxes of deuterium, helium, and neutron particles) could lead to strong surface modifications of W,Reference Fan, You, Ni, Yang, Liu, Benstetter, Liu and Liu2,Reference Shu5–Reference Kolasinski, Cowgill, Donovan, Shimada and Wampler8 resulting in dramatic degradation of thermal and mechanical properties of the material. Recent studies using the linear plasma device PSI-2Reference Kreter, Brandt, Huber, Kraus, Möller, Reinhart, Schweer, Sergienko and Unterberg9,Reference Akhmetov, Davydenko, Ivanov, Kreter, Mishagin, Savkin, Shulzhenko and Unterberg10 to expose W sample to deuterium (D) with transient heat loads have revealed severe surface damage, suggesting an effect of hydrogen embrittlement of W.Reference Wirtz, Bardin, Huber, Kreter, Linke, Morgan, Pintsuk, Reinhart, Sergienko, Steudel, De Temmerman and Unterberg11
Hydrogen embrittlement has been widely recognized and extensively studied in many metals. The presence of hydrogen in material systems such as steels,Reference Robertson, Sofronis, Nagao, Martin, Wang, Gross and Nygren12,Reference Pundt and Kirchheim13 Fe–3 wt% Si,Reference Hajilou, Deng, Rogne, Kheradmand and Barnoush14 and FeAlReference Deng, Hajilou, Wan, Kheradmand and Barnoush15 impairs the material properties by lowering the strength and ductility and enhances the failure of them. However, hydrogen embrittlement of W in hydrogen-rich environment has not been similarly studied, though the retention of hydrogen (deuterium, D) in W after D plasma exposure has been reported.Reference Alimov and Roth6,Reference Yamagiwa, Nakamura, Matsunami, Ohno, Kajita, Takagi, Tokitani, Masuzaki, Sagara and Nishimura16–Reference Tanabe19 Some recent studies have focused on the mechanical properties of W exposed to D plasma using nanoindentation,Reference Fan, You, Ni, Yang, Liu, Benstetter, Liu and Liu2,Reference Terentyev, Bakaeva, Pardoen, Favache and Zhurkin20,Reference Zayachuk, Armstrong, Bystrov, Van Boxel, Morgan and Roberts21 which is a favorable technique for probing the near-surface properties, due to the fact that the plasma is usually confined to the near-surface region with a D implantation depth of several nanometers and a D diffusion depth of several micrometers.Reference Zayachuk, Armstrong, Bystrov, Van Boxel, Morgan and Roberts21
However, in those studies, some contradictory results are found regarding the hardness change of W materials after D plasma exposure. For instance, by using nanoindentation, Terentyev et al.Reference Terentyev, Bakaeva, Pardoen, Favache and Zhurkin20 and Zayachuk et al.Reference Zayachuk, Armstrong, Bystrov, Van Boxel, Morgan and Roberts21 reported an increased hardness after D exposure up to 1000 and 2000 nm depth, while Fan et al.Reference Fan, You, Ni, Yang, Liu, Benstetter, Liu and Liu2 measured a drop of nanohardness from 7.7 to 6.6 GPa after D radiation.
In this work, we used indentation to study the mechanical response of W subjected to D plasma exposure. After the plasma exposure, indentation tests were conducted on plasma exposed W sample and reference sample without plasma exposure at different desorption times. The pop-in phenomenon corresponding to the dislocation nucleation and onset of plasticityReference Gerberich, Nelson, Lilleodden, Anderson and Wyrobek22 was studied to elucidate the D effect on dislocation nucleation. The hardness change was also compared to clarify the contradiction in the literature.
II. EXPERIMENTAL PROCEDURE
A. Material and sample preparation
Polycrystalline tungsten samples (purity 99.97 wt%, Plansee SE, Breitenwang, Austria) were prepared by grinding, polishing down to 1 μm diamond suspension, followed by using colloidal silica suspension for 20 min. Then, the samples were annealed for 30 min at T = 1873 K in vacuum to achieve an average grain size of about 100 μm and to reduce the dislocation density. The surface morphology before and after plasma exposure was characterized using atomic force microscopy (AFM, Veeco Digital Instruments, Plainview, New York, DI3100S-1).
B. Exposure of deuterium plasma
Deuterium exposure was performed using the PSI-2Reference Kreter, Brandt, Huber, Kraus, Möller, Reinhart, Schweer, Sergienko and Unterberg9,Reference Akhmetov, Davydenko, Ivanov, Kreter, Mishagin, Savkin, Shulzhenko and Unterberg10 located at the Forschungszentrum Jülich, Jülich, Germany. The surface temperature of the sample was measured to be T ≈ 443 K. The incident ion energy was ∼35 eV, which is well below the threshold of about 90 eV required to initiate atomic displacement in W.23 The maximum ion flux was 4.5 × 10²¹ m−2/s and the accumulated fluence of the D plasma was calculated to be F = 8.1 × 1025 m−2. The concentration profile of D in the exposed sample will later be discussed in Sec. III in the analysis.
C. Nanoindentation tests
Nanoindentation tests on the exposed and reference samples were carried out using an Agilent G200 nanoindenter (Keysight Technologies, Santa Rosa, California). Both samples were mounted on the same holder using crystal bond. The indentation tests were carried out using a Berkovich diamond tip with the continuous stiffness measurement.Reference Terentyev, Bakaeva, Pardoen, Favache and Zhurkin20 The maximum indentation depth is 1000 nm. For each set of test, 12 indents spaced by 30 μm were performed. The tip was calibrated on a reference W sample using the Oliver–Pharr method.Reference Oliver and Pharr24 Tests on different grain orientations were also performed to examine whether the grain orientation would have an effect on the pop-in load.
The study of D retention in W using ion beam analysis suggests that the concentration of D in W after plasma exposure decreases as the time after exposure increases.Reference Watanabe, Kaneko, Matsunami, Ohno, Kajita and Kuwabara17 Thus, tests were carried out at room temperature at different desorption times after exposure (i.e., t d = 4 h, 24 h, 168 h, and 500 h) to investigate the influence of decreasing D concentration on the mechanical properties of W. Note that the 500 h desorption time includes a 12 h vacuum storage (∼10−6 mbar) of the sample to assist the desorption of the D from the exposed W sample.
III. RESULTS AND ANALYSES
A. Surface characterization before and after exposure
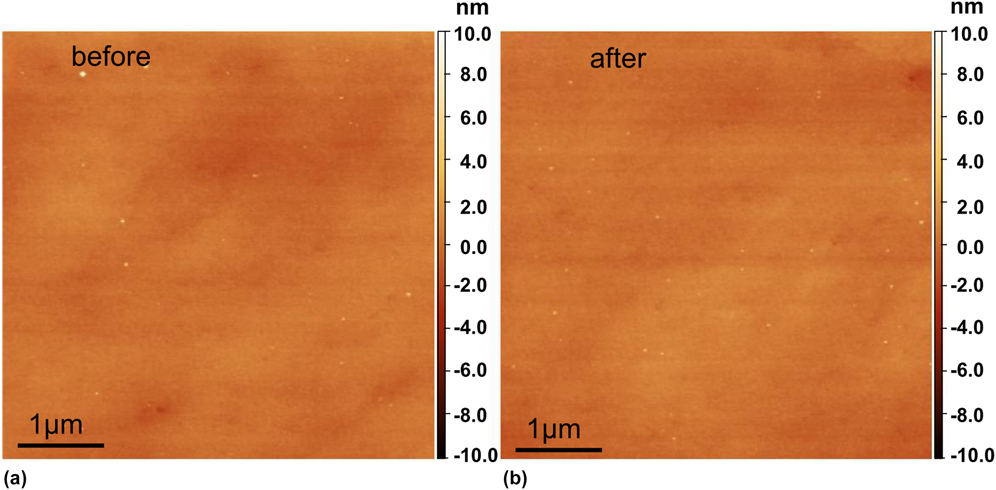
Figure 1 shows the surface morphology before and after plasma exposure. For the purpose of comparison, the AFM measurements in Figs. 1(a) and 1(b) were carried out in the same region using a surface marker. An average roughness less than 1 nm before and after exposure was measured. The comparison shows that the surface morphology of the sample remains identical. No blisters or surface bubbles due to D implantation were observed.
AFM measurement of the same area on the sample surface before (a) and after (b) D plasma exposure showing identical surface morphology and surface roughness. A scan size of 5 × 5 μm and a scan rate of 0.5 Hz was used.

B. Effect of deuterium on pop-in load: dislocation nucleation
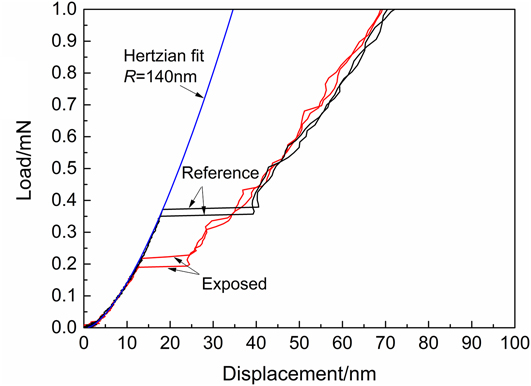
Figure 2 shows the representative load–displacement curves for the exposed and reference samples tested at a desorption time of t d = 4 h. A drop of the pop-in load on the exposed sample is observed. Based on the Herztian contact model, the radius of the Berkovich indenter tip is fitted to be R = 140 nm using the elastic portion from the load–displacement curve. A lower pop-in load indicates easier dislocation nucleation beneath the indenter after W has been exposed to D. In the present experiment, we assume the dislocation nucleation is homogenous within the bulk sample. Homogeneous dislocation nucleation occurs at the site below the tip where the maximum shear stress is achieved. The value of this maximum shear stress, τmax, can be calculated according to JohnsonReference Johnson25:
 $${\tau _{\max }} = 0.31{\left( {{{6E_{\rm{r}}^2} \over {{\pi ^3}{R^2}}}P} \right)^{{1 / 3}}}^{}\quad ,$$
where E r = 322 GPa is the reduced Young’s modulus of the W sample/diamond indenter system,Reference Bahr, Kramer and Gerberich26 R is the tip radius, and P is the pop-in load.
Representative load–displacement curves at t d = 4 h showing decreased pop-in load for the exposed sample compared to the reference sample. The Hertzian fit of the elastic segment gives a tip radius R = 140 nm.

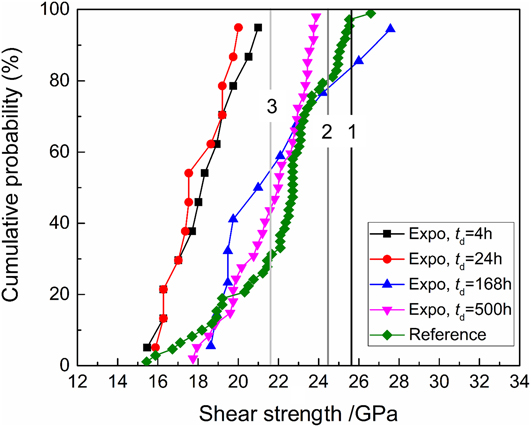
The maximum shear stress (later denoted as shear strength) was calculated using Eq. (1) for all indentations on the exposed and reference samples tested after different desorption times, and the statistical distribution (cumulative probability) is shown in Fig. 3. For tests at t d = 4 h and t d = 24 h, the shear strength of the exposed sample is lower than that of the reference sample. As desorption time increases to t d = 168 h and t d = 500 h, the shear strength exhibits a trend to recover to that of the reference sample. Note that the slope of the cumulative probability curves in Fig. 3 is almost identical, suggesting that the homogeneous dislocation nucleation is mainly activated for both exposed and reference samples.
Cumulative probability of the shear strength of the reference sample, and exposed sample after different desorption times. Black vertical line-1 indicates the theoretical shear stress (25.6 GPa) calculated by τth = G/2π. Dark grey line-2 indicates the mean value of the maximum shear stress (24.5 GPa) obtained by Vadalakonda et al.Reference Vadalakonda, Banerjee, Puthcode and Mirshams27 Light grey line-3 indicates the mean value of the maximum shear stress (21.6 GPa) calculated by Roundy et al.Reference Roundy, Krenn, Cohen and Morris28.

For further comparison, the theoretical shear stress (25.6 GPa) calculated by τth = μ/2π was plotted in Fig. 3 (indicated by the vertical line-1, black), where the shear modulus μ = 161 GPa is adopted for W. The vertical line-2 (dark grey) indicates the mean value of the maximum shear stress (24.5 GPa) obtained by Vadalakonda et al.Reference Vadalakonda, Banerjee, Puthcode and Mirshams27 using nanoindentation on polycrystalline W. The vertical line-3 (light grey) indicates the mean value of the maximum shear stress (21.6 GPa) calculated by Roundy et al.Reference Roundy, Krenn, Cohen and Morris28 based on the nanoindentation experiments on single crystal W (100).
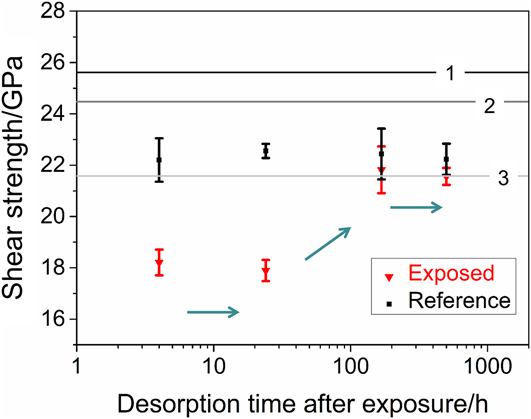
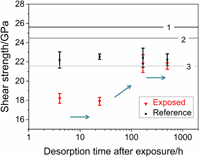
The mean values of the shear strength at the onset of plasticity after different desorption times are further displayed in Fig. 4. The mean shear strength for the dislocation nucleation in the reference sample is ∼22 GPa, while for the exposed sample it drops to ∼18 GPa (t d = 4 h, 24 h). The mean value of our experiment on the reference sample falls within the results given by Vadalakonda et al.Reference Vadalakonda, Banerjee, Puthcode and Mirshams27 and Roundy et al.,Reference Roundy, Krenn, Cohen and Morris28 as shown in Fig. 4. The mean values for dislocation nucleation for the exposed sample gradually reach that of the unexposed reference sample after t d ≥ 168 h. The recovery of the shear strength of the exposed W sample to the reference state shown in Figs. 3 and 4 suggests that (i) no severe surface damage was induced during the plasma exposure under the current exposure condition, which is consistent with the AFM characterization of the sample surface in Sec. III.A and (ii) the decrease of the shear strength at shorter desorption times (t d = 4 h and 24 h) is caused by the presence of D.
Shear strength at the onset of plasticity after different desorption times for exposed (triangles) and reference (squares) samples. Error bar is calculated using standard error of the mean. The arrows indicate the recovering trend as desorption time increases. Lines 1–3 indicate the values given in Fig. 3.

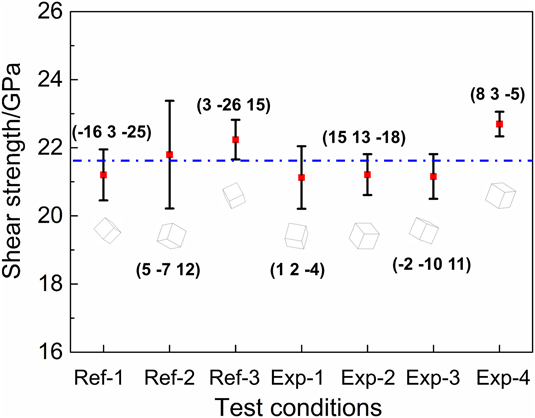
To exclude a possible effect of grain orientation on the lower shear strength of the exposed samples, the effect of grain orientations on the shear strength was investigated. We carried out three tests on the reference sample (noted as Ref-1, 2, and 3 in Fig. 5) and four tests on exposed sample (noted as Exp-1, 2, 3, and 4 in Fig. 5) after a desorption time of t d = 500 h, namely, tests were carried out on seven grains, each with a different grain orientation. Note that the results in Fig. 5 at t d = 500 h including 12 h vacuum treatment (under this condition, the D concentration in the exposed sample can be regarded negligible) again confirm the recovery trend to the reference state, as shown in Figs. 3 and 4. The dashed line in Fig. 5 indicates an average value of 21.7 GPa from all seven tests. Compared to this average value, a maximum 3.6% difference among all seven orientations is calculated. This small difference suggests that a grain orientation effect on the shear strength is negligible for W.
Grain orientation effect on the shear strength for the reference sample (Ref-1, 2, and 3) and the exposed sample (Exp-1, 2, 3, and 4). The four data sets for the exposed sample are acquired after a desorption time of t d = 500 h including a 12 h vacuum treatment.

The decrease of the shear strength due to D exposure suggests that the presence of D facilitates the dislocation nucleation in W. This observation is consistent with the experiments on austenitic stainless steel,Reference Barnoush, Asgari and Johnsen29 Fe–3 wt% Si,Reference Barnoush and Vehoff30 and vanadium (100) single crystal samplesReference Tal-Gutelmacher, Gemma, Volkert and Kirchheim31 using in situ electrochemical charging of hydrogen. According to the defactant theory proposed by Kirchheim,Reference Kirchheim32,Reference Kirchheim33 the presence of D reduces the formation energy of defects, e.g., dislocations in the present case.
Classic dislocation theory predicts that the free energy,ΔG, required for homogeneous dislocation nucleation of a circular dislocation loop with radius r under a uniform shear stress τ is given by
 $$\Delta G = 2\pi r{\gamma _{{\rm{dis}}}} - \pi {r^2}b\tau \quad .$$
In Eq. (2), the elastic self-energy, γdis, of a full circular dislocation loop in an infinite isotropic elastic solid is given byReference Hirth and Lothe34
 $${\gamma _{{\rm{dis}}}} = {{2 - \nu } \over {1 - \nu }}{{\mu {b^2}} \over {8\pi }}\left( {\ln {{4r} \over \rho } - 2} \right)\quad ,$$
where b is the Burges vector, μ = E/2(1 + ν) is the shear modulus, E is the Young’s modulus, ν is the Poisson’s ratio,  $\rho = {b \over {2\alpha }}$ is the cutoff parameter of the order of core dimension, and α = 2 is adopted according to Hirth and Lothe.Reference Hirth and Lothe34 By combining Eqs. (1)–(3), it yields
 $$\Delta G = {{2 - \nu } \over {1 - \nu }}{{\mu {b^2}r} \over 4}\left( {\ln {{4r} \over \rho } - 2} \right) - 0.31{r^2}b{\left( {{{6E_{\rm{r}}^2} \over {{R^2}}}P} \right)^{{1 / 3}}}\quad .$$
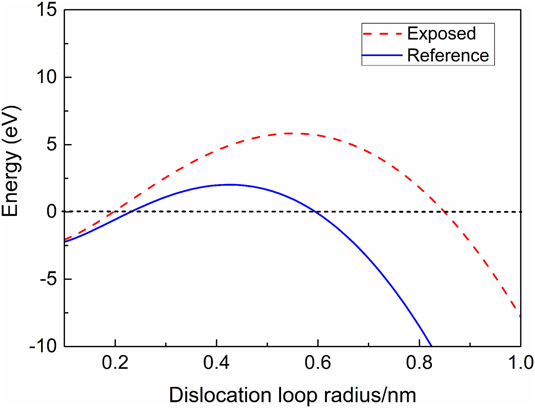
For W, the values of b = 0.274 nm, E r = 322 GPa, E = 411 GPa, ν = 0.28 are adopted. In Fig. 6, the free energy plotted against the dislocation loop radius using Eq. (4) is shown for the case without D and for the case after D exposure. Notice that the curve after D exposure is higher than that without D exposure, which is due to the drop of the pop-in load P after D exposure according to Eq. (4). Following this observation and to overlap the two curves in Fig. 6, γdis has to be reduced in the case after D exposure since γdis is the only variable that could be affected by D.Reference Barnoush, Asgari and Johnsen29 This energy reduction facilitates easier dislocation nucleation and can be explained by the defactant model.Reference Kirchheim35 A similar effect of hydrogen on dislocation nucleation was observed by Barnoush et al.Reference Barnoush, Asgari and Johnsen29 for austenitic stainless steel, and by Tal-Gutelmacher et al.Reference Tal-Gutelmacher, Gemma, Volkert and Kirchheim31 for vanadium (100) single crystal.
Free energy ΔG for homogeneous dislocation nucleation as a function of dislocation loop radius for exposed and reference conditions according to Eq. (4).

Following the treatment of Kirchheim et al.,Reference Kirchheim35 one can further derive the relation between γdis and the critical load P c for a pop-in as
 $${\gamma _{{\rm{dis}}}} = 0.31{\left( {{{3E_{\rm{r}}^2{b^3}r_{\rm{c}}^3} \over {4{\pi ^3}{R^2}}}} \right)^{{1 / 3}}}{P_{\rm{c}}}^{{1 / 3}}\quad ,$$
where r c is the critical radius corresponding to a maximum free energy ΔG. Notice that r c, E r, b, and R are all constant in Eq. (5), thus a reduction in the pop-in load by a factor of 1.85 (i.e., P D-free/P D = 0.37/0.2 = 1.85, see Fig. 2) corresponds to a decrease in γdis by ∼20%. This reduction is consistent with the previous evaluation using the curves in Fig. 6. In addition, the value of γdis in the presence of D can be estimated using Eq. (5). In the presence of D, it yields  $\gamma _{{\rm{dis}}}^{\rm{D}} = 1.7 \times {10^{ - 9}}{\rm{J/m}}$, while for the unexposed reference sample, the equation yields γdis = 2.1 × 10⁻⁹ J/m. The estimated values of dislocation line energy for W are at the same magnitude with that of vanadium (100) single crystal samples that were electrochemically doped with different hydrogen concentrations within the α-phase.Reference Tal-Gutelmacher, Gemma, Volkert and Kirchheim31
C. Effect of deuterium on modulus and hardness: dislocation mobility
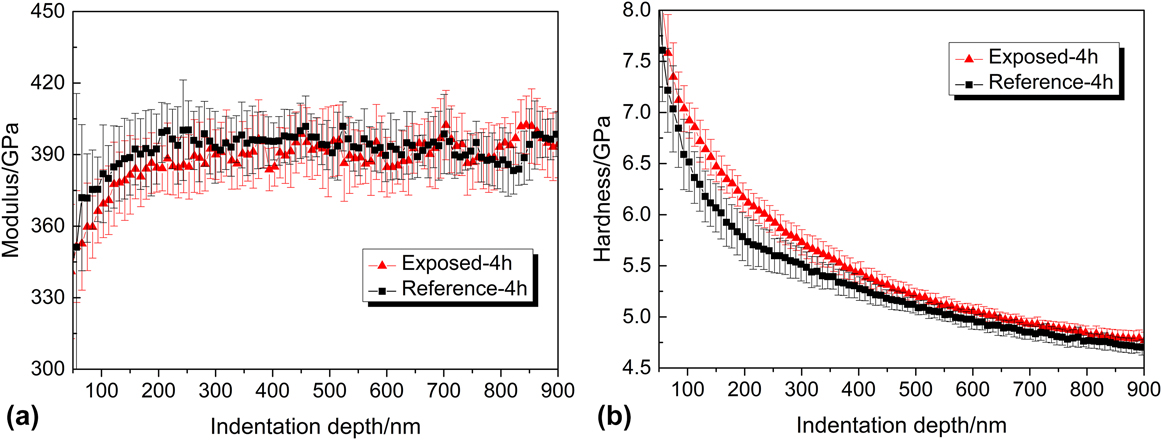
The indentation results show that modulus for both exposed and unexposed reference W samples is identical within the error bars, with a typical representation shown in Fig. 7(a) for t d = 4 h. The negligible change of the modulus could be attributed to the globally unchanged bonding of W even if some solute D atoms are in the W lattice. The hardness at indentation depths of 100–400 nm is slightly elevated for the D exposed sample. Such an increase of the hardness is consistent with the experimental results from Terentyev et al.Reference Terentyev, Bakaeva, Pardoen, Favache and Zhurkin20 and Zayachuk et al.Reference Zayachuk, Armstrong, Bystrov, Van Boxel, Morgan and Roberts21 Note that in our case, the hardness also tends to recover to the reference state after a longer desorption time t d ≥ 168 h, which is analogous to the above discussed recovery of shear strength.
Comparison of (a) modulus and (b) hardness of exposed (triangles) and reference (squares) samples after t d = 4 h. The results shown here are averaged over 12 indents for each test condition.

The increase of the hardness at shallower indentation depth shortly after exposure [Fig. 7(b)] is assumed to be caused by the presence of D since the D exposure is the only variable. Two mechanisms that possibly act simultaneously are proposed to explain the hardness increase.
First, due to the easier nucleation of the dislocations in the presence of D, more dislocations can be nucleated in the exposed sample during the indentation. The multiplication and interaction of these dislocations could result in forest hardening. As a primitive estimation to correlate the hardness increase with the increase of total dislocation in exposed sample during the nanoindentation test, we adopt here the expression of hardness given by Nix and Gao,Reference Nix and Gao36 which was formulated based on the Mecking–Kocks relationship,Reference Mecking and Kocks37 the von Mises flow rule, and the Tabor’s relationship:
 $$H = 3\sqrt 3 \alpha \mu b\sqrt {{\rho _{\rm{T}}}} \quad ,$$
where α is a constant, μ is the shear modulus, b is the Burgers vector, and ρT is the total dislocation density. Assume Eq. (6) still holds for the sample exposed with D, there is
 $${H_{\rm{D}}} = 3\sqrt 3 \alpha \mu b\sqrt {\rho _{\rm{T}}^{\rm{D}}} \quad ,$$
where H D and  $\rho _{\rm{T}}^{\rm{D}}$ are the hardness and the total dislocation density after D exposure, respectively.
Comparing Eqs. (6) and (7), there is
 $${{\rho _{\rm{T}}^{\rm{D}}} \over {{\rho _{\rm{T}}}}} = {\left( {{{{H_{\rm{D}}}} \over H}} \right)^2}\quad .$$
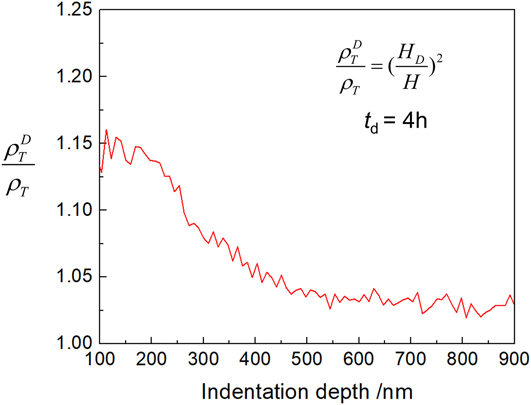
Equation (8) indicates that the hardness increase can be correlated with an increase in total dislocation density after D exposure, which agrees with the above discussion based on the defactant theory that dislocations are more easily to be nucleated in the presence of D. Based on Eq. (8) and the hardness data shown in Fig. 7(b), we can plot the ratio of total dislocation density after D exposure compared to the reference state along the indentation depth. An increase of ∼15% of the total dislocation density approaching the near-surface region at an indentation depth of h = 100 nm is calculated, as shown in Fig. 8. However, it should be noted that such a small change in dislocation density is usually within the error limits of experimental methods such as electron channeling contrast imaging and transmission electron microscopy, and thus not or hardly measureable.
Ratio of total dislocation density after D exposure compared to the reference state along the indentation depth according to Eq. (8). Hardness data are obtained from tests after t d = 4 h.

Second, it is also possible that the dislocations were pinned by the presence of D atoms in W lattices and thus resulted in hardness increase. Retention studies by Baldwin et al.Reference Baldwin, Doerner, Wampler, Nishijima, Lynch and Miyamoto38 using thermal desorption spectrometry and Zayachuk et al.Reference Zayachuk, Manhard, t Hoen, Jacob, Zeijlmans van Emmichoven and van Oost39 using nuclear reaction analysis showed that under similar exposure to the present experiment, the retained concentration of D was in the order of 0.1–1 at.% in the near surface region (<1 μm). The motion of the multiple dislocations may be hindered due to solute D atoms, resulting in a higher hardness. It should be noted that up to now, it remains still a challenging topic to accurately measure the D concentration in the exposed W sample. However, the semiquantitative depth profiling of DReference Zayachuk, Manhard, t Hoen, Jacob, Zeijlmans van Emmichoven and van Oost39 after exposure suggests a higher D concentration in the near surface region, and the spatial decrease of D concentration along the depth is in general consistent with the drop of the increased hardness indicated by Fig. 7(b), suggesting that the nonlinear hardness increase may be caused by the D concentration gradient along the depth.
IV. CONCLUSION
The pop-in study and hardness analysis based on nanoindentation tests on the W sample exposed with D plasma and unexposed reference W sample reveal that the presence of D evidently affects the dislocation nucleation, suggesting hydrogen embrittlement of W due to D plasma exposure. The following conclusions are drawn:
(1) The presence of D results in a lower pop-in load and lowers the shear strength at the onset of homogenous dislocation nucleation from ∼22 to ∼18 GPa. This observation is explained by the defactant theory that the presence of D reduces the dislocation line energy and thus promotes the homogenous dislocation nucleation in W.
(2) The presence of D results in a maximum increase of ∼0.5 GPa in hardness. This could be caused by (i) increased dislocation forest hardening due to easier dislocation nucleation in the presence of D and/or (ii) the pinning effect of solute D atoms that impedes dislocation motion.
(3) Tests after a long desorption time of t d ≥ 168 h reveal that the mechanical properties of the exposed W sample are recovered, suggesting that the D exposure in the present experiment is not sufficient to cause irreversible surface damage.
V. DATA AVAILABILITY
The raw/processed data required to reproduce these findings cannot be shared at this time as the data also form part of an ongoing study.
ACKNOWLEDGMENT
Financial support from Alexander von Humboldt Foundation is gratefully acknowledged.