




No CrossRef data available.
A MONTE CARLO STUDY ON THE SELECTION OF COINTEGRATING RANK USING INFORMATION CRITERIA
Published online by Cambridge University Press: 22 April 2005
Abstract
We conduct Monte Carlo simulations to evaluate the use of information criteria (Akaike information criterion [AIC] and Schwarz information criterion [SC]) as an alternative to various probability-based tests for determining cointegrating rank in multivariate analysis. First, information criteria are used to determine cointegrating rank given the lag order in a levels vector autoregression. Second, information criteria are used to determine the lag order and cointegrating rank simultaneously. Results show that AIC has an advantage over trace tests for cointegrated or stationary processes in small samples. AIC does not perform well in large samples. The performance of SC is close to that of the trace test. SC shows better large sample results than AIC and the trace test, even if the series are close to nonstationary series or they contain large negative moving average components. We also find evidence that supports the joint estimation of lag order and cointegrating rank by the SC criterion. We conclude that information criteria can complement traditional parametric tests.We are grateful to Peter C.B. Phillips and an anonymous referee for their comments, which significantly improved the paper.
Information
- Type
- Research Article
- Information
- Copyright
- © 2005 Cambridge University Press
1. INTRODUCTION
Cointegration of time-ordered observational data has received considerable attention in the past decade. Various procedures have been proposed in the literature to determine cointegrating rank. They include single equation methods such as the Engle–Granger residual-based test (Engle and Granger, 1987) and the ECM test of Kremers, Ericsson, and Dolado (1992). Recently, empirical researchers have relied more on multiple-equation or system-based methods, for example, the principal components test of Stock and Watson (1988), Johansen (1988, 1991), and the likelihood ratio test of Ahn and Reinsel (1990) based on canonical correlation analysis.
Because these parametric test procedures are probability-based, they are likely to have problems of low power and size distortions when, for example, errors (innovations) are not independent and identically distributed (i.i.d.) or the series are close to nonstationary ones. Podivinsky (1990), Cheung and Lai (1993), Toda (1995), Haug (1996), and Gonzalo and Pitarakis (1999) provide simulation evidence that these tests may either over- or underspecify cointegrating rank, especially in small (finite) samples. An alternative to the preceding parametric procedures is to consider various information criteria (IC) in determining rank restrictions. This application of the model selection approach was first suggested and implemented in Phillips and McFarland (1997). For practical purposes, model specification ultimately involves a trade-off between model parsimony (complexity) and fit, given the fact that the true model is rarely, if ever, known. As various IC take into account both model fit and parsimony, they have become increasingly important tools for specifying models; in particular, they now have a rich history in selecting lag order in both univariate and multivariate modeling. Because the determination of cointegrating rank is essentially a model specification problem just like the lag order selection, it is quite natural to consider IC in the determination of cointegrating rank (Phillips, 1996).
An advantage of IC over traditional probability-based test procedures in determining rank order is that researchers are exempt from first having to select an “appropriate” significance level to implement a test procedure. Although a 5% (or perhaps a 10%) significance level is “traditionally” chosen as a benchmark, such a choice may generate concerns. For example, Maddala and Kim (1998, ch. 6) suggest that researchers should be more conservative in testing for a unit root, that it may be better to use the 25% level instead of the 5% level. Furthermore, to many empirical researchers, as argued by Maddala and Kim, the goal of cointegration tests is not to uncover the true number of cointegrating relationships per se but rather to have a useful guide in imposing restrictions on vector autoregression (VAR) models and error correction models (ECM) that may lead to more efficient estimation and improve forecasting performance (p. 233). When forecasting performance of a model is of interest, clearly both fit and complexity have to weigh in at the same time.
Another attractive feature of using IC is that it allows researchers to conduct cointegration analysis within a single step, instead of a two-step procedure. As is well known, the choice of lag order in a VAR has an important impact on the cointegration test performance (e.g., Boswijk and Frasnes, 1992). However, because choices of lag order and cointegrating rank are two separate steps in application of the trace test and other probability-based procedures, it is essentially impossible to comment on the underlying probability distribution of the final results. In contrast, it is possible to determine the lag order and cointegrating rank in one step by minimizing an IC over a domain of models with different lag orders and cointegrating ranks.
Phillips (1996) formally shows how cointegrating rank, lag length, and trend degree in a VAR can be jointly determined using the model selection method. Gonzalo and Pitarakis (1998) evaluate both the theoretical and applied properties of the model selection approach for the estimation of the cointegrating rank given lag orders in the models. Aznar and Salvador (2002) establish the consistency of a general IC that includes the Schwarz information criterion (SC) as a special case. Kapetanios (2004) recently derived the asymptotic distribution of the cointegrating rank estimator based on the Akaike information criterion (AIC). He shows that the estimator is inconsistent, a result similar to that found when AIC is used as a tool for lag order selection. For the purpose of model specification in a (partially) nonstationary framework, researchers have also proposed other IC. For example, extending the analysis of Phillips and Ploberger (1996), Chao and Phillips (1999) show the consistency of the posterior information criterion (PIC) in the joint determination of cointegrating ranks and VAR lag order. They also provide Monte Carlo evidence that shows that PIC performs at least as well and sometimes better than SC and AIC. On the empirical side, Phillips and McFarland (1997) use the SC criterion to jointly estimate the lag order and cointegrating rank in the VAR analysis of the Australian exchange market. Wang and Bessler (2002) apply a similar procedure in studying U.S. meat demand systems.
The goal of this paper is to provide more comprehensive evidence on the performance of the model selection approach (IC) in cointegration analysis. We conduct three Monte Carlo simulations. The design of the first simulation borrows from Toda (1995). Here we provide evidence on the performance of the two widely used IC procedures, SC and AIC, in testing the cointegrating rank when the lag order of the VAR is known. In the second simulation, employing a data generating process (DGP) used by Haug (1996) and others, we evaluate the performance of IC in determining the lag order and cointegrating rank simultaneously. These two DGPs allow us to investigate the test performance under a great variety of model specifications, including moving average components, closeness to a unit root, correlation between innovations, and so on. The third simulation evaluates the use of IC in a larger, five-variable system. Throughout the paper, we pay special attention to the small sample performance of the approach, as it is probably more relevant to many macroeconomic series (the sample size considered by Gonzalo and Pitarakis, 1998, and Chao and Phillips, 1999, is at least 150).
For comparison purposes, we also examine the performance of Johansen's trace test, which is chosen for its current popularity in empirical applications.1
Johansen's likelihood ratio test can be implemented in two forms. In this study, we will use his trace test statistic. Because the alternative maximum eigenvalue test has similar power to the trace test, it is not examined here.
The paper is organized as follows. Section 2 briefly discusses the basic model, the trace test statistic, and the AIC and SC formulas. Section 3 reports the first Monte Carlo simulation results. The design and results of the second experiment are summarized in the fourth section. Section 5 offers a real life example and simulation results corresponding to it. A short summary concludes the paper.
2. THE MODEL AND TEST STATISTICS
The basic model is an m-dimensional VAR model. Using conventional notation, the model can be described as

where zt is an m × 1 vector of time series, zt−1,…zt−p, are 1 up to p lags of zt, εt are i.i.d. random variates following multivariate N(0,Σ) with Σ being positive definite, A1,…,Ap are conformable parameter matrices, and μ is an m × 1 vector of parameters. The error correction form of (1) is

with
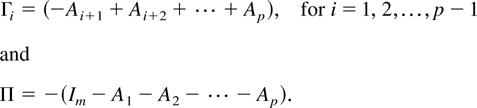
The hypothesis of cointegration in the vector process zt can be formulated as testing the rank of the Π matrix (Johansen, 1988, 1991). When the null hypothesis is that the cointegrating rank is r, the trace test statistic (λtr) is given by
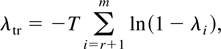
where r is the cointegrating rank order and λi is the ith largest eigenvalue related to the Π matrix. The sequential tests start from the null hypothesis r = 0 (namely, all eigenvalues are 0's). If this hypothesis is rejected, one continues to test r ≤ 1 and stops testing the first time the hypothesis is not rejected or after r ≤ m − 1. For 0 < r < m, zt is a cointegrated process; otherwise, it is nonstationary if r = 0 (or stationary if r = m). The asymptotic distributions of the trace statistic are affected by the assumption on the time trend in the process. If the constant in (2) is restricted to the cointegration space, the process contains a stochastic trend. If it is unrestricted, then the process contains both a linear time trend and a stochastic trend. Although other assumptions on the time trend have also been considered (Johansen, 1996), these two are used most often in applied studies.
The small sample correction for the preceding test statistic proposed by Johansen (2000, 2002) is of Bartlett type. The idea is to approximate the expectation of the likelihood ratio test statistic and to thereby correct it to have the same mean as the asymptotic distribution. The correction factor depends on moments of functions of the random walk and functions of the parameters. The exact formulas and coefficients necessary to compute the factor can be found in Johansen (2002).
We examine the performance of two widely used IC in the simulations: AIC (Akaike, 1973) and SC (Schwarz, 1978).2
We also investigated PIC as recently discussed in Chao and Phillips (1999). Using the approximation given in their equation (20), we find our Monte Carlo results on PIC close to those discussed here for SC. Results are available from the senior author.


where

is the maximum likelihood estimate of the variance-covariance Σ of the innovation (εt's) and K is the number of free parameters in the model, which, other things being equal, increases with the lag order (p) and the cointegrating rank (r) assumed in the model. The first term in equations (4) and (5) is the log determinant of

, which measures lack of fit of the model. The second term penalizes overparameterization of the model. It is clear from (4) and (5) that SC punishes model overparameterization more than AIC for sample sizes equal to or larger than eight.
Clearly, the IC method and the trace test are closely related. They both condition on the feature of matrix Π. The trace test detects the rank of Π by testing the statistical significance of the eigenvalues related to Π. The IC method determines cointegrating rank by balancing the benefit and cost of adding additional restriction vectors (cointegrating vectors) to the model. Specifically, if Π has rank r, it may be written as the product of two matrices: Π = αβ′, where α and β are of dimension m × r. We may regard β′zt−1 as r linear restrictions/combinations on right-hand-side variables zt−1. If a restriction is true, it must carry some useful information to explain the variation in the left-hand-side variables zt. The more significant the restriction is (correspondingly, the larger the associated eigenvalues of Π), the more information it can convey. If the restriction is true, the useful information it contains should be enough to offset its cost (introducing more parameters to the model). IC would accept the restriction in this case. If, on the other hand, the restriction is insignificant or false, the information it carries cannot offset the cost; IC would reject the addition of such a restriction.
3. MONTE CARLO SIMULATION I
In this section, we investigate the sampling properties of AIC, SC, and two forms of the trace test in determining the cointegrating rank of model (1) assuming the lag order is known. To this end, Toda (1994, 1995) shows that, without loss of generality, we can study a “canonical form” model.3
To make our results directly comparable to the relevant parts of Toda (1995) for this simulation, and those of Haug (1996) for the second simulation, we deliberately use the same notations to specify the DGPs as their corresponding sources. Thus, the same parameters (e.g., ψ and θ) do not have the same meaning in the two simulations. Defining them in two sections separately, we hope to minimize the confusion caused by this abuse of notation.

where the dimensions of wt, w1,t, and w2,t are m, r, and (m − r), respectively, δ is a nonnegative scalar, em−r = (0,…,0,1)′ is an (m − r)-dimensional vector, all eigenvalues of Ψ lie inside the unit circle, and finally,

Clearly, the subvector process w1,t is stationary and w2,t is nonstationary. They are correlated by a matrix Θ. The process w2,t also contains a linear deterministic trend unless δ = 0. Following Toda (1995), we consider a bivariate VAR(1). There are three possibilities in regard to the cointegration relations of DGP (6).
First, if r = 0, that is, (6) contains only nonstationary components, then model (6) simplifies to

and εt ∼ i.i.d. N(0,I2). In (7), the only parameter is δ.
Second, if r = 1, (6) becomes a cointegrated process with the following explicit form:

where |ψ| < 1 and |θ| < 1.
Third, if r = 2, (6) becomes a stationary process

where εt ∼ i.i.d. N(0,I2) and Ψ is further assumed to be diagonal
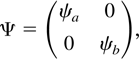
where |ψa| < 1 and |ψb| < 1.
In this and the next simulation, we examine the IC performance for four sample sizes: 30, 50, 100, and 200. The number of replications for each sample size is 5,000. Following tradition, for each replication we generate an additional 50 random observations to eliminate start-up effects. Toda (1995) explicitly considers the impact of starting values of wt on the test performance. It is clear from his reported results that the relative performance of the trace test does not change significantly for three different sets of starting values. To save space, and also to follow tradition, we only report the simulation results using w0 = 0 in all cases.
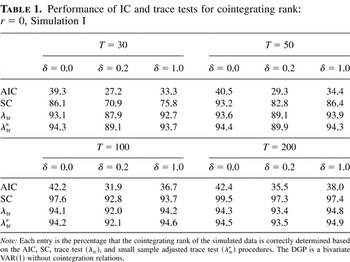
The results reported in Table 1 are based on DGP (7), a nonstationary process without cointegration relations (r = 0). Each entry is the percentage of times the four test procedures, AIC, SC, trace test (λtr), and the small sample adjusted trace test (λtr*) of Johansen (2002), correctly determine the cointegrating rank of the simulated data.4
The actual output contains more specific information on what exact model (r = 0, 1, or 2) is chosen. To save space here we only report the success ratio for each test, namely, the percentage that models with r = 0 are chosen in the case of Table 1.
Performance of IC and trace tests for cointegrating rank: r = 0, Simulation I

The performance of SC improves considerably when the sample size increases. For example, when T = 50, the frequencies with which it correctly identifies the rank are 93.2%, 82.8% and 86.4% when δ = 0.0, 0.2, and 1.0, respectively. At T = 100, the success ratios of SC are all larger than 90% for the different values of δ. When the sample size further increases to 200, SC almost always finds the correct rank (99.5%) in the case of δ = 0. In models with a linear trend, the percentages are also high, 97.3% or higher. In contrast, the change in sample size has little impact on AIC, which confirms that SC is consistent whereas AIC is not.
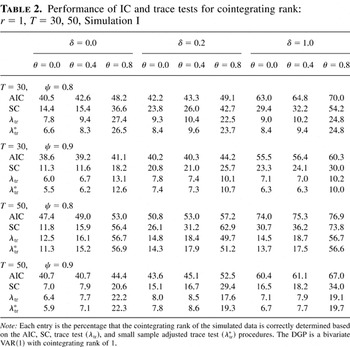
Using DGP (8), we examine the performance of the four procedures when the true model is a bivariate cointegrated process with r = 1. We use following parameter values in the simulations: δ = 0.0, 0.2, and 1.0, ψ = 0.8 and 0.9, and θ = 0.0, 0.4, and 0.8 (results based on negative θ are omitted because they are very close to their positive counterparts). Table 2 contains the simulation results for two small sample sizes, T = 30 and 50. Clearly, all four procedures perform poorly in small sample sizes. In models with θ = 0.0 and δ = 0.0, namely, no correlation between the stationary and nonstationary components and no linear trend, λtr makes the correct rank choice only 7.8% of the time (the small sample correction actually leads to slightly worse performance, 6.6%). The success ratio of SC is higher but still low (14.4%). AIC performs best in this case. When the two component series are more closely related (larger θ), the performance of all procedures improves. The frequencies that SC and λtr find correct rank, when θ = 0.8, increase to 36.6% and 27.4%, respectively. The presence of a linear trend in the data appears to have different impacts for IC and the trace tests. Compared to the results when δ = 0.0, the performance of SC when δ = 1.0 improves considerably (29.4% vs. 14.4%), whereas AIC's performance also increases to 63.0%. The numbers remain small for both λtr and λtr* (9.0% and 8.4%). As in the model with δ = 0.0, the test power increases for larger correlation (θ = 0.8 and δ = 1.0). And SC (54.2%) still leads the trace tests (24.8%).
Performance of IC and trace tests for cointegrating rank: r = 1, T = 30, 50, Simulation I

The second part of Table 2 repeats the preceding simulations with the autoregressive coefficient further approaching 1 (ψ = 0.9). Not surprisingly, all four test procedures are less powerful, as the stationary component is now closer to a nonstationary component. In the case of δ = 1 and θ = 0.8 (the rightmost column), SC concludes with zero or two unit roots 70.0% (100% − 30.0%) of the time, even if the true model has only one unit root, whereas the trace test is more likely to err (about 90%). Correcting for small sample bias does not help.
The results in the third and fourth sections of Table 2 are based on the slightly larger sample size of 50. In general, all procedures, especially SC, λtr, and λtr*, perform better when ψ = 0.8 in the DGP. The improvement is obvious for θ = 0.8. The procedures λtr and λtr* now have similar power as SC in models without linear trends. Nevertheless, at this sample size, AIC and SC are still better choices than are the trace tests when a linear trend is present (δ > 0). Comparing the results in the fourth section with the second section, we find that the increase of T from 30 to 50 does not lead to much improvement on performance for any of the four tests if ψ = 0.9 with the exception of θ = 0.8.
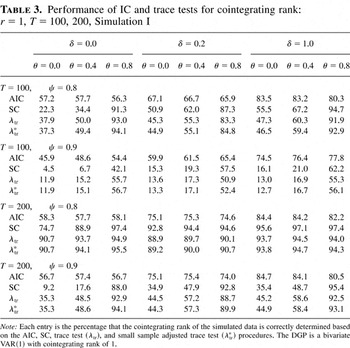
Results in Table 3 are also based on DGP (8) using a moderate sample size of 100 and a larger size of 200. When T = 100, both λtr and λtr* outperform SC in the model with δ = 0.0 but are outperformed by the latter if δ ≠ 0.0. Although the performance of AIC is primarily affected by δ, the correlation coefficient θ is an important factor in determining the performance of SC, λtr, and λtr*, given ψ. For example, when θ = 0.0 or 0.4, and ψ = 0.8, all procedures perform poorly, even when the sample size is 100. In contrast, all perform quite well when the two innovations are strongly correlated. The low power of the test procedures against large ψ is still evident when T = 200. If ψ = 0.8, all four procedures perform well, except AIC in the models with δ = 0. When ψ = 0.9, the performance of SC, λtr, and λtr* deteriorates significantly (lower than 60%) in models with low correlations. These three procedures perform equally well (around 90%) when θ = 0.8; in other cases, λtr and λtr* outperform SC. Notice in the fourth section of the table (ψ = 0.9) that the power of SC is extremely low when δ = 0.0 and θ is small, even at the sample size of 200 (9.2% and 17.6% for θ = 0.0 and 0.4, respectively). In additional simulations we conducted (not reported in detail here), only when the sample size increases to 400 does the ratio increase to 52% and 76.1%. These percentages increase to 79.1% and 93.4% when T = 500.
Performance of IC and trace tests for cointegrating rank: r = 1, T = 100, 200, Simulation I

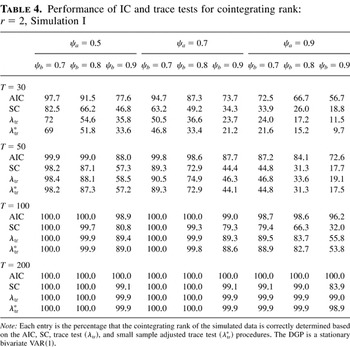
Table 4 contains simulation results assuming the DGP is a stationary process (equation (9)). The parameters that affect the distribution of the test statistics in this model are the two autoregressive coefficients, for which we use ψa = 0.5, 0.7, and 0.9 and ψb = 0.7, 0.8, and 0.9. In small samples, AIC performs much better than SC, λtr, and λtr*. SC outperforms λtr and λtr* when T = 30 but does not outperform them when T = 100. The later three procedures perform similarly when T = 50. As before, the power of the procedures decreases as the series considered approach nonstationary processes (ψa and/or ψb approaches 1). For example, there is a high probability (about 70%) that SC, λtr, and λtr* conclude that the DGP (9) is nonstationary, without cointegration relations, when T = 50 and ψa = ψb = 0.9 (not reported in the table). Finally, if T increases to 200, all procedures work well even for ψa = ψb = 0.9 (the lowest score is SC's 83.9%).
Performance of IC and trace tests for cointegrating rank: r = 2, Simulation I

We end the discussion of the first simulation by noting that the trace test tends to perform quite well for the cases where the DGP is of full rank (r = 2). This is not surprising, as Johansen (1992) has shown analytically that the probability of overestimation of rank does not go to zero if a fixed significance level is used in the sequential trace tests. However, in the full rank DGP (r = m), it is impossible to have overestimation in the trace test, which helps explain the good performance of the trace tests in this model. Similarly, as mentioned in the Introduction, AIC is also inconsistent and overestimates the cointegrating rank. This explains why AIC does quite well for models with r = 2 although performing poorly in other cases.5
We thank an anonymous referee for the suggestion to add the discussion in this paragraph.
4. MONTE CARLO SIMULATION II
As discussed in the Introduction, both the lag order determination and the test of cointegration relations in a multivariate model relate to model specification. In the preceding simulations, we have assumed that the lag order of the DGP is known, which is rarely true in empirical studies. When the lag order is unknown, the practice is to determine the lag order first using either IC or sequential likelihood ratio tests. In the second stage, a parametric test such as λtr is used to determine the cointegrating rank conditional on the lag order chosen in the first stage. In this section, we examine the performance of AIC and SC when they are used to determine the lag order and the cointegrating rank simultaneously. For the purpose of comparison, we also implement the two-step procedure to the new DGP. The new DGP again includes two series: yt and xt. Specifically, the DGP is described by the following equations:

Many researchers have used DGPs similar to (10). A short list includes Banerjee, Dolado, Hendry, and Smith (1986), Engle and Granger (1987), Blangiewicz and Charemza (1990), Hansen and Phillips (1990), Gonzalo (1994), and Haug (1996). To examine the impact of the model parameters on the test performance, we use the following values in the experiments: a1 = (0, 1), ρ = (0.1, 0.3, 0.5, 0.7, 0.85, 0.9, 0.95, 1), θ = (−0.8, −0.5, −0.25, −0.1, 0.0, 0.1, 0.25, 0.5, 0.8), and η = (−0.8, −0.5, −0.25, −0.1, 0.0, 0.1, 0.25, 0.5, 0.8). Because, unlike other cointegrating rank tests, both the IC and trace tests do not depend on the standard deviation of the second innovation process φt, σ, we fix it at σ = 1. Nor, in the case of equation (10), do results depend on whether xt is weakly exogenous (a1 = 1) or endogenous (a1 = 0) to the system.
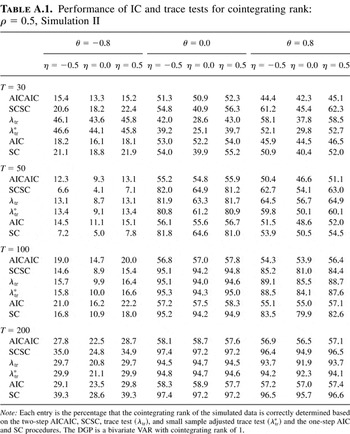
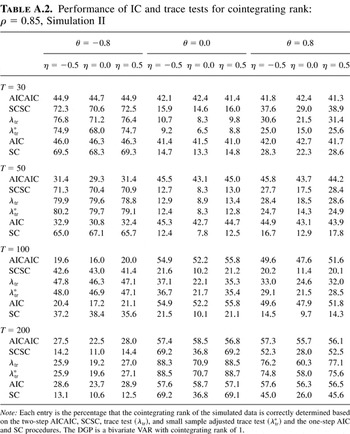
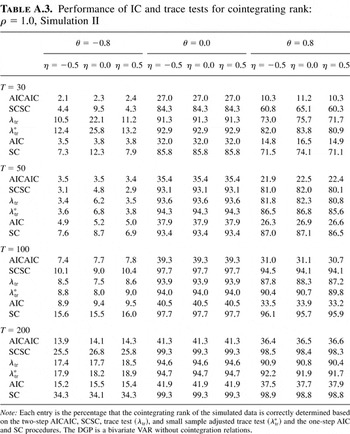
As before, all basic simulations are conducted for four different sample sizes, 30, 50, 100, and 200. Tables A.1, A.2, and A.3 summarize the major results for ρ = 0.5, 0.85, and 1.0, respectively. In each section, we report the performance of four two-stage procedures and two one-step procedures. After using AIC or SC to determine the optimal lag order of VARs in the first stage, we use the same criterion in the second stage to determine cointegrating rank. Denote this two-step procedure by AICAIC and SCSC, respectively (they correspond to the notations AIC and SC used in Simulation I). We denote the procedures λtr and λtr* that use the trace and small sample adjusted trace test to determine the cointegrating rank with lag order chosen by SC in the first stage. Here, we simply use AIC and SC to denote, respectively, the one-step procedures that use AIC and SC to simultaneously determine the lag order and cointegrating rank.
Figures 1, 2, and 3 are graphical presentations of the simulation results for two sample sizes (T = 50 and 200). Because the performances of λtr and λtr* are very similar, and the one-step AIC performs slightly better than the two-step AICAIC for almost all parameters and sample sizes, we only compare in each figure the performances of SCSC, λtr, AIC, and SC.

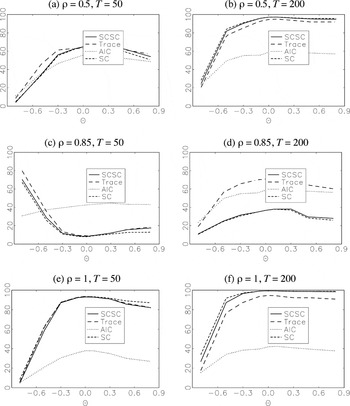
Performance of IC and trace tests for cointegrating rank with different values of θ (given η = 0), Simulation II.

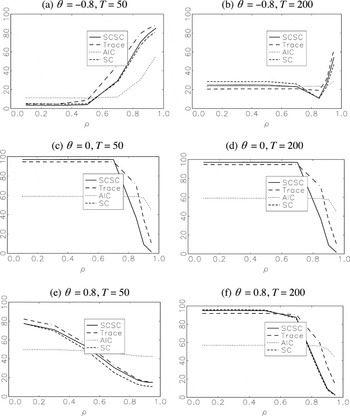
Performance of IC and trace tests for cointegrating rank with different values of ρ (ρ < 1) (given η = 0), Simulation II.

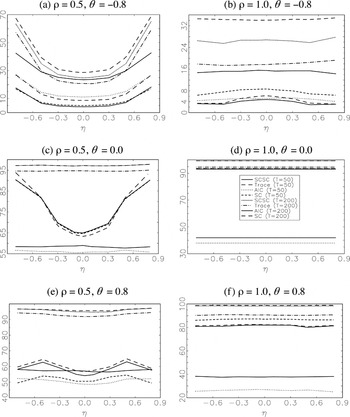
Performance of IC and trace tests for cointegrating rank with different values of η, Simulation II. The legends in graphs (a), (b), (c), (e), and (f) are the same as those in (d). For ease of reading, they are omitted.
In Figure 1, we examine the impact of the parameter θ on the test performance while fixing η at 0.0 and ρ at three values: 0.5, 0.85, and 1. First, we discuss Figures 1a and 1b. The DGP is a cointegrated process with a moderate value on ρ(0.5). When there is a large negative moving average component (θ = −0.8) in the DGP, all four procedures perform poorly. The percentages of correct choices on rank are only 4.1%, 8.7%, 11.1%, and 5.0% for SCSC, λtr, AIC, and SC, respectively, when the sample size is small (50). The performances do not improve significantly if the sample size increases to 200 (Figure 1b).
It is clear from Figure 1a that as θ gets larger, all four procedures perform better, although AIC improves relatively slowly. When the magnitude of the moving average component θ is small in the DGP, the procedures perform best (around 60%). When a large and positive θ is involved, the performances also deteriorate but are still better than when θ is large and negative. The procedure λtr performs better than both SCSC and SC with θ being large in magnitude, whereas it is outperformed by the latter two for small θ (in absolute values). The two-step SCSC performs slightly better than the one-step SC for all θ values except θ = −0.8. AIC is better than SC only for θ < 0.5. When T increases to 200, SCSC, λtr, and SC can correctly find the rank in 90% or more of the cases, unless the DGP has a large and negative moving average component. In contrast, AIC's performance always falls below 60% for all θ. The one-step SC performs slightly better than the two-step SCSC over the entire range of θ, although the difference is smaller for θ near or at zero. The percentages for both procedures are also slightly higher than those of λtr. Nevertheless, considering that the significance level of 95% is used for the λtr test, their performances can be labeled as similar.
Results summarized in Figures 1c and 1d are also based on a cointegrated DGP with rank 1, but here the process is closer to a nonstationary one without cointegrations (ρ = 0.85). In this case, all procedures are less powerful than they are in the models with ρ = 0.5 (Figures 1a and 1b) for corresponding model parameters. The exception is that all test procedures perform much better when θ = −0.8 for sample sizes smaller than 100. Also note in Figure 1c that SCSC, λtr, and SC perform worst when θ is around 0, which is the opposite of the pattern found in Figure 1a. Figure 1d shows that the performances of the model selection approaches, SCSC and SC, appear more sensitive than the trace test to the magnitude of ρ (especially when the correlation between the innovations η equals zero, as in the graphs). For example, when θ = 0.8, λtr's performance decreases from 91.9% in Figure 1b where ρ = 0.5 to 60.3% in Figure 1d with ρ = 0.85. At the same time, SC's performance decreases from 95.7% to only 26.0%. In contrast, the impact of changing ρ from 0.5 to 0.85 on AIC is quite small. AIC also performs better than SCSC and SC for most θ values.
When ρ = 1, DGP (10) is a nonstationary process without cointegration relations. Figures 1e and 1f summarize the cointegration test performances of the four procedures under this assumption. First, the two graphs show that SCSC, λtr, and SC are much more powerful when the true model is a nonstationary process without cointegration than for the cointegrated process summarized in Figures 1a–d if the model contains either no moving average or positive moving average components. Second, the one-step SC consistently performs better than the two-step SCSC, especially for large values of θ when T = 50. SC also outperforms λtr when T = 200.
Figure 2 offers more details on how the test performances change over parameter ρ by fixing θ at −0.8, 0, and 0.8. Here, the DGP is cointegrated with rank 1 (0 < ρ < 1). For θ = −0.8 (Figures 1a and 1b), the power of all four procedures in finding correct rank is low for small or moderate ρ values. Performances improve when the DGP is closer to a nonstationary process (ρ approaches 1). When T = 50, AIC performs best, followed by SC, λtr, and SCSC in order, for ρ = 0.1 and 0.3. However, for larger ρ, λtr is the best procedure. When the sample size is large (200), the one-step SC finds the rank most accurately for ρ up to 0.7. As Figures 1c and 1d, SCSC, λtr, and SC work quite well for small ρ when θ = −0.8 and 0. This is true even if the sample size is only 50 (Figures 2c and 2e). The performances of SCSC, λtr, and SC quickly deteriorate as ρ gets larger. When ρ > 0.7, all tests perform poorly, even if T = 200, although λtr does better than SCSC and SC.
So far in both Figures 1 and 2, we have maintained the assumption that fundamental innovations in the DGPs are not correlated (η = 0). Figure 3 provides evidence on whether the test performances also vary with η. First, the U-shaped patterns in Figures 3a, 3c, and 3e indicate that, for the cointegrated process, all procedures perform better when the fundamental innovations are correlated than when they are not, especially when either T is 50 or θ = −0.8. At the same time, the sign of the correlation η matters little; that is, the impact of η is symmetric. Second, for nonstationary process (ρ = 1), the effect of θ is either small (θ = −0.8 in Figure 3b) or essentially zero (θ = 0.0 in Figure 3d, 0.8 in Figure 3f). The bell-shaped curves in Figure 1b indicate that all procedures perform better when the fundamental innovations are not correlated than when they are correlated.
Before ending presentation of Simulation II, we turn to the Appendix tables for some interesting results that are not seen in the preceding graphs. First, we note that some of the results in Table A.2 are comparable to those of Haug (1996). In our simulations with θ = 0.0 and T = 100, the power of λtr is 37.1%, 22.1%, and 35.3% for η = −0.5, 0.0, and 0.5, respectively, which are slightly higher than the maximum eigenvalue test (λmax(SC)) results (31.1%, 17.6%, and 29.9%) reported in Haug (1996, Table 1, p. 104).6
Correspondingly, the empirical size of λtr is 1 − 0.878 = 0.122 when θ = 0.8, η = −0.5, and T = 100 (Table A.3), which is also slightly higher than the λmax(SC)'s 0.094 in Haug (1996, Table 3, p. 105), implying more serious size distortion.
5. AN EXAMPLE OF THE U.S. HOG DATA AND MONTE CARLO SIMULATION III
So far, we have concentrated on bivariate models. The purpose of this section is twofold: first, we provide evidence of cointegration analysis using the SC and trace test procedures on a real life example.7
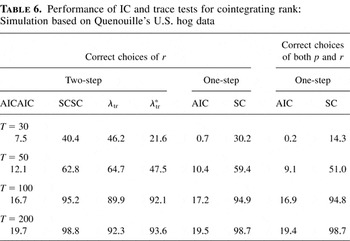
Both the one-step AIC and the two-step AICAIC conclude with the highly parameterized model (r = 4). To save space, the details of these results are not presented in Table 6.
The data set we analyze contains five variables related to the U.S. hog market. Specifically, we study annual observations from 1867 to 1948 on the farm wage rate, hog supply, hog price, corn price, and corn supply. These data were first edited and studied by Quenouille (1957, pp. 88–101). He logarithmically transformed each variable and linearly coded the logs. Several other authors, including Box and Tiao (1977), Tiao and Tsay (1983, 1989), Reinsel (1983), Velu, Reinsel, and Wichern (1986), Reinsel and Velu (1998, ch. 5), and Wang and Bessler (2004), have analyzed these data from various perspectives. The original data are included in Quenouille (1957).
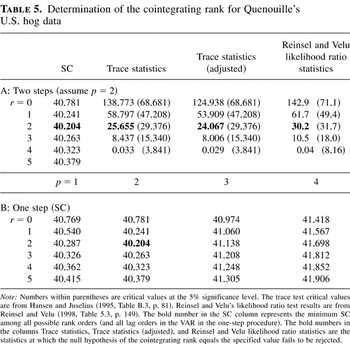
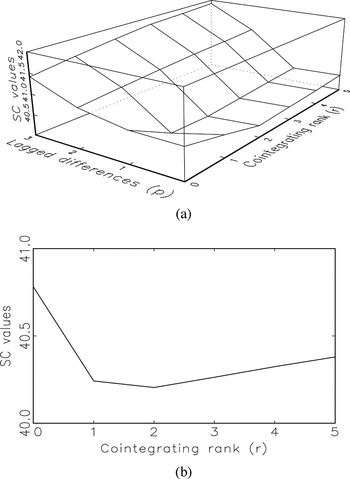
Following Box and Tiao (1977) and Reinsel and Velu (1998) we shift backward by one period the wage rate and hog price. We first implement the two-step procedure. To this end, in the first step, both SC and a likelihood ratio test are applied. They agree on two lags (the maximum number of lags in the levels VAR used in the test is four), which is also consistent with the aforementioned literature. In the second step, we calculate SC values for r = 0, 1, 2,…,5 and λtr and λtr* statistics for r ≤ 0, 1, 2,…,4, respectively, based on a VAR(2) model. The results are presented in section A of Table 5. For comparison, we also reproduce the likelihood ratio test statistics of Reinsel and Velu (1998) in Table 5. SC is minimized at r = 2, the same choice based on the other three parametric tests. Section B contains SC values for all combinations of lag order and cointegrating rank (p = 0, 1, 2, 3, 4; r = 0, 1, 2,…,5). Again, SC is minimized at r = 2 and p = 2. Therefore, in this example, the one-step SC agrees with the four two-step procedures in choices of both the order of autoregression and the cointegrating rank. The one-step results are also illustrated in Figure 4, where the surface of SC values against possible p and r values is displayed in Figure 1a and a cross-section of the surface at

in Figure 1b (where

is the number of lags in the ECM, which, of course, is

).
Determination of the cointegrating rank for Quenouille's U.S. hog data


SC values, lag order, and cointegrating rank of Quenouille's U.S. hog data. (a) Plots the SC values for different values of cointegrating rank r and autoregressive order p in the hog model. (b) Plots the SC values for different values of cointegrating rank r given .
Assuming

, the parameter estimates of the hog data, using notations in model (2), are as follows:

Assuming the DGP in equation (2) is described by these parameters, we proceed with the third simulation as follows: first, sequences of i.i.d. standard normal random numbers are generated; second, these pseudo numbers are multiplied by a factor of variance and covariance

to derive sequences of multivariate normal errors/innovations (following Doan, 1996, p. 10-2). A random sample is formed with these generated errors and the preceding parameter matrices according to equation (2). Repeating the previous process, we obtain 5,000 random samples.
Table 6 summarizes the IC and the trace test performance based on the previously simulated samples. As in the first two bivariate model simulations, the performance of the one-step and two-step AIC procedures is poor, which reflects the fact that these procedures are known to be inconsistent. The performance of SC is similar to that of λtr for all sample sizes. In this large system, λtr* performs significantly worse than λtr when sample size is 30 and 50. This is similar to the finding in Johansen (2002) that the power function of the trace test is actually shifted down by the correction factor in the simulation on the Danish data. SC correctly determines the cointegrating rank 30.2% of time in the one-step procedure when T = 30, which is lower than λtr's 46.2%. However, when the sample size is larger than 50, the two methods perform similarly. The right half of Table 6 also includes the performance of AIC and SC in finding correct lag order and cointegrating rank in the one-step procedure. Except when the sample size is small (T = 30), both IC criteria appear to be able to find correct ranks if they can find correct lag orders (comparing the last two columns with the two to their left).
Performance of IC and trace tests for cointegrating rank: Simulation based on Quenouille's U.S. hog data

6. SUMMARY
Information criteria are widely used in selecting the lag order of time series models. In this paper, we investigate whether they are also useful in the cointe-gration analysis by conducting three separate Monte Carlo simulations. We summarize the major findings as follows.
First, the design of the first simulation is of “canonic form,” which is invariant to the nonsingular transformation of the original series. The second simulation design allows investigation of the test performance under more detailed assumptions on model specifications. Simulation results from these two different designs agree when the underlying DGPs are similar (e.g., when r = 0, or when r = 1 in the models free of moving average correlation). This suggests that the DGPs used here are likely to be representative in other cointegration analyses.
Second, the IC approach can either be used to determine the lag order and cointegrating rank of the VAR in two steps, or it can be used to determine them in one step. The one-step AIC in general performs better than the two-step AICAIC. There is also some gain in using the one-step SC if the underlying DGP is nonstationary or the sample size is 100 or higher.
Third, AIC performs better than SC and the trace tests when the true DGP is stationary (of full rank). But in most cases, it converges to true models slowly in the first simulation. It does not converge in the second simulation. This result agrees with the theoretical result that AIC is inconsistent in selecting lag order or cointegrating rank.
Fourth, although SC's performance is close to that of the trace test in most cases, it may perform better than equally as well as, or worse than the trace tests depending on the presence of linear time trends, the strength of correlation between two series, and the absence of moving averages in the innovations. The results show that SC is consistent in the joint estimation of lag order and cointegrating rank. Furthermore, when the sample size is larger than 100, SC performs at least as well as, and many times better than, the trace test in selecting cointegrating rank for all model specifications.
The simulation based on a five-variable system shows that the IC performance obtained from the bivariate models may extend to larger VAR models. In particular, the one-step SC still performs quite well in the selection of both lag order and cointegrating rank if the sample size is at least moderate (larger than 50).
To conclude, future research could proceed by providing additional simulation and empirical evidence on the IC performance in larger systems and by considering alternative IC.
APPENDIX: TABULAR RESULTS ON SIMULATION II
Performance of IC and trace tests for cointegrating rank: ρ = 0.5, Simulation II

Performance of IC and trace tests for cointegrating rank: ρ = 0.85, Simulation II

Performance of IC and trace tests for cointegrating rank: ρ = 1.0, Simulation II

Performance of IC and trace tests for cointegrating rank: θ = −0.8, Simulation II

References
REFERENCES
Ahn, S.K &
C.G. Reinsel
(1990)
Estimation for partially nonstationary multivariate autoregressive
models.
Journal of the American Statistical Association
85,
813–823.Google Scholar
Akaike, H.
(1973)
Information theory and an extension of the maximum likelihood
principle. In
B.N. Petrov &
F. Csaki (eds.),
Second International Symposium on Information Theory, pp.
267–281.
Akademiai Kiado.
Aznar, A. &
M. Salvador
(2002)
Selecting the rank of cointegration space and the form of the
intercept using an information criterion.
Econometric Theory
18,
926–947.Google Scholar
Banerjee, A.,
J.J. Dolado,
D.F. Hendry, &
G.W. Smith
(1986)
Exploring equilibrium relationships in econometrics through static
models: Some Monte Carlo evidence.
Oxford Bulletin of Economics and Statistics
48,
253–277.Google Scholar
Blangiewicz, M. &
W. Charemza
(1990)
Cointegration in small samples: Empirical percentiles, drifting
moments and customized testing.
Oxford Bulletin of Economics and Statistics
52,
303–315.Google Scholar
Boswijk, H.P. &
P.H. Frasnes
(1992)
Dynamic specification and cointegration.
Oxford Bulletin of Economics and Statistics
54,
369–381.Google Scholar
Box, G.E.P. &
G.C. Tiao
(1977)
A canonical analysis of multiple time series.
Biometrika
64,
355–365.Google Scholar
Chao, J.C. &
P.C.B. Phillips
(1999)
Model selection in partially nonstationary vector autoregressive
processes with reduced rank structure.
Journal of Econometrics
91,
227–271.Google Scholar
Cheung, Y.W. &
K.S. Lai
(1993)
Finite sample sizes of Johansen's likelihood ratio tests for
cointegration.
Oxford Bulletin of Economics and Statistics
55,
313–332.Google Scholar
Doan, T.A.
(1996)
User's Manual: RATS 4.0.
Estima.
Engle, R.F. &
C.W.J. Granger
(1987)
Cointegration and error correction: Representation, estimation and
testing.
Econometrica
5,
251–276.Google Scholar
Gonzalo, J.
(1994)
Comparison of five alternative methods of estimating long-run
equilibrium relationships.
Journal of Econometrics
60,
203–233.Google Scholar
Gonzalo, J. &
J.Y. Pitarakis
(1999)
Dimensionality effect in cointegration analysis. In
R.F. Engle &
H. White (eds.),
Cointegration, Causality and Forecasting: Festschrift in Honour of
Clive Granger, pp.
212–229.
Oxford:
Oxford University Press.
Gonzalo, J. &
J.Y. Pitarakis
(1998)
Specification via model selection in vector error correction
models.
Economics Letters
60,
321–328.Google Scholar
Hansen, B.E. &
P.C.B. Phillips
(1990)
Estimation and inference in models of cointegration: A simulation
study.
Advances in Econometrics
8,
225–248.Google Scholar
Hansen, H. &
K. Juselius
(1995)
CATS in RATS.
Estima.
Haug, A.A.
(1996)
Tests for cointegration: A Monte Carlo comparison.
Journal of Econometrics
71,
89–115.Google Scholar
Johansen, S.
(1988)
Statistical analysis of cointegration vectors.
Journal of Economic Dynamics and Control
12,
231–254.Google Scholar
Johansen, S.
(1991)
Estimation and hypothesis testing of cointegration vector in
Gaussian vector autoregressive models.
Econometrica
59,
1551–1580.Google Scholar
Johansen, S.
(1992)
Determination of cointegration rank in the presence of a linear
trend.
Oxford Bulletin of Economics and Statistics
54,
383–397.Google Scholar
Johansen, S.
(1996)
Likelihood-Based Inference in Cointegrated Vector Autoregressive
Models.
Oxford University Press.
Johansen, S.
(2000)
A Bartlett correction factor for tests on the cointegrating
relations.
Econometric Theory
16,
740–778.Google Scholar
Johansen, S.
(2002)
A small sample correction for the test of cointegrating rank in the
vector autoregressions.
Econometrica
70,
1929–1961.Google Scholar
Kapetanios, G.
(2004)
The asymptotic distribution of the cointegration rank estimator
under the Akaike information criterion.
Econometric Theory
20,
735–742.Google Scholar
Kremers, J.J.,
N.R. Ericsson, &
J.J. Dolado
(1992)
The power of co-integration tests.
Oxford Bulletin of Economics and Statistics
54,
325–348.Google Scholar
Maddala, G.S. &
I.M. Kim
(1998)
Unit Roots, Cointegration, and Structural Change.
Cambridge University Press.
Phillips, P.C.B. &
J.W. McFarland
(1997)
Forward exchange market unbiasedness: The case of the Australian
dollar since 1984.
Journal of International Money and Finance
16,
885–907.Google Scholar
Phillips, P.C.B. &
W. Ploberger
(1996)
An asymptotic theory of Bayesian inference for time series.
Econometrica
64,
381–412.Google Scholar
Podivinsky, J.M.
(1990)
Testing for a unit root in time series regression.
Biometrika
75,
335–346.Google Scholar
Quenouille, M.H.
(1957)
The Analysis of Multiple Time Series.
Griffin.
Reinsel, G.C.
(1983)
Some results on multivariate autoregressive index models.
Biometrika
70,
145–156.Google Scholar
Reinsel, G.C. &
R.P. Velu
(1998)
Multivariate Reduced-Rank Regression.
Springer.
Schwarz, G.
(1978)
Estimating the dimension of a model.
Annals of Statistics
8,
461–464.Google Scholar
Stock, J.H. &
M.W. Watson
(1988)
Testing for common trends.
Journal of the American Statistical Association
83,
1097–1107.Google Scholar
Tiao, G.C. &
R.S. Tsay
(1983)
Multiple time series modeling and extended sample
cross-correlations.
Journal of Business and Economic Statistics
1,
43–56.Google Scholar
Tiao, G.C. &
R.S. Tsay
(1989)
Model specification in multivariate time series (with
discussion).
Journal of the Royal Statistical Society, Series B
51,
157–213.Google Scholar
Toda, H.Y.
(1994)
Finite sample properties of likelihood ratio tests for cointegrating
ranks with linear trends are present.
Review of Economics and Statistics
76,
66–79.Google Scholar
Toda, H.Y.
(1995)
Finite sample performances of likelihood ratio tests for
cointegrating ranks in vector autoregressions.
Econometric Theory
11,
1015–1032.Google Scholar
Velu, R.P.,
G.C. Reinsel, &
D.W. Wichern
(1986)
Reduced rank models for multiple time series.
Biometrika
73,
105–118.Google Scholar
Wang, Z. &
D.A. Bessler
(2002)
The homogeneity restriction and forecasting performance of VAR-type
demand systems: An empirical examination of U.S. meat consumption.
Journal of Forecasting
21,
193–206.Google Scholar
Wang, Z. &
D.A. Bessler
(2004)
Forecasting performance of multivariate time series models with full
and reduced rank: An empirical examination.
International Journal of Forecasting
20,
683–695.Google Scholar
Performance of IC and trace tests for cointegrating rank: r = 0, Simulation I
Performance of IC and trace tests for cointegrating rank: r = 1, T = 30, 50, Simulation I
Performance of IC and trace tests for cointegrating rank: r = 1, T = 100, 200, Simulation I
Performance of IC and trace tests for cointegrating rank: r = 2, Simulation I
Performance of IC and trace tests for cointegrating rank with different values of θ (given η = 0), Simulation II.
Performance of IC and trace tests for cointegrating rank with different values of ρ (ρ < 1) (given η = 0), Simulation II.
Performance of IC and trace tests for cointegrating rank with different values of η, Simulation II. The legends in graphs (a), (b), (c), (e), and (f) are the same as those in (d). For ease of reading, they are omitted.
Determination of the cointegrating rank for Quenouille's U.S. hog data
SC values, lag order, and cointegrating rank of Quenouille's U.S. hog data. (a) Plots the SC values for different values of cointegrating rank r and autoregressive order p in the hog model. (b) Plots the SC values for different values of cointegrating rank r given .
Performance of IC and trace tests for cointegrating rank: Simulation based on Quenouille's U.S. hog data
Performance of IC and trace tests for cointegrating rank: ρ = 0.5, Simulation II
Performance of IC and trace tests for cointegrating rank: ρ = 0.85, Simulation II
Performance of IC and trace tests for cointegrating rank: ρ = 1.0, Simulation II
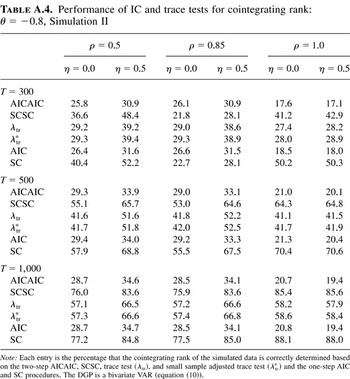
Performance of IC and trace tests for cointegrating rank: θ = −0.8, Simulation II
 You have
Access
- 42
- Cited by