Introduction
δ18O records from the large ice sheets of the polar regions have provided rich information about climate and environmental changes during the past ~400 000 years (400 kyr) as demonstrated by the results of the deep ice-core drilling programmes carried out in central Greenland (e.g. Reference DansgaardDansgaard and others, 1982, Reference Dansgaard1993) and Antarctica (Reference LoriusLorius and others, 1985; Reference JouzelJouzel and others, 1987). the old ice found at depth in the central regions of the ice sheets can also be retrieved from the ice-sheet margin (Reference Lorius and MerlivatLorius and Merlivat, 1977; Reference RaynaudRaynaud, 1977; Reference Reeh, Oerter, Letréguilly, Miller and HubertenReeh and others, 1991,Reference Reeh, H., Miller and Peltier1993). This is illustrated by Figure 1, which shows particle paths in a cross-section of an ice sheet. the higher in the accumulation area the ice was originally deposited, the deeper into the ice sheet it will sink, and the nearer to the ice edge it will resurface in the ablation area. If basal temperatures never reached the melting point, and if basal ice was never subject to folding or displacement along shear planes, a complete sequence of all deposited layers would occur at the surface in the ablation area, with the oldest ice closest to the ice edge.
Cross-section of an ice sheet, showing particle paths connecting snow-deposition sites in the accumulation zone with locations where the ice resurfaces in the ablation zone.

From 1985 to 1994, the δ18O distribution of the surface ice has been studied at 15 different locations on the Greenland ice-sheet margin. Ice samples were collected in profiles perpendicular to the ice margin. At some locations, two or more records were obtained along closely spaced parallel sampling profiles in order to study the reproducibility of the records. the sampling frequency ranged from spot sampling at distances of 1–100m to continuous sampling (20 cm sample length) over a distance of >450m. Altogether, 28 δ18O records have been established from the Greenland ice margin. In this paper, emphasis is put on records (19 out of 28) that reach beyond the Pleistocene–Holocene transition 11.5 kyr ago according to the time-scale established for Greenland deep ice cores (Reference JohnsenJohnsen and others,1992b). A relative chronology for the ice-margin records is established by correlating characteristic δ18O features in the ice-margin records with similar features in Greenland deep ice-core records. A flowline model is used to pinpoint the locations on the ice sheet where the ice from the Pleistocene–Holocene transition was originally deposited as snow. the magnitude of the Pleistocene–Holocene δ18O change at the deposition sites is then determined by comparing the δ18O values of the ice-margin profiles to the present δ18O value of the surface snow at the deposition sites. the geographical distribution of the δ18O change and the length of the δ18O records are compared to information from Greenland deep ice-core records.
Characteristics of Ice-Margin Sampling Sites
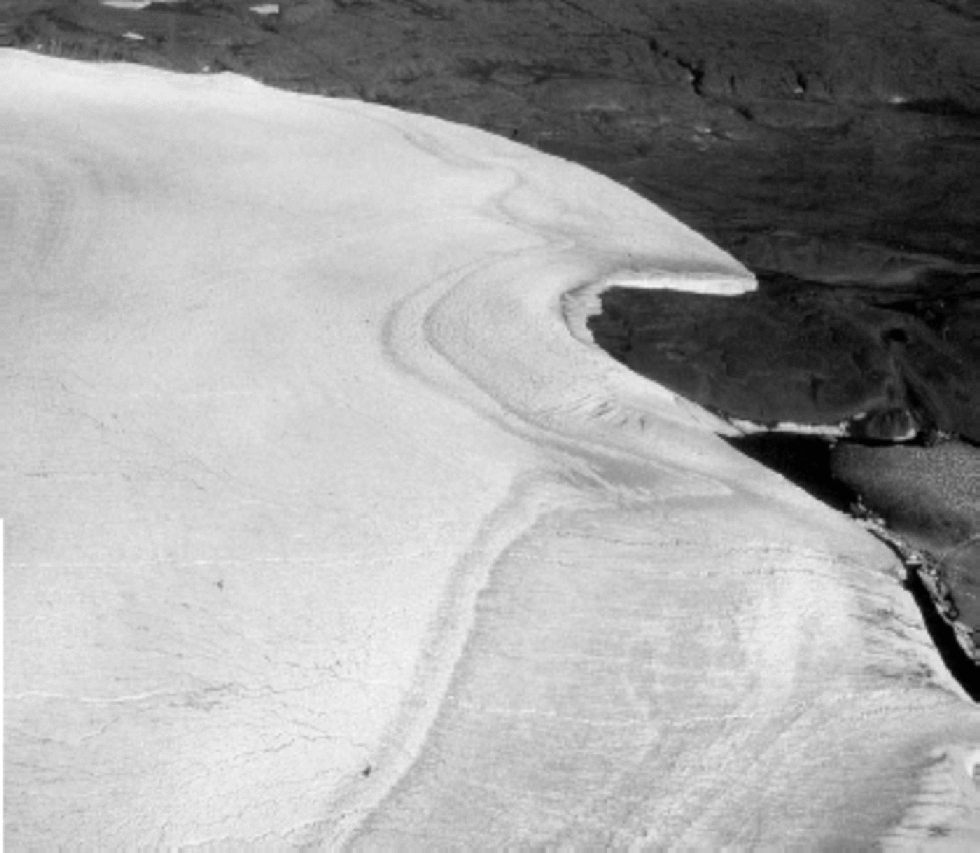
The Greenland ice-margin records were sampled in summer seasons from land-based ice margins often from sectors with divergent flow (stagnation zones). In the summer, the surface of such ice margins consists of glacier ice that ablates by melting. the annual ablation rate at the study sites ranges from almost zero at the high-altitude sites in northeast Greenland (Grandjean Fjord, Dronning Louise Land) to 1–3 m of ice at the sites at lower elevations. the surface consists of bubbly glacier ice, and surface irregularities with length and height scales of typically 2–5 and 0.5 m, respectively, are a common occurrence. A photograph of a typical δ18O sampling site is shown in Figure 2. Alternating dark- and light-coloured bands running parallel to the ice margin are clearly seen in the photograph. the light ice generally consists of coarser crystals than the dark ice. Cryoconite holes of varying diameter (from a few mm to >1m) and depths (0.1–0.5 m) containing dark material (dirt and blue-green algae) are more abundant in the light-looking bands than in the dark bands, where the dirt particles seem to be more uniformly distributed in the surface layer. This difference in dirt distribution apparently causes a difference of the surface structure that most likely explains the different colouring of the surface. Blue bands, 1–100 cm wide striking roughly parallel to the ice margin often over distances of several hundred metres, are also common. Theblue bands dip up-glacier at a steep angle. They consist of clear coarse-grained ice with δ18O values several per mil higher (i.e. enriched in the heavy-isotope δ18O) than those of the adjacent ice. Apparently, the only discontinuity in the δ18O record caused by a blue band is the anomalous δ18O value of the blue-band ice itself. No explanation is known for the origin of blue bands and the δ18O anomaly. Together with thin dirt bands (silt fraction), the blue bands form part of the large-scale foliation pattern at the surface seen in Figure 2.
Ice-margin sampling site in Kronprins Christian Land. Alternating light- and dark-coloured bands running parallel to the ice margin are visible. the wide dark band nearest to the ice edge is approximately 1km wide and consists of pre-Holocene ice. the thin light and dark bands adjacent to the wide dark band are the Bølling–Allerød/Younger Dryas climate oscillation. the light-coloured ice to the left is Holocene ice.
Sampling Procedure
The ice samples were collected using a chisel after removal of the loose radiation crust (~5 cm) with an ice axe. the ice was filled into 50 mL plastic bottles with tight lids, giving a 10–30mL melted water sample. After shipment to the analysis laboratory (Department of Geophysics, Niels Bohr Institute, University of Copenhagen, or Alfred Wegener Institute for Polar and Marine Research, Bremerhaven), the samples were either measured immediately or stored at a temperature below –10˚C until analyzed.
δ18O Records
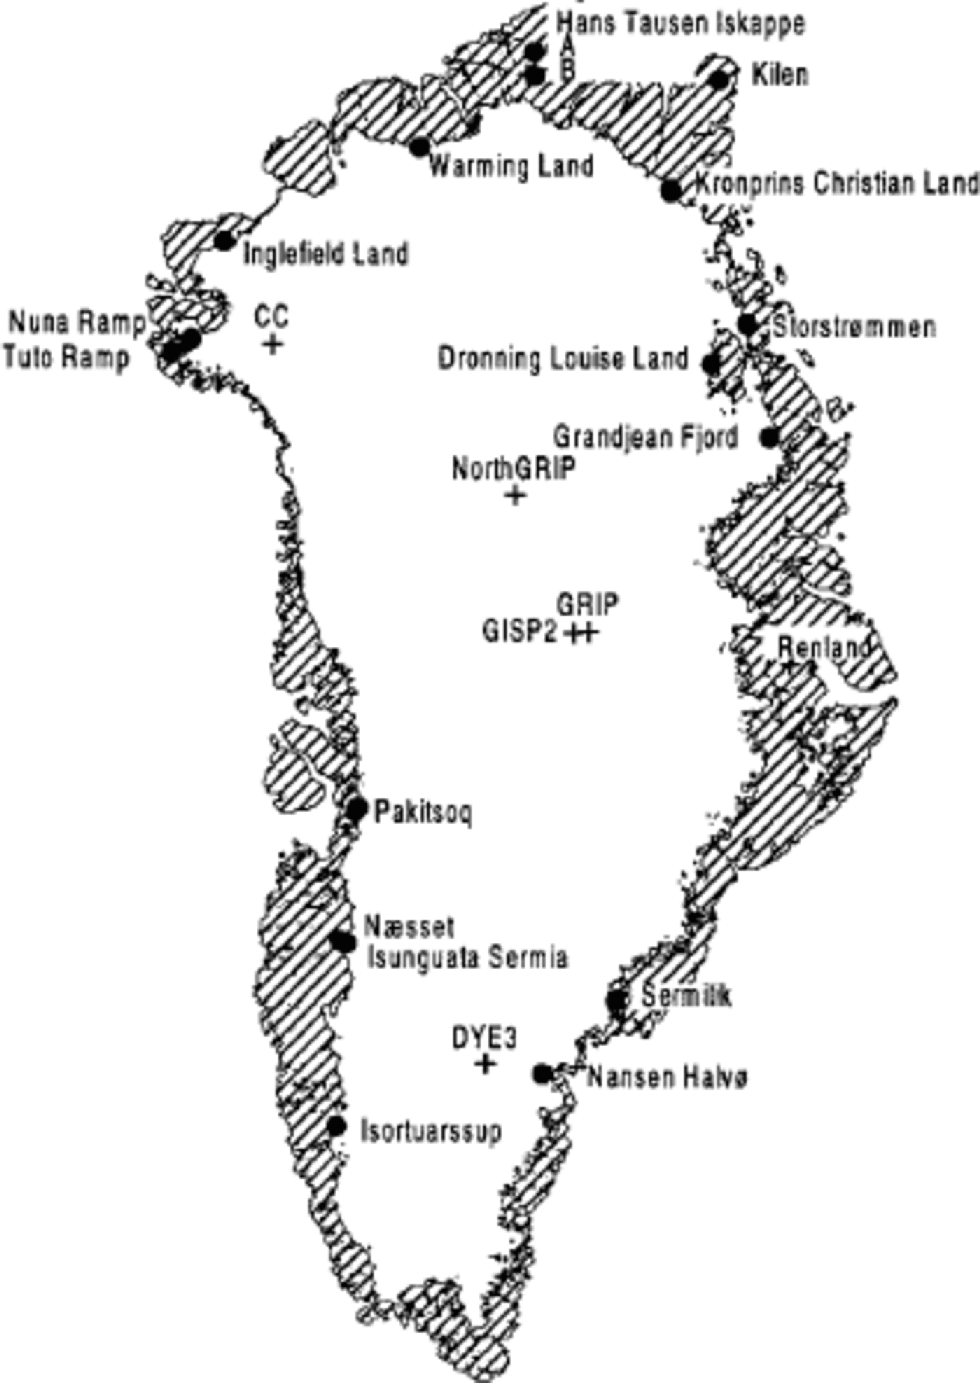
The location of the Greenland ice-margin sampling sites is shown on the map in Figure 3. Information on geographic location and length of the profiles, spacing and number of samples, length of pre-Holecene section and time-span covered by the profiles is summarized inTable 1. the mean δ18O values of the early-Holocene and Last Glacial Maximum (LGM) sections of the profiles are displayed in Table 2. We use 11.5 kyr as the date of the transition fromYounger Dryas to pre-Boreal, and ~20 kyr for the LGM. Standard deviations of the means are calculated if a sufficient number of δ18O values is available. If there are only one or two δ18O values, the standard deviation is not listed. In this case, the uncertainty of the δ18O value is estimated to be ±1‰.
Location of Greenland ice-margin sampling sites (dots) and deep ice-core drilling sites (crosses).
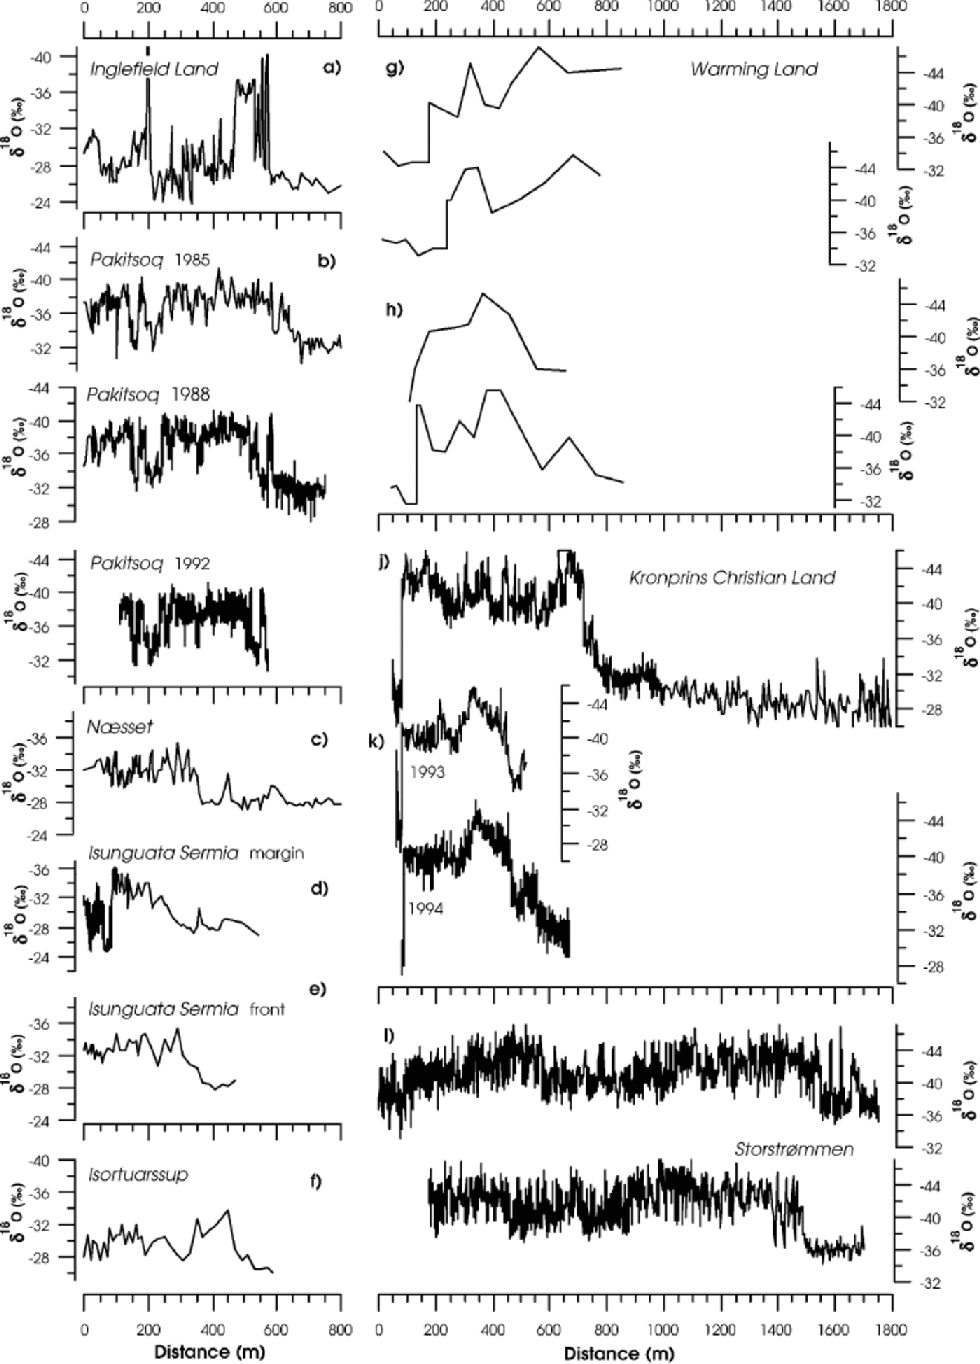
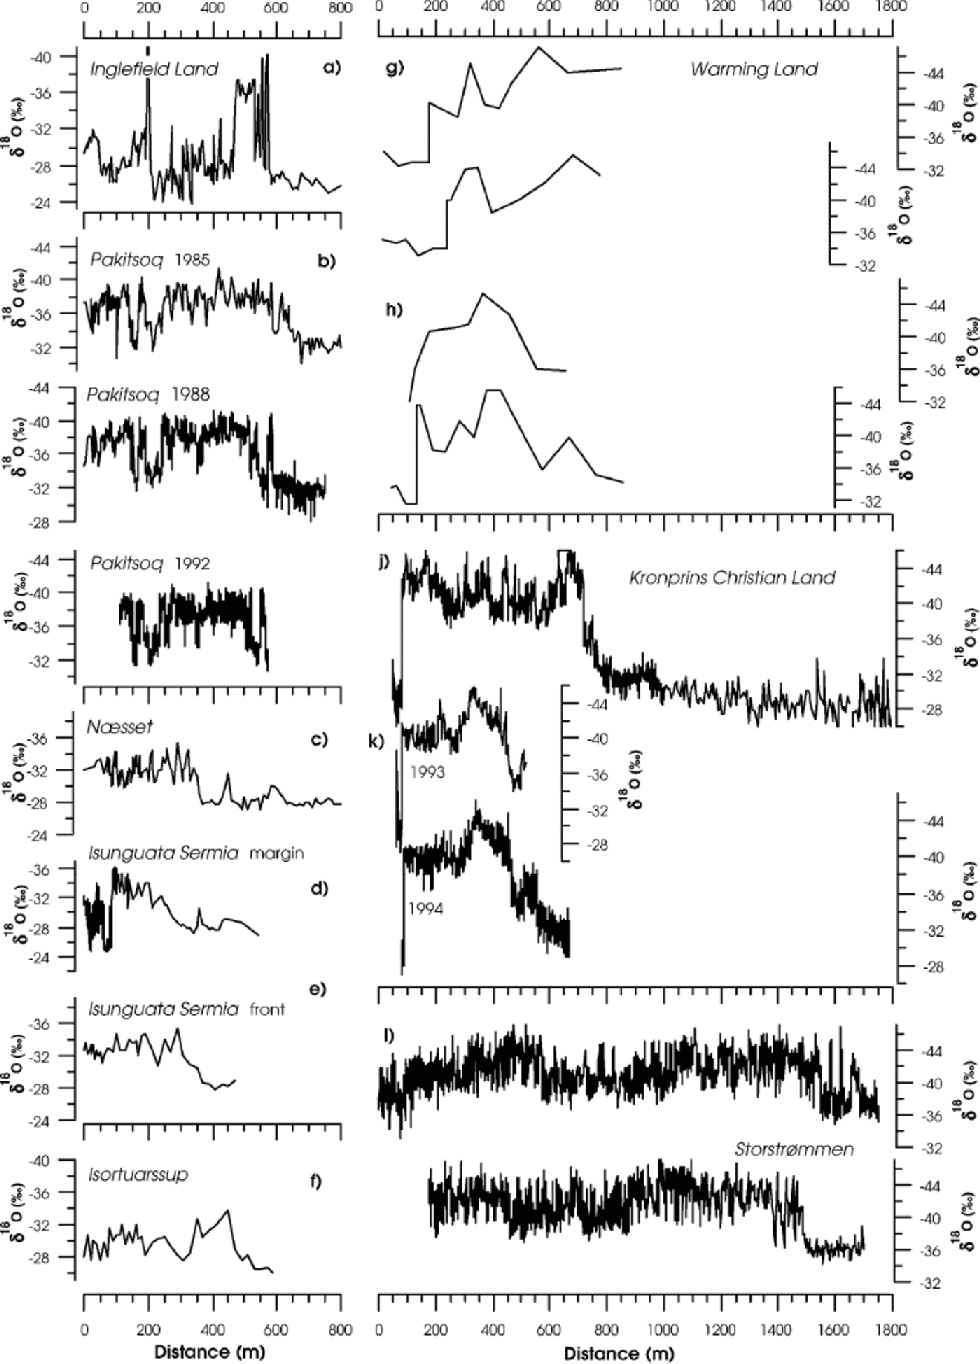
Greenland ice-margin δ18O records

Early-Holocene and LGM mean δ18O values measured on ice from Greenland ice margins

Sources: 1. Reeh and others (1987); 2. Reference Oerter, Bøggild, Jung-Rothenhäusler and ReehOerter and others (1995); 3. Reference Risbo and PedersenRisbo and Pedersen (1994); 4. Reference Reeh, H., Miller and PeltierReeh and others (1993); 5. Reference Reeh, Thomsen, Frich and ClausenReeh and others (1990); 6. Reference Reeh, Oerter, Letréguilly, Miller and HubertenReeh and others (1991).
Short records
Pleistocene ice is missing at 7 of the 15 δ18O sampling sites: Hans Tausen Iskappe and Flade Isblink in eastern North Greenland, Tuto and Nuna Ice Ramps in northwest Greenland, Dronning Louise Land in central East Greenland, and Sermilik and Nansen Halvø in southeast Greenland. the missing Pleistocene ice at Tuto Ice Ramp and Hans Tausen Iskappe was discussed by Reference Reeh, Thomsen, Frich and ClausenReeh and others (1990), Reference Thomsen, Reeh, Olesen and JonssonThomsen and others (1996) and Reference Hammer, Johnsen, Clausen, Dahl-Jensen, Gundestrup and SteffensenHammer and others (2001). These authors concluded that, most likely, Tuto Dome and Hans Tausen Iskappe did not survive the Holocene Climatic Optimum and thus are of middle- to late-Holocene origin. Very likely, a similar explanation applies to the other ice-margin sites listed above.
Long records
At the remaining ice-margin sampling sites, a band of pre-Holocene ice, 350–1700m wide, occurs next to the ice edge (Fig. 4). As mentioned previously, a strong foliation (blue bands, thin dirt bands, light- and dark-appearing surface ice) characterizes the surface of the ice sampling sites (see Fig. 2). Starting from the ice edge, the following sequence of bands is typically observed (Reference Reeh, Thomsen and ClausenReeh and others, 1987a ):
-
(1) a moraine-free light-coloured band with relatively high δ18O values, interpreted as composed of superimposed ice formed from local wind-drift winter snow accumulated along the ice edge;
-
(2) a moraine-covered band of blackish-appearing (extremely clear), isotopically homogeneous ice interpreted as regelation ice formed by freeze-on of meltwater at the glacier bed;
-
(3) a sequence of alternating light- and dark-appearing bands of bubbly glacier ice.
A general observation is that the light/dark-appearing ice correlates with high/low δ18O values indicative of interglacial/glacial ice, respectively (Reference Reeh, H., Miller and PeltierReeh and others, 1993). In some records, the superimposed-ice band and/or the regelation-ice band is missing.
Inglefield Land
The exact location of the Inglefield Land δ18O profile is not known. Only scattered information about the sampling site is available. According to Reference Risbo and PedersenRisbo and Pedersen (1994), the outermost ~400m of the profile (Fig. 4a) with highly variable δ18O values (average ~-30‰) is from an ice ramp with numerous dust layers (debris layers?) and a strong foliation. the occurrence of moraine material of various sizes on the surface is suggestive of a shear zone in which material from the base is brought to the surface. the δ18O values (average –36.5‰) of the section from 470 to 600 mindicate ice-age origin of this section, whereas the profile from 600m onwards consists of Holocene ice.
Pâkitsoq
At Pâkitsoq, three complete profiles have been sampled for δ18O analysis in August of 1985, 1988 and 1992 (Fig. 4b). In April 1994, a joint field programme was carried out with the aim of retrieving ice samples for studies of pollen, dust, chemistry, ice texture and fabric, and visual stratigraphy (Reference Thomsen and ReehThomsen and Reeh, 1994). on this occasion, 300 samples for δ18O analysis were collected in short sections distributed along the profile. the 1988 and 1992 profiles are displaced <2.5m apart, whereas the 1985 profile is located about 50 m north of the other profiles and strikes at a slightly different angle to the ice edge. A detailed description of the sampling site is given by Reference Reeh, Thomsen, Oerter and BøggildReeh and others (1994). Due to the difference in orientation of the profile lines, there is a small difference of the length scales along the profiles. Reference Reeh, Oerter, Letréguilly, Miller and HubertenReeh and others (1991) showed that a close correspondence between the 1985 and 1988 profiles was obtained if distances along the 1985 profile were transferred to distances along the 1988 and 1992 profiles by following the strike of the foliation. With this adjustment, the three records are nearly identical, particularly considering the different sampling frequency (see Table1).
Næsset Kangerlussuaq and Isunguata Sermia
The three δ18O profiles shown in Figure 4c–e are sampled at locations some kilometres apart. the first profile (Fig. 4c) is from a stagnation zone with divergent flow. the outermost 80m of the profile consists of moraine-covered regelation ice. Between 0 and 300 m, the surface has the dark appearance typical of glacial-period ice. from 300m onwards the surface was of the light-coloured type with numerous cryoconite holes. the second profile (Fig. 4d) is from a steep side margin of a glacier lobe from the ice sheet a few kilometres to the north of the first sampling location. the outermost 70m of the profile, with rapidly fluctuating δ18O values, is a typical marginal shear zone with a dark-appearing surface due to abundant dirt bands and moraine material. the band is much darker, and different from the above-mentioned dark bands with ice from the glacial period. the abrupt jump of the δ18O values to less fluctuating and lower values, interpreted as Wisconsinan ice, coincides with the boundary of the shear zone. the third profile (Fig. 4e) is from the front of the glacier lobe. This profile begins at some distance from the terminus of the lobe. the surface along the entire profile consists of bubbly glacier ice. the colour of the surface ice as well as the δ18O signature suggests that the Pleistocene–Holocene transition is located around 400 m.
Isortuarssup
The δ18O profile from Isortuarssup at the margin of the Greenland ice sheet is shown in Figure 4f. Detailed information about the sampling site is not available.
Warming Land
The δ18O records fromWarming Land shown in Figure 4g and h were sampled at two locations ~30 km apart (Reference Reeh, Thomsen and ClausenReeh and others, 1987a). the relatively high δ18O values between –30‰ and –35‰ in the outermost 100–250m of the profiles most likely represent superimposed ice formed from local wind-drift winter snow. Apparently, the Pleistocene–Holocene transition is present only in the profiles shown in Figure 4h, where it is located 470–550m from the ice edge. the large sample spacing (see Table 1) prevents further interpretation of the profiles.
Kronprins Christian Land
The δ18O profile shown in Figure 4j (profile K) and the two profiles shown in Figure 4k (profile KS) are sampled from ice-margin locations ~5km apart. A description of the sampling sites is given by Reference Oerter, Bøggild, Jung-Rothenhäusler and ReehOerter and others (1995). the profiles from the different sites do not correlate very well. It is likely that profile K is disturbed by large-scale folding, as the section from 80 to 400m looks like the mirror image of the section from 400 to 700 m. A large-scale elliptically shaped closed-banded structure visible on aerial photos of the ice surface supports this hypothesis. the transition from Pleistocene ice to Holocene ice is evident in both profiles. It correlates well with a colour change of the surface ice from dark-appearing Pleistocene ice to lighter-coloured Holocene ice. Neither of the records extends back to the previous interglacial period, in contrast to the detailed δ18O records from Pâkitsoq, central West Greenland. the high δ18O values at the beginning of the profiles originate from a marginal shear zone.
Storstrømmen
The two δ18O profiles shown in Figure 4l (profile N above, profile NS below) were sampled along two parallel lines approximately 500m apart. A detailed description of the sampling site is given by Reference Reeh, H., Miller and PeltierReeh and others (1993), who also showed that a good correspondence between the main part of the two profiles is established by following the large-scale surface foliation as represented by major blue bands from one profile to the other. Neither of the records extends back into the previous interglacial period. However, judging by the δ18O variations, the records are longer than those obtained from Kronprins Christian Land.
Correlation with Ice-Core Records
An attempt to correlate the ice-margin δ18O records from Pâkitsoq and Storstrømmen with deep ice-core records was made by Reference Reeh, Oerter, Letréguilly, Miller and HubertenReeh and others (1991, Reference Reeh, H., Miller and Peltier1993). Based on the correlations, a chronology was established for the ice-margin records by using the ice-core time-scale. the suggested correlation, based on comparison of characteristic δ18O events in the ice-margin and ice-core records, still holds. However, the chronology previously suggested by Reference Reeh, Oerter, Letréguilly, Miller and HubertenReeh and others (1991, Reference Reeh, H., Miller and Peltier1993) must be revised. This chronology relied heavily on a single high value in the 10Be-concentration profile measured on ice from the Camp Century deep ice core (Reference BeerBeer and others, 1988). An age of 60 kyr was assigned to this peak by correlation with a similar peak in the 10Be record from the Vostok deep ice core in Antarctica. Later studies (Reference Beer, Bard and BroeckerBeer and others, 1992) and evidence from the Greenland Icecore Project (GRIP) ice-core record showed this interpretation to be wrong. In Figure 5, showing the δ18O records from Camp Century, Renland, GRIP Summit, Pâkitsoq and Storstrømmen, a revised chronology for the Pâkitsoq and Storstrømmen δ18O records is indicated. the section of the Pâkitsoq profile from 150 to 240 m, previously interpreted as Emiliani’s isotopic stage 5a– 5e (EIS5a–e) is now interpreted as covering only the last interglacial (the Eemian, EIS5e). Moreover, the isolated peak at 580m in the 1988 Pâkitsoq record (also present in the 1992 record), previously interpreted as the Younger Dryas cold spell at the end of the last ice age, is probably an artefact reflecting a major disturbance of the record caused by large-scale folding of layers of glacial/interglacial ice of different competence (Reference Dahl-JensenDahl-Jensen, 1985). It is more likely that the Younger Dryas is represented by the δ18O peak at 530 m.
Comparison of ice-margin δ 18O records from Storstrømmen (running means over 12 samples of profile N) and Pâkitsoq (1988 profile) with ice-core δ 18O records from Camp Century and Renland (Reference JohnsenJohnsen and others, 1992a) and GRIP Summit (Reference DansgaardDansgaard and others, 1993). Emiliani isotopic stages (EIS) are shown at the top of the figure. Ages along the Camp Century and Summit δ 18O records are fromReference JohnsenJohnsen and others (1992a) and Reference DansgaardDansgaard and others (1993).

The previous interpretation by Reference Reeh, H., Miller and PeltierReeh and others (1993) assigned an age of ~80 kyr to the oldest ice in the Storstrømmen record. Using the revised time-scale, this age is changed to ~110 kyr. However, it is obvious that ice from the Eemian is not found in the Storstrømmen record. the relatively high δ18O values in EIS3 in the Storstrømmen record may indicate a more pronounced warming in northern East Greenland in EIS3 than in other regions of Greenland.
Flowline Modelling
A flowline model, essentially similar to the model presented by Reference ReehReeh (1988) and Reference Reeh, S and PatersonReeh and Paterson (1988), is used to determine the locations on the ice sheet where 11.5 and 20 kyr old ice in the ice-margin records was originally deposited as snow. These ages correspond approximately to the Pleistocene–Holocene transition and the late-Wisconsinan maximum, respectively (Reference JohnsenJohnsen and others, 1992b).
The flowline model is a steady-state model using the present Greenland surface and base elevations, mass balance and temperature distribution as input. First, the course of the flowlines terminating at the sampling sites for the long ice-margin δ18O records is determined as trajectories to the ice-sheet surface elevation contours. Next, the flow in vertical sections along these flowlines ismodelled.The divergence/convergence along the flowlines is expressed in terms of the curvature of the surface elevation contours at their intersection with the flowlines. the model accounts for the depth distributions of temperature and normal stress deviators, and possible enhanced flow in a bottom layer of ice of Wisconsinan origin (Reference PatersonPaterson, 1994, p. 282). the ice-velocity distribution in the vertical sections is calculated with due account also taken of ice-thickness variations. Finally, steady-state particle paths and travel times of ice particles from the deposition site in the accumulation zone to the site of resurfacing in the ablation zone are calculated. for further details of the model, the reader is referred to Reference ReehReeh (1988).
On the map in Figure 6, the flowlines terminating at the ice-margin sampling locations for the ``long records’’ are displayed as thick lines. A flowline calculation has not been performed for the Inglefield Land location because the accurate sampling site is unknown. for the other locations, the model-calculated deposition sites of 11.5 and 20 kyr old ice are shown in the map as open circles and crosses, respectively.
Present distribution of mean annual δ δ 18O of precipitation on the Greenland ice sheet illustrated by isolines (thin lines) with location of data points indicated by small dots. Large dots are ice-margin δ δ 18O sampling locations. Heavy lines are flowlines to these locations. Open circles and crosses are sites of origin of 11.5 and 20 kyr old ice in the ice-margin δ δ 18O records, as determined by ice-dynamics flowline calculations. Open triangles are deep ice-core drilling sites.

The present distribution of δ18O in the surface snow in Greenland is also illustrated in Figure 6 by isolines. the isolines are determined by gridding and contouring the scattered δ18O values measured on Greenland precipitation, i.e. surface snow from the ice sheet or local glaciers, and mean annual precipitation collected at coastal weather stations. the sampling sites are shown as black dots in Figure 6.
In Table 3, the measured early-Holocene mean δ18O values of the ice-margin records are listed together with the present surface δ18O values at the locations where the snow, according to the ice-flow modelling, was originally deposited ~11.5 kyr ago.Moreover, the measured LGM δ18O values of the ice-margin records are listed together with the present surface δ18O values at the locations where the snow, according to the ice-flow modelling, was originally deposited ~20 kyr ago. the last two columns of the table show the LGM to Holocene δ18O change as determined directly from the ice-margin records, and the same δ18O change corrected with the difference between the present surface δ18O values at the 11.5 and 20 kyr model-calculated deposition sites.
Comparison of early-Holocene (EH) and LGM δ18Ovalues measured on ice from Greenland ice margins (IMR) with the present surface values at the model-calculated sites of snow deposition (Map)

Discussion and Conclusions
Ideally, the differences shown in Table 3 between measured (IMR) and ``calculated’’ (Map) δ18O values should reflect the differences between the δ18O values of surface snow deposited, respectively, 11.5 and 20 kyr ago and present δ18O values. However, errors of the δ18O contour map and errors of the flowline model must be taken into account.
As to the errors of the δ18O contour map, the root-mean-square (rms) value of the residuals between the measured mean annual δ18O values and the map values is 0.45‰. Due to the irregular distribution of the data points, there is a considerable geographic variation of the accuracy of the surface δ18O map. the discrepancy between the early-Holocene IMR and Map values of the Warming Land and Kronprins Christian Land records can very likely be referred to errors of the δ18O map, as very few δ18O measurements are available in the relevant regions of the ice sheet.
As to the errors of the flowline model, it may, at first glance, seem to make little sense to use a steady-state flow model to calculate the particle path and travel time from the site of snow deposition to the ice margin. Since 11.5 kyr ago, the geometry and flow pattern of the ice-sheet margin has experienced large changes. However, as discussed by Reference Reeh, Hammer, Thomsen and FisherReeh and others (1987b), the consequences of even rather dramatic ice-margin fluctuations may not be so serious: 11.5 kyr old ice at the surface near the ice edge was, during the first many thousand years of its motion towards the margin, located in a region of the ice sheet where geometry (ice thickness) was not much different from present-day geometry (Reference Letréguilly, Reeh and HuybrechtsLetréguilly and others, 1991). It is therefore acceptable to apply present-day ice-sheet geometry to model the particle paths since 11.5 kyr ago, or even since 20 kyr ago. But travel times must be adjusted to account for changes of mass balance. Since 11.5 kyr ago, accumulation rates on the Greenland ice sheet have not changed very much, and assuming constant accumulation rates equal to present values seems to be acceptable. Actually, the close agreement between the IMP and Map δ18O values in regions where the δ18O map is well constrained by measured values (i.e. upstream of Storstrømmen, Pâkitsoq and Næsset/Isunguata Sermia; see map in Fig. 6) suggests that our ice-flow model performs well at least back to 11.5 kyr ago.
Between 11.5 and 20 kyr ago, accumulation rates in Greenland were less than half their present values (Reference Dahl-Jensen, Johnsen, Hammer, Clausen, Jouzel and PeltierDahl-Jensen and others, 1993). Consequently, the deposition site of 20 kyr old ice is located closer to the 11.5 kyr deposition site than predicted by our flow model, which uses a constant accumulation rate equal to the present value also for the period 11.5–20 kyr ago. the deposition site is also influenced by temporal changes of ice flow due to changing ice temperature and flow properties, complications that have also been neglected in our modelling. the correction term to the Pleistocene–Holocene δ18O shift due to different deposition sites of 11.5 and 20 kyr old ice listed in Table 3 is an upper limit, and the real δ18O shift is somewhere between the values listed in the last two columns of Table 3. Thus, the δ18O shift at the end of the Last Glacial was ~10‰ in North Greenland, and 6–7‰ in central and southern Greenland, in agreement with values of the Pleistocene– Holocene δ18O change measured on deep ice cores in Greenland (see Table 4, after Reference PatersonPaterson (1994, table 15.2)). Reference PatersonPaterson (1994) estimates the uncertainty of the ice-core derived changes to ±1‰. Based on Tables 3 and 4, we conclude that, south of ~75˚N, i.e. on the main part of the Greenland ice sheet, the Pleistocene–Holocene δ18O shift was rather uniform at 6–7‰. North of ~77˚N the shift is ~10‰. It is worth noting that, in all ice-margin and ice-core records with a 6–7‰ δ18O shift, the ice from the Pleistocene–Holocene transition originates near the main Greenland ice divide. In contrast, in all records with a ~10‰ δ18O shift, ice from the transition has its origin at the north-facing slope of the Greenland ice sheet (see map in Fig. 6). Camp Century, with a large δ18O shift, is indeed located near a local ice divide, but in broad outline the location must be characterized as a slope location.
Different changes of the environment may contribute to a shift in δ18O: (1) a climatic temperature change at the deposition site; (2) a surface-elevation change at the deposition site; (3) a change of the vapour source region; (4) a change of the seasonal distribution of the precipitation.
Ice-core and borehole studies at GRIP Summit (Dahl-Jensen and others, 1998) show that the Pleistocene–Holocene δ18O shift of 7‰ at this location corresponds to a temperature change on the order of 20 K. By analogy, the 10‰ δ18O shift on the northern slope should then correspond to a temperature change of ~30K, if the 10‰ δ18O shift was solely caused by a climatic temperature change. on the other hand, using the present δ18O–elevation relationship in Greenland of ~0.7‰ δ18O per 100m elevation change, the 3.5‰ excess δ18O shift on the north-facing slopes of the ice sheet could be explained by a ~500m increase of surface elevation during the LGM as compared to the present. It is possible that the excess δ18O change on the north-facing slopes of Greenland is caused by a change of the vapour source for the snow precipitation due to a change of the atmospheric general circulation pattern between the LGM and now. General circulation model experiments by G. Krinner and others (unpublished information) show changes of precipitation seasonality between the LGM and now, large enough to account for a δ18O shift of several per mil. Also, the ``cyclone mechanism’’ (Reference HoldsworthHoldsworth, 2001) offers an explanation of markedly different Pleistocene– Holocene δ18O shifts within the same region.
Which explanation or combination of explanations is correct cannot be resolved by this study. However, our study shows that the much-debated North Greenland δ18O anomaly known from the Camp Century deep ice-core record (e.g. Reference JohnsenJohnsen and others, 1992a) is a general feature for the north-facing slope of Greenland, and that an explanation must therefore involve the entire northern slope of the Greenland ice sheet.
The different time-span covered by the ice-margin δ18O records is also worthy of discussion. As illustrated in Figures 4 and 5, Pâkitsoq is the only ice-margin location where ice interpreted to be of pre-Eemian origin has been found. That Eemian and probably also Pre-Eemian ice is preserved in central Greenland is confirmed by the ice-core records from GRIP and Greenland Ice Sheet Project 2 (GISP2) from near the deposition site of the old ice in the Pâkitsoq record (see map in Fig. 6). the missing Eemian ice in the Storstrømmen ice-margin record, and the probably even shorter record from Kronprins Christian Land (see Fig. 4), might indicate that significant bottom melting is taking place or has taken place sometime in the past somewhere along the flowlines leading to these sampling sites. Another explanation might be that the northeast sector of the ice sheet was greatly reduced during the warm Eemian interglacial and that the later build-up of the ice sheet was mainly by local snow deposition and not by ice flow from the Summit region. Such a scenario with a significant reduction of the northeast Greenland ice-sheet sector in the Eemian interglacial is supported by a time-dependent thermomechanical model study of the Greenland ice sheet forced by a glacial–interglacial climate cycle (e.g. Reference Letréguilly, Reeh and HuybrechtsLetréguilly and others, 1991). Radiocarbon-dated reworked marine organic material also suggests a significant retreat of the northeast Greenland ice-sheet margin 32–37 kyr ago (Reference Weidick, Andreasen, Oerter and ReehWeidick and others, 1996; Landvik and others, 2001).
Our results show that δ18O records from the Greenland ice-sheet margin provide useful information about climate and dynamics of the ice sheet, and thus are important (and cheap) supplements to deep ice-core records. There are still large regions that have not been covered by ice-margin δ18O records (see map in Fig. 3).
To be useful, ice-margin δ18O profiles should be sampled in some detail, i.e. with 1–2 m sample distance. As the width of the band of pre-Holocene ice at the hitherto sampled locations is 300–1700m, this means that the number of samples to be collected at each location is on the order of 1000. Until now, a rather primitive sampling procedure has been applied. It might be worth developing a more sophisticated method aimed at cutting what could be termed a horizontal core from the surface of the ice margin. This would allow the establishment of continuous records, and also allow measurement of constituents other than δ18O on the margin ice (Reference Thomsen and ReehThomsen and Reeh, 1994).
Acknowledgements
We wish to thank all those who have spent time collecting ice samples from ice margins in Greenland, while visiting these remote areas for other purposes. the research was supported by the Commission of the European Communities under contracts EPOC-CT90-0015 and ENV4-CT95-0124, by the Nordic Council of Ministers Environmental Research Programme, by the Commission for Scientific Research in Greenland, and by the Danish Natural Sciences Research Council. the research on GEUS (Geological Survey of Denmark and Greenland) material is published with the permission of the Geological Survey of Denmark and Greenland. Comments by G. Holdsworth and an unknown reviewer led to improvements of the paper.