

Introduction
Since its conception as a separate disease entity, schizophrenia has been considered a typically chronic disease with severe dysfunctional consequences for patients, families, and society. Kraepelin (Reference Kraepelin1899), who first defined it by calling it ‘dementia praecox’, ‘condemned’ the patient with schizophrenia to an inexorably deteriorating outcome. Kraepelin's was the first distinction of schizophrenic psychosis from manic-depressive illness. The term schizophrenia, coined by Eugen Bleuler (Reference Bleuler1911), has been attached to perhaps too many patients for many years. Over-inclusiveness hampered the search for causes, as it provided for little distinction between subtypes. With time, aetiopathogenetic hypotheses of schizophrenia have been accumulating, allowing one to improve the characterisation of the disorder and to define its boundaries. In recent years, among the various hypotheses, the neurodevelopmental hypothesis (Murray & Lewis, Reference Murray and Lewis1987; Weinberger, Reference Weinberger1987) has gained consensus among investigators.
The neurodevelopmental hypothesis of schizophrenia enabled us to look at the disorder as one starting-out from the outset of life, gradually showing-off, and later manifesting psychotic symptoms consistently. Thus viewed, the disorder is a process consisting in multiple phases that are presumably the phenotypes of a progressive, direction-provided, organic insult. This is supported by both clinical and neuromorphological evidence. Symptom progression, starting from non-specific, negative, or sub-threshold symptoms, which are considered to constitute the prodrome of the disorder, had been noted since Kraepelin's times, but were more systematically described more recently (Huber et al. Reference Huber, Gross, Schüttler and Linz1980; Häfner et al. Reference Häfner, Maurer, Löffler, Bustamante, van der Heiden, Riecher-Rössler, Nowotny, Häfner and Gattaz1995).
Knowledge of the heredity of the disorder, of protective and risk factors, and of the characteristics of the disorder in each phase of life may help early interventions. To acquire information on every patient, besides history, specific standardised rating scales are needed. Many assessment tools have been developed in the last few years to evaluate each single phase of the disorder. There are two main approaches in attempting to develop these tools. One is based on the basic symptoms concept, which was developed in Germany during the late 1960s and early 1970s (Huber, Reference Huber1966; Huber et al. Reference Huber, Gross and Schüttler1975), and led to the development of the Bonn Scale for the Assessment of Basic Symptoms (Maß et al. Reference Maß, Hitschfeld, Wall and Wagner1997) and the Frankfurter Beschwerde Fragebogen (Süllwold, Reference Süllwold1991). The other approach is modelled on Stanley Kay et al.'s (Reference Kay, Fiszbein and Opler1987) Positive And Negative Syndrome Scale (PANSS) and allowed one to appropriately define ‘at-risk mental states’ (Ultra High Risks (UHRs)). Patrick McGorry and Alison Yung at Melbourne, Australia, developed the Comprehensive Assessment of At-Risk Mental States (CAARMS), a scale that allows one to define three ‘at-risk mental groups’, the UHR, termed Group 1, the Trait and State Risk Factor Group, Group 2, the Attenuated Psychotic Symptoms Group (APS), Group 3, the Brief Limited Intermittent Psychotic Symptoms Group (BLIPS) (Yung et al. Reference Yung, McGorry, McFarlane, Jackson, Patton and Rakkar1996, Reference Yung, Yuen, McGorry, Phillips, Kelly, Dell'Olio, Francey, Cosgrave, Killackey, Stanford, Godfrey and Buckby2005). The conceptual structure of this classification, despite minor term changes, has been followed by subsequent studies (Silverstein et al. Reference Silverstein, Uhlhaas, Essex, Halpin, Schall and Carr2006; Yung & McGorry, Reference Yung and McGorry2007). Informed by the CAARMS is the Structured Interview for Prodromal Symptoms (SIPS), which was modelled after the PANSS (Phillips et al. Reference Phillips, Leicester, O'Dwyer, Francey, Koutsogiannis, Abdel-Baki, Kelly, Jones, Vay, Yung and McGorry2002) and developed at the PRIME Research Clinic (Prevention through Risk Identification, Management, and Education), at Yale University, by McGlashan and Miller. The SIPS is a diagnostic semi-structured interview, and is complemented by a severity scale, the Scale Of Prodromal Symptoms (SOPS). The two instruments are conjointly used to define and diagnose individuals who may be in a pre-psychotic state (Miller et al. Reference Miller, McGlashan, Woods, Stein, Driesen, Corcoran, Hoffman and Davidson1999).
The goals of both SIPS and SOPS are to provide a systematic measure of the presence/absence of prodromal states, to measure the severity of prodromal symptoms cross-sectionally and longitudinally, and to define an operational threshold for psychosis (Miller et al. Reference Miller, McGlashan, Woods, Stein, Driesen, Corcoran, Hoffman and Davidson1999).
In this study, we administered an Italian version of the SOPS and conducted a factorial analysis. Subsequently, we compared our SOPS factors with those of Hawkins et al. (Reference Hawkins, McGlashan, Quinlan, Miller, Perkins, Zipursky, Addington and Woods2004). We aimed to test the internal consistency, and content and discriminant validity of the SOPS, and to investigate its factor–structure. To cross-validate the instrument, we performed a correlation between the Italian SOPS and the Brief Psychiatric Rating Scale (BPRS).
Methods
Data of 128 people referring to psychiatric services in a large northern Roman area were collected as part of an ongoing prospective clinical trial addressing prevention of mental health disorders. People between 15 and 30 years were recruited from inpatient and outpatient psychiatric services of this area. The total population of the basin is about 500 000 residents and people with mental problems refer to seven community mental health centres. This area is provided with two general hospitals (only one contributed participants) and one university hospital. All sites adopted the same study design.
Included patients met all of the following criteria:
(a) First contact with the mental health service outpatients and inpatients between 15 and 30 years old.
(b) A level of understanding sufficient to communicate with investigators and to understand the nature of the study.
(c) Signed, informed consent form.
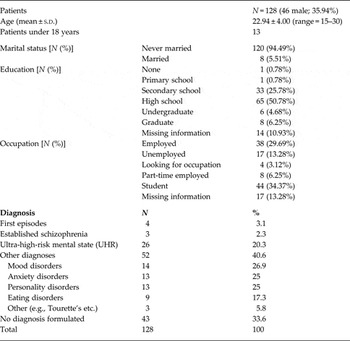
All subjects underwent a structured interview to collect historic, socio-demographic, and clinical data (Table 1). At interview, we rated the delusion item of the Comprehensive Assessment of Symptoms and History (CASH) (Andreasen et al. Reference Andreasen, Flaum and Arndt1992). The delusion item was used by Yung et al. (Reference Yung, Phillips, Yuen, Francey, McFarlane, Hallgren and McGorry2003) to rate at-risk mental states, along with scores on four BPRS items, biological vulnerability, and recent drop in functioning, and is contained in the psychotic syndrome of the CASH in the Present State section and in the past symptoms of psychosis in the Past History section. A score of 2 is needed for inclusion in the APS group, while a score of 3 or more is required for BLIPS.
Demographic and clinical data of subjects of the study

We asked psychiatrists to classify patients into four diagnostic subgroups, based on clinical risk for developing psychosis. Subgroup 1 included patients with established schizophrenia according to the Diagnostic and Statistical Manual of Mental Disorders, 4th Edition-Text Revision. American Psychiatric Association, 2000 (DSM-IV-TR) criteria (American Psychiatric Association, 2000), with at least one past episode. Subgroup 2 comprised patients at their first episode of psychosis according to the DSM-IV-TR criteria for schizophrenia spectrum disorders, i.e. schizophrenia, schizoaffective disorder, and schizophreniform disorder. In subgroup 3, termed UHR, patients were included according to the Yung et al. (Reference Yung, Phillips, Yuen, Francey, McFarlane, Hallgren and McGorry2003) criteria for at-risk mental state. Subgroup 4 consisted of patients with all other diagnoses.
Psychometric evaluation included the 24-item, expanded version of the BPRS (Lukoff et al. Reference Lukoff, Nuechterlein and Ventura1986); we used the approved Italian translation (Roncone et al. Reference Roncone, Ventura, Impallomeni, Falloon, Morosini, Chiaravalle and Casacchia1999). We used an Italian translation of the SIPS that comprised the 19-item SOPS (Miller et al. Reference Miller, McGlashan, Woods, Stein, Driesen, Corcoran, Hoffman and Davidson1999). Translation was carried out by Luciano Conti and back-translation by Luca Pani; the back-translation was approved by Scott W. Woods, one of the developers of the tool. The items of the SOPS are classified as Positive Symptoms (P, N = 5), Negative Symptoms (N, N = 6), Disorganisation Symptoms (D, N = 4), and General Symptoms (G, N = 4). Each item has a severity scale ranging from 0 (Never, Absent) to 6 (Severe/Extreme, or Psychotic, for the Positive Symptom items).
Assessments with both Italian versions of the SOPS and the BPRS were carried out only by adequately trained psychiatrists. The study design was approved by the local ethical committees of each recruitment site.
Statistical analysis
Analysis was carried out first by describing the sample, and then by performing a factorial analysis of the items of the Italian version of the SOPS after a preliminary analysis of inter-rater reliability, subsequently correlating total and subscale scores of the SOPS and the BPRS and testing reliability through Cronbach's alpha. Factorial analysis of the items of the Italian version of the SOPS has been carried out with principal components extraction with Varimax rotation, in line with the validation of the original scale. Minimum initial eigenvalues of greater than or equal to 1.0, analysis of Scree plots, and reliability (Cronbach's alpha) of factors above 0.7 were the criteria used to determine the number of factors retained in each model (Comrey & Lee, Reference Comrey and Lee1992). To be included in a given factor, an item had to possess a factor loading greater than 0.40 in its factor. A factor, to qualify as such, had to possess an eigenvalue >1. We also performed a factorial analysis of the SOPS data of the UHR subsample to compare results with the other analyses that used such samples (Hawkins et al. Reference Hawkins, McGlashan, Quinlan, Miller, Perkins, Zipursky, Addington and Woods2004; Lemos et al. Reference Lemos, Vallina, Fernández, Ortega, García, Gutiérrez, Bobes, García and Miller2006). We carried out correlation analysis by calculating the Pearson product–moment coefficient between the SOPS and the BPRS, comprising their total scores and their scores on individual scales. We analysed inter-rater reliability for the SOPS through a preliminary, separate analysis of 15 consecutive baseline interviews of 18–30-year-old (mean, 26.5 years) persons. The raters for this reliability study were two psychiatrists, A.C. and V.S., trained in the use of the SOPS. Raters provided independently their ratings for this reliability study. Ratings were compared after the conclusion of all interviews. Cohen's kappa (κ) was used for this assessment. We calculated Spearman's rank correlation coefficients (ρ) of individual SOPS items and the linear correlation coefficients (Pearson's r) of subscales and total scores. Differences in the scores of psychometric scales between the diagnostic groups were conducted through Student's t-test for independent samples. We used the Statistical Package for the Social Sciences (SPSS) (2008), Version 17.0.1. Significance for other than factorial analysis was set at p < 0.05.
Results
Socio-demographic and clinical data (Table 1)
A total of 128 people were included in the analysis. There were 46 men and 82 women (M/F ratio = 1/1.78); mean age was 22.94 years (s.d. = 4.00 years).
The numbers of people in the various subgroups (1, established schizophrenia; 2, First Episode of Psychosis (FEP); 3, UHR; 4, other diagnoses) and without a diagnosis are shown in Table 1.
SOPS item distributions within the whole sample (N = 128) show that ratings were generally low (means ranged between 0.53 of P3 and 2.3 of G2). In the UHR subgroup, item means ranged from 0.54 of D4 to 3.15 of G2.
Table 2 displays differences between the at-risk and the not at-risk groups on mean per item SOPS and total BPRS scores. Excluding patients with first onset of psychosis or chronic psychosis (groups 1 and 2), we observed significantly higher scores obtained by people at-risk for psychosis (group 3) with respect to people with other diagnoses (group 4) or no diagnosis on both the SOPS (mean per item, 1.72; s.d. = 1.69 v. 0.68; s.d. = 1.11, Student's t = 8.47; p < 0.001) and the BPRS (mean total score, 51.73; s.d. = 10.91 v. 36.08; s.d. = 8.71, Student's t = 7.67; p < 0.001).
Comparison between the at-risk and the not at-risk for psychosis (excluding patients with established psychosis or at onset) groups concerning the scores on the SOPS and on the BPRS

df, degrees of freedom; s.d., standard deviation.
Factorial analysis
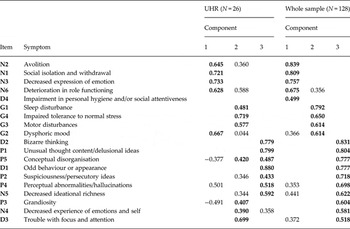
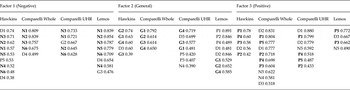
The factorial analysis of the 19 items of the SOPS in the whole sample disclosed a three-factor solution, jointly accounting for more than 60% of the total variance in the whole sample. A similar result was also obtained with the analysis of the UHR subsample (about 53%). The rotated component matrix of the SOPS, percent variances explained, internal consistency of individual factors, and items entering each factor are shown in Table 3. We named our factors 1, 2, and 3 to match the factors extracted from the Hawkins et al. (Reference Hawkins, McGlashan, Quinlan, Miller, Perkins, Zipursky, Addington and Woods2004) factorialisation. Factorialisations of the English, Italian, and Spanish versions are compared in Table 4.
Factor–structure of the SOPS in the whole sample and in the UHR subsample: rotated component matrixa

Extraction method: principal component analysis. Rotation method: Varimax with Kaiser normalisation. Loadings <0.35 are not printed for clarity. Primary loadings are in bold typeface.
aRotation converged in six iterations.
Cronbach's α for each factor:
• UHR group: factor 1 = 0.821 (number of items = 5); factor 2 = 0.663 (number of items = 7); factor 3 = 0.801 (number of items = 7).
• Whole sample: factor 1 = 0.873 (number of items = 6); factor 2 = 0.671 (number of items = 4); factor 3 = 0.913 (number of items = 10).
Explained variance (extraction sums of squared loadings):
• UHR group: Total = 52.88% (factor 1 = 15.86%; factor 2 = 11.18%; factor 3 = 25.85%).
• Whole sample: Total = 60.64% (factor 1 = 11.33%; factor 2 = 7.75%; factor 3 = 41.56%).
Comparison of the factorialisations by Hawkins et al. (Reference Hawkins, McGlashan, Quinlan, Miller, Perkins, Zipursky, Addington and Woods2004) (N = 94) with Lemos et al. (Reference Lemos, Vallina, Fernández, Ortega, García, Gutiérrez, Bobes, García and Miller2006) (N = 30), Comparelli et al. (2011, this paper) Whole sample (N = 128) and Comparelli et al. (2011, this paper) UHR sample (N = 26)

Items in the three factors that belong to the corresponding scale of the SOPS (Negative, General, and Positive, respectively, factors 1, 2, and 3) in bold typeface and their corresponding loadings.
N, negative symptom; D, disorganisation symptom; P, positive symptom; G, general symptom.
Correlation analysis between the SOPS and the BPRS
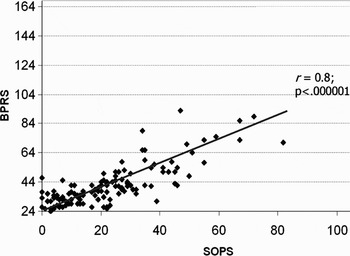
The Pearson product–moment correlation coefficient between the SOPS and the BPRS yielded a strong correlation (r = 0.80, p < 0.001) between the total scores of the two scales (Fig. 1).
Correlation between total BPRS and aggregate SOPS scores.

Moreover, we conducted another correlation between subscores of the SOPS and factors of the BPRS extracted from two published factor analyses (Ruggeri et al. Reference Ruggeri, Koeter, Schene, Vàzquez-Barquero, Becker, Knapp, Knudsen, Tansella and Thornicroft2005; Velligan et al. Reference Velligan, Prihoda, Dennehy, Biggs, Shores-Wilson, Crismon, Rush, Miller, Suppes, Trivedi, Kashner, Witte, Toprac, Carmody, Chiles and Shon2005). We correlated the factors extracted by these two factorial analyses with SOPS items after matching them for their content.
We compared three of the four factors extracted by Ruggeri et al. (Reference Ruggeri, Koeter, Schene, Vàzquez-Barquero, Becker, Knapp, Knudsen, Tansella and Thornicroft2005) from the expanded, 24-item BPRS version with concept-corresponding subscores of the SOPS.
Factor 1 of the BPRS, i.e. Depression/Anxiety, which includes items 2 (anxiety), 3 (depression), 4 (suicidality), and 19 (tension), has been correlated with the general symptom subscale of the SOPS (r = 0.54; p < 0.01).
Factor 2 of the BPRS, i.e. Positive Symptoms, includes items 8 (grandiosity), 11 (unusual thought content), 10 (hallucinations), 15 (conceptual disorganisation), and 9 (suspiciousness); it correlated with the positive symptom subscale of the SOPS (r = 0.8; p < 0.001).
Factor 3 of the BPRS, i.e. Negative Symptoms, includes items 14 (disorientation), 16 (blunted affect), 18 (motor retardation), 17 (emotional withdrawal), and 24 (mannerism, posturing); it correlated with the negative symptom subscale of the SOPS (r = 0.70, p < 0.001).
Velligan et al. (Reference Velligan, Prihoda, Dennehy, Biggs, Shores-Wilson, Crismon, Rush, Miller, Suppes, Trivedi, Kashner, Witte, Toprac, Carmody, Chiles and Shon2005) found four factors, i.e. Depression/Anxiety, Activation, Negative Symptoms/Retardation, and Psychosis. We correlated the Psychosis factor of the BPRS with matching items from the SOPS, comprising P1, P4, P5, and D1 (see Table 3 for item content specification). We found a high correlation (r = 0.84, p < 0.001). Then we correlated Velligan et al.'s (2005) Depression/Anxiety factor with SOPS G2 (Dysphoric mood) only, obtaining r = 0.62 (p < 0.01). Finally, we correlated the negative symptom factor of the BPRS and a core negative SOPS group consisting of N1 and N3, obtaining a strong correlation (r = 0.72, p < 0.001).
Inter-rater reliability
Using an alpha cut-off of 0.05 in rejecting the null hypothesis (no correlation), we found that all SOPS items showed an extremely significant positive correlation between the ratings of the two raters. Non-parametric Spearman correlations for each item showed the lowest ρ for P4 (Perceptual abnormalities/hallucinations, 0.902). Cohen's κ for inter-rater reliability was 0.91 (p < 0.0001).
Convergence between the Criteria Of Prodrome Symptoms (COPS) and the Yung et al. (2003) criteria in identifying at-risk individuals
We found 26 patients with a UHR mental state according to the Yung et al. (Reference Yung, Phillips, Yuen, Francey, McFarlane, Hallgren and McGorry2003) criteria for at-risk mental state, which comprise the scores on the BPRS unusual thought content, hallucinations, suspiciousness, and conceptual disorganisation items, the delusions rating of the CASH (Andreasen et al. Reference Andreasen, Flaum and Arndt1992), family occurrence of psychosis or having a DSM-IV diagnosis of schizotypal personality disorder, and at least 30% reduction of Global Assessment of Functioning, American Psychiatric Association, 2000 (GAF) scores during the last year. Among these patients, 21 were also at-risk according to the COPS criteria (i.e. a score of at least 3 on at least one positive SOPS item) for UHR mental state (80.77% of cases identified by the Yung et al. (Reference Yung, Phillips, Yuen, Francey, McFarlane, Hallgren and McGorry2003) criteria). Among subjects not at-risk for psychosis (subgroup 4 and no diagnosis), there were no cases that the SOPS criteria could classify as at-risk, in which the Yung et al. (Reference Yung, Phillips, Yuen, Francey, McFarlane, Hallgren and McGorry2003) criteria would fail to detect.
Discussion
In this study, we compared factor–structures of the Italian and original English SOPS versions and found remarkable overlap. Furthermore, we found significant cross-correlations between SOPS and BPRS item clusters referring to similar symptom dimensions, i.e. mood, positive, and negative.
Individual item score distribution showed low SOPS scores in an unselected help-seeking population. Both the at-risk and the not at-risk (i.e. no diagnosis or with no risk for psychosis, but not chronic or first episode psychosis) subsamples scored highest on the G2 item, dysphoric mood.
A prominent difference between at-risk and not at-risk patients was that patients in the UHR group scored significantly higher on the N1 (social anhedonia and withdrawal) and on the D2 (bizarre thinking) items. We also found that people in the UHR group scored lower on the GAF with respect to people who did not fulfil criteria for UHR (p < 0.025). We considered 65 as the lowest cut-off for normal functioning, i.e. a score lower than 65 indicated the need for treatment; this cut-off also has been also by others (Rhinewine & Docherty, Reference Rhinewine and Docherty2002; Wilson et al. Reference Wilson, Bobier and Macdonald2004).
It is interesting that Velthorst et al. (Reference Velthorst, Nieman, Becker, van de Fliert, Dingemans, Klaassen, de Haan, van Amelsvoort and Linszen2009) found these same items to differentiate UHR people who transit to psychosis from those who do not, inasmuchas the former scored higher on these items at baseline with respect to the latter.
We should underline that the N1 item in the most recent version of the SOPS (Miller et al. Reference Miller, McGlashan, Rosen, Cadenhead, Cannon, Ventura, McFarlane, Perkins, Pearlson and Woods2003; McGlashan et al. Reference McGlashan, Walsh and Woods2010), currently Scale Of Psychosis-Risk Symptoms. social anhedonia withdrawal changed into social anhedonia. The term withdrawal has been suppressed because, according to the developers of the instrument, it embodies elements of paranoia, a positive symptom. In fact, the PANSS distinguishes active from passive social withdrawal, with the former incorporating paranoid elements and the latter linked to avolition or apathy. It would be interesting to assess whether this change will affect the item's predictive ability.
The original factor analysis of SOPS items by Hawkins et al. (Reference Hawkins, McGlashan, Quinlan, Miller, Perkins, Zipursky, Addington and Woods2004) yielded three first-order factors: factor 1, a homogeneous negative symptom component; factor 2, consisting in four general symptoms; and factor 3, loading from almost all SOPS positive symptoms. A similar trifactorial structure was also found by Lemos et al. (Reference Lemos, Vallina, Fernández, Ortega, García, Gutiérrez, Bobes, García and Miller2006) in Spain. Our factorial analysis of the Italian version of the SOPS yielded a three-factor solution as the best fit, independently of whether it was carried out in the entire sample of first-time psychological help-seekers or only in the UHR subsample. Remarkably, data of the English and Spanish analyses compare with ours for the fact that the items classified as ‘disorganised’ within the SOPS were spread among the other three factors, which grossly correspond to a positive, a general, and a negative dimension (Table 4).
In our study, we used a somewhat larger sample than Hawkins et al. (Reference Hawkins, McGlashan, Quinlan, Miller, Perkins, Zipursky, Addington and Woods2004); however, the two studies maybe considered equivalent in terms of validity. The exploratory factor analysis carried out by Lemos et al. (Reference Lemos, Vallina, Fernández, Ortega, García, Gutiérrez, Bobes, García and Miller2006), despite the small sample size (N = 30), yielded results that were similar for many aspects to those of Hawkins et al. (Reference Hawkins, McGlashan, Quinlan, Miller, Perkins, Zipursky, Addington and Woods2004) and ours, but also in-between concerning the third factor, which was purely positive in Hawkins et al. (Reference Hawkins, McGlashan, Quinlan, Miller, Perkins, Zipursky, Addington and Woods2004), mixed positive-disorganised in Lemos et al. (Reference Lemos, Vallina, Fernández, Ortega, García, Gutiérrez, Bobes, García and Miller2006), and mixed positive-negative-disorganised in our study (Table 4).
According to our results, the Italian SOPS showed convergent validity with the English and Spanish versions, with the three factors extracted largely overlapping. However, our partial analysis of the UHR subsample and the exploratory analysis by Lemos et al. (Reference Lemos, Vallina, Fernández, Ortega, García, Gutiérrez, Bobes, García and Miller2006) share low sample size as a limit and are both the most dissimilar with the original version, as far as factor item composition is concerned. Differently, despite being carried out on different target populations, both Hawkins et al. (Reference Hawkins, McGlashan, Quinlan, Miller, Perkins, Zipursky, Addington and Woods2004) and our whole sample analysis showed a higher consistency and inter-relatedness. Both samples were mostly composed of hitherto never-psychotic subjects at their very first contact with mental health services; this might explain the lack of emergence of a disorganisation factor.
Confirming the results obtained through factorial analysis, the correlation between SOPS and BPRS showed a highly significant congruency of assessments. Congruency was confirmed whether we compared our results obtained on the SOPS with Velligan et al.'s (2005) factorialisation of the BPRS, who investigated a sample with heterogeneous diagnoses, or with Ruggeri et al.'s (2005) factorialisation, which was carried out on people with schizophrenia only. Since the BPRS is a widely used tool and the SOPS is new, it further adds to the latter's validity. The population on which we obtained data on the SOPS is a psychological help-seeking one, while the populations on which Hawkins et al. (Reference Hawkins, McGlashan, Quinlan, Miller, Perkins, Zipursky, Addington and Woods2004) and Lemos et al. (Reference Lemos, Vallina, Fernández, Ortega, García, Gutiérrez, Bobes, García and Miller2006) reported are prodromal ones. The fact that we obtained similar results as to the factor–structure of the instrument extends its scope.
There has been considerable overlap between diagnoses of psychotic risk posed using the current Australian (CAARMS) (Yung et al. Reference Yung, Yuen, McGorry, Phillips, Kelly, Dell'Olio, Francey, Cosgrave, Killackey, Stanford, Godfrey and Buckby2005) and American criteria (COPS) (Miller et al. Reference Miller, McGlashan, Rosen, Cadenhead, Cannon, Ventura, McFarlane, Perkins, Pearlson and Woods2003). We here confirmed, using former Australian criteria (Yung et al. Reference Yung, Phillips, Yuen, Francey, McFarlane, Hallgren and McGorry2003), that the American criteria are more restrictive, as there were only 21 subjects out of 26 for which belonging in a prodromal group could be confirmed by applying the American criteria to people meeting former Australian criteria, whereas no further person could be added by applying the American criteria to people not classified by the former Australian criteria as prodromal.
Limitations
This study is cross-sectional; hence we are not able to test the predictive validity of the SOPS, and follow-up data are still unavailable. The total sample was perhaps too small to yield a sufficient number of prodromal subjects and allow the validation of the instrument in a specific population; however, it was sufficient for validation in a more general population.
Conclusion
The Italian version of the SOPS corresponds to the original version, and may be used to assess risk for developing psychosis in a population of psychological help-seekers. It would be premature to suggest using the tool as standard assessment in psychiatry, but it may be useful in specifically dedicated centres. Longitudinal studies using this methodology are needed to assess the instrument's predictive power and usefulness in clinical settings. People at-risk for psychosis score different from those not at-risk on some items of psychopathological rating scales; hence they may represent psychopathologically distinct populations even prior to psychotic onset.
Acknowledgments
The contribution of all psychiatric staff of the Mental Health Department of ASL Roma E, who helped in assessing cases and data collection, is gratefully acknowledged.
Declaration of Interests
The authors declare no conflict of interests for the present study; however, Paolo Girardi has in the past two years received research support from Lilly and Janssen, has participated in Advisory Boards for Lilly, Organon, Pfizer, and Schering and received honoraria from Lilly and Organon; and Roberto Tatarelli has in the past two years participated in Advisory Boards for Schering, Servier, and Pfizer, and received honoraria from Schering, Servier, and Pfizer.
This project has not been supported by public or private funds.