Implications
Selection from combinations of traits used as selection criteria does not necessarily result in an improvement in the traits in the same proportion as desired. As computing the relative weights to be applied to the objective traits in a selection index is extremely complicated, those finally applied in most cases are not the result of mathematical expressions, but they are usually roughly decided in meetings and can change periodically in the light of the observed responses. The importance defined by the relative weights of the traits should therefore alternatively be monitored as in this study, which allows anticipating the correlated responses. In the particular case of alpacas, special attention should be paid to the relationships between some of the most important traits.
Introduction
South American camelids are among those species with high-quality hair for the textile industry (Allain and Renieri, Reference Allain and Renieri2010), but they are still bred under low productivity systems (Cervantes et al., Reference Cervantes, Pérez-Cabal, Morante, Burgos, Salgado, Nieto, Goyache and Gutiérrez2010). Genetic improvement programmes of these populations are an exception all over the world such as those arisen in New Zealand (Wuliji et al., Reference Wuliji, Davis, Dodds, Turner, Andrews and Bruce2000) and Australia (McGregor, Reference McGregor2002). One of the most successful genetic improvement programmes for alpaca fibre production has been implemented in the Peruvian Altiplano by PACOMARCA (INCATOPS S.A.). Artificial selection process is carried out in this population based on BLUP breeding values for four fibre traits and five subjective-type traits. International Committee for Animal Recording (ICAR), is an institution aiming to promote the development and improvement of the activities of performance recording and the evaluation of farm livestock (ICAR, 2012). Two of the fibre traits considered selection objective by PACOMARCA have been set as the firsts in the list of seven by ICAR recommendations when organizing performance recording (ICAR, 2012); however, there are others in the list that could be sometimes considered of importance (Canaza-Cayo et al., Reference Canaza-Cayo, Alomar and Quispe2013) at the discretion of the breeder. In this recommendation, ICAR does not suggest any relative importance of subjective traits. The experimental PACOMARCA ranch has established, to its own interest, the relative linear subjective importance of these nine traits. Irrespective of the interest, from ICAR recommendation or from PACOMARCA, using those weights directly on the performances registered in the data set can lead to undesired results. Ignoring genetic and phenotypic correlations between traits could lead to unexpected consequences in the correlated response of some traits. To overcome this problem, selection indices have been developed to combine several and diverse traits related to the profit final goal, because they are dynamic tools that can be adapted to any variation of industry objectives. Selection indices have been commonly used for a long time in dairy cows (Miglior et al., Reference Miglior, Muir and Van Doormaal2005), but they have also been studied or implemented in beef (Amer et al., Reference Amer, Simm, Keane, Diskin and Wickham2001) and sheep populations (Byrne et al., Reference Byrne, Amera, Fennessya, Cromiec, Keadyd, Hanrahand, McHughe and Wickham2010).
The goal of this study was to establish how to implement a combined index starting from genetic parameters and to study the expected correlated genetic trends by considering different alternative procedures of weighting all the involved traits, and the consequences of a wrongly proceeding way. The developed methodology will be useful to explore expected genetic trends from genetic parameters such as heritabilities and genetic correlations in other animal populations.
Material and methods
Data
Production data and pedigree information were obtained from the experimental PACOMARCA ranch as registered in the performance-recording software PACO PRO 4.3 (http://www.PACOMARCA.com/PACOMARCA/paco_pro_en.htm), developed by PACOMARCA S.A. Details about PACOMARCA experimental ranch can be found in a study by Gutiérrez et al. (Reference Gutiérrez, Goyache, Burgos and Cervantes2009). The two alpaca ecotypes, Suri (SU) and Huacaya (HU), were analysed independently. The involved traits were those analysed by Cervantes et al. (Reference Cervantes, Pérez-Cabal, Morante, Burgos, Salgado, Nieto, Goyache and Gutiérrez2010) and were grouped into two subsets: (a) those involving mean and variability of fibre diameter (FD); and (b) subjectively scored-type traits. The first group of traits were FD (in µm; FD), CV of FD, comfort factor (CF) and s.d. of FD. Mean FD was computed from washed samples after minicored and 2 mm snippets using an Optical Fibre Diameter Analyser (OFDA 100). CF is defined as the percentage of fibre with <30 µm. The second group of traits included: density (DE), crimp (CR), scored only in HU alpacas, lock structure (LS), scored only in SU alpacas, head (HE), coverage (CO) and balance (BA). Details of definition and ways of scoring were reported by Cervantes et al. (Reference Cervantes, Pérez-Cabal, Morante, Burgos, Salgado, Nieto, Goyache and Gutiérrez2010). All the alpacas were scored numerically by the same classifier, as a distance from that considered as the best performance for each trait, on a scale from poor (1) to excellent (5). Some of these traits were already analysed by Gutiérrez et al. (Reference Gutiérrez, Goyache, Burgos and Cervantes2009), and all of them were used to estimate genetic parameters by Cervantes et al. (Reference Cervantes, Pérez-Cabal, Morante, Burgos, Salgado, Nieto, Goyache and Gutiérrez2010), but they have been reanalysed under the same model with the updated data set for both SU and HU ecotypes to improve the accuracy of the estimations of the genetic parameters, and they are shown in Table 1. These new parameters were obtained over a total of 11 620 performance fibre records, 3728 morphological records and 6310 pedigree records in HU ecotype, and 3343 performance fibre records, 1038 morphological records and 4858 pedigree records in SU ecotype. Table 1 also includes the phenotypic correlations between the morphological traits and the first shearing scores, given that the first group is registered at the first age of the animals.
Heritabilities (on diagonal), between-traits genetic (above diagonal) and phenotypic correlations (below diagonal) for fibre and type traits in Huacaya and Suri ecotypes

FD=fibre diameter; s.d.=standard deviation; CF=comfort factor; DE=density; CR=crimp; HE=head; CO=coverage; BA=balance; LS=lock structure.
Reference weights
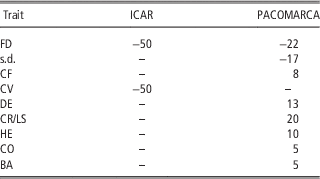
To simplify, only two sets of relative subjective weights will be considered for analysis in this study, those inspired by the ICAR suggestions with only FD and CV as traits of concern (ICAR, 2012), considered with identical importance, and those defined by PACOMARCA. However, the involved theory can be extended to any other set of weights and it should be easily extensible to any other population or specie under different genetic parameters provided they are known. The two sets of parameters are shown in Table 2, in which traits wishing to be decreased appear with negative value. It should be emphasized that an unaccounted trait in the index provided means that the breeder has disregarded it and does not mean as an objective of keeping it unchanged. Coefficients weighting the objectives or performances will be expressed in % over the sum of the absolute values of traits involved in each index to help in their interpretation.
Sets of relative arbitrary reference weights essayed for the traits (in percentage): ICAR – Identical weighting for the first two traits in the list recommended by ICAR guidelines (ICAR, 2012)

FD=fibre diameter; s.d.=standard deviation; CF=comfort factor; DE=density; CR=crimp; LS=lock structure; HE=head; CO=coverage; BA=balance.
PACOMARCA – weights suggested by textile industry (negative values indicate the trait is being reduced).
Computation of relative weighting of traits
Two approaches have been studied and compared with the reference weights: (a) the first approach computes the relative weights b on phenotypes y; (b) the second approach estimates the equivalent economic values p
eq
weighting genotypes u if the reference weights were applied on phenotypes. Selection indexes theory (Hazel and Lush, Reference Hazel and Lush1943) was used, according to which selection should be carried by choosing as parents those individuals with the highest predictors of the aggregate genotype H, defined as a linear combination of the traits to be modified by selection, that are weighed by their relative economic value p
k
such that:
 $$H={\bf p'u}=p_{1} u_{1} {\plus}p_{2} u_{2} {\plus}...{\plus}p_{n} u_{n} $$
, where u represents the additive genetic values for each trait. In this expression, the relative economic value theoretically describes the obtained gain in currency when increasing the corresponding trait in one. However, in breeding programmes, use of a subjective weighting as assessing economic weights is extremely controversial, and this is the sense in which they are managed in the context of this work. The predictor of H for each individual,
 $\hat{H}_{k} $
, should be obtained as:
 $$\hat{H}_{k} ={\bf p'\,{{\vskip -3pt\hskip 2.6pt\hat\hskip -3.9pt}{u}}}=p_{1} \^{u} _{1} {\plus}p_{2} \^{u} _{2} {\plus}...{\plus}p_{n} \^{u} _{n} ={\bf p'C'V}^{{{\bf {-}1}}} {\bf y}={\bf b'y}=b_{1} y_{1} {\plus}b_{2} y_{2} {\plus}...{\plus}b_{m} y_{m} $$
where û is the vector of the predicted breeding values; y is the vector of the phenotypes for each trait; C is the covariance matrix between y and u vectors, C=Cov (y,u); V is the (co)variance phenotypic matrix of the traits used as selection criteria, V=Var (y), given that C and V are known. In this study, the involved traits in u and y vectors will be considered the same.
(a) Computation of b: weights to be used.
Weights b to be used for weighting the phenotypes on y can attained by
 ${\bf b'}={\bf p'C'V}^{{{\bf {-}1}}} $
. For example, in the case of ICAR reference, p is 0.5 (50%) for FD and 0.5 (50%) CV. Matrices C and V were obtained from the genetic parameters by assuming all the additive genetic variances being the unity (
 $$\sigma _{{u_{1} }}^{2} =\sigma _{{u_{2} }}^{2} =\sigma _{{u_{3} }}^{2} ...=\sigma _{{u_{n} }}^{2} =1$$
), where
 $$\sigma _{{u_{k} }}^{2} $$
is the additive genetic variance of the trait k, therefore all of them working on the same identical genetic scale. As objective and criteria are the same traits, and under the usual assumption of null covariance between additive genetic effects and any other additive component of phenotypes, a covariance between a phenotype and its additive genetic effect reduces to its additive genetic variance, and C becomes a genetic additive (co)variance matrix where diagonals are equal to one. Off-diagonal elements are the genetic correlations in Table 1, given that
 $$r_{{u_{k} u_{l} }} ={{\sigma _{{u_{k} u_{l} }} } \over {\sqrt {\sigma _{{u_{k} }}^{2} \sigma _{{u_{l} }}^{2} } }}$$
, where
 $$r_{{u_{k} u_{l} }} $$
is the genetic correlation between the k and l traits and
 $$\sigma _{{u_{k} }}^{2} $$
=1 for any trait, thus becoming
 $$\sigma _{{u_{k} u_{l} }} =r_{{u_{k} u_{l} }} $$
and C:
 $$\eqalign{{\bf C}=Var({\bf u})=\left[ {\matrix{ {\sigma _{{u_{1}^{{}} }}^{2} } & {\sigma _{{u_{1}^{{}} u_{2}^{{}} }} } & {\sigma _{{u_{1}^{{}} u_{3}^{{}} }} } & {....} & {\sigma _{{u_{1}^{{}} u_{m}^{{}} }} } \cr {\sigma _{{u_{2}^{{}} u_{1}^{{}} }} } & {\sigma _{{u_{2}^{{}} }}^{2} } & {\sigma _{{u_{2}^{{}} u_{3}^{{}} }} } & {....} & {\sigma _{{u_{2}^{{}} u_{m}^{{}} }} } \cr {...} & {...} & {...} & {....} & {...} \cr {...} & {...} & {...} & {....} & {...} \cr {\sigma _{{u_{m}^{{}} u_{1}^{{}} }} } & {\sigma _{{u_{m}^{{}} u_{2}^{{}} }} } & {\sigma _{{u_{m}^{{}} u_{3}^{{}} }} } & {....} & {\sigma _{{u_{m}^{{}} }}^{2} } } } \right]\cr =\left[ {\matrix{ 1 & {r_{{u_{1}^{{}} u_{2}^{{}} }} } & {r_{{u_{1}^{{}} u_{3}^{{}} }} } & {....} & {r_{{u_{1}^{{}} u_{m}^{{}} }} } \cr {r_{{u_{2}^{{}} u_{1}^{{}} }} } & 1 & {r_{{u_{2}^{{}} u_{3}^{{}} }} } & {....} & {r_{{u_{2}^{{}} u_{m}^{{}} }} } \cr {...} & {...} & {...} & {....} & {...} \cr {...} & {...} & {...} & {....} & {...} \cr {r_{{u_{m}^{{}} u_{1}^{{}} }} } & {r_{{u_{m}^{{}} u_{2}^{{}} }} } & {r_{{u_{m}^{{}} u_{3}^{{}} }} } & {....} & 1 \cr } } \right]$$
Given that
 $$h_{k}^{2} ={{\sigma _{{u_{k} }}^{2} } \over {\sigma _{{y_{k} }}^{2} }}$$
, where
 $$h_{k}^{2} $$
is the heritability of the trait k, and
 $$\sigma _{{u_{k} }}^{2} =1$$
for any trait, diagonal elements in V can be taken from the heritabilities of the traits in Table 1 as
 $$\sigma _{{y_{k} }}^{2} ={\raise0.7ex\hbox{$1$} \!\mathord{\left/ {\vphantom {1 {h_{k}^{2} }}}\right.\kern-\nulldelimiterspace}\!\lower0.7ex\hbox{${h_{k}^{2} }$}}$$
. Off-diagonal elements in V are derived from
 $$r_{{y_{k} y_{l} }} ={{\sigma _{{y_{k} y_{l} }} } \over {\sqrt {\sigma _{{y_{k} }}^{2} \sigma _{{y_{l} }}^{2} } }}$$
where
 $$r_{{y_{k} y_{l} }} $$
is the phenotypic correlation between the traits k and l. Given that
 $$\sigma _{{y_{k} }}^{2} ={\raise0.7ex\hbox{$1$} \!\mathord{\left/ {\vphantom {1 {h_{k}^{2} }}}\right.\kern-\nulldelimiterspace}\!\lower0.7ex\hbox{${h_{k}^{2} }$}}$$
,
 $$\sigma _{{y_{k} y_{l} }} =r_{{y_{k} y_{l} }} \sqrt {\sigma _{{y_{k} }}^{2} \sigma _{{y_{l} }}^{2} } =r_{{y_{k} y_{l} }} \sqrt {{\raise0.7ex\hbox{$1$} \!\mathord{\left/ {\vphantom {1 {h_{k}^{2} }}}\right.\kern-\nulldelimiterspace}\!\lower0.7ex\hbox{${h_{k}^{2} }$}}{\raise0.7ex\hbox{$1$} \!\mathord{\left/ {\vphantom {1 {h_{l}^{2} }}}\right.\kern-\nulldelimiterspace}\!\lower0.7ex\hbox{${h_{l}^{2} }$}}} ={{r_{{y_{k} y_{l} }} } \over {\sqrt {h_{k}^{2} h_{l}^{2} } }}={{r_{{y_{k} y_{l} }} } \over {h_{k}^{{}} h_{l}^{{}} }}$$
. Then V matrix becomes:
 $${\bf V}=\left[ {\matrix{ {\sigma _{{y_{1}^{{}} }}^{2} } & {\sigma _{{y_{1}^{{}} y_{2}^{{}} }} } & {\sigma _{{y_{1}^{{}} y_{3}^{{}} }} } & {....} & {\sigma _{{y_{1}^{{}} y_{m}^{{}} }} } \cr {\sigma _{{y_{2}^{{}} y_{1}^{{}} }} } & {\sigma _{{y_{2}^{{}} }}^{2} } & {\sigma _{{y_{2}^{{}} y_{3}^{{}} }} } & {....} & {\sigma _{{y_{2}^{{}} y_{m}^{{}} }} } \cr {...} & {...} & {...} & {....} & {...} \cr {...} & {...} & {...} & {....} & {...} \cr {\sigma _{{y_{m}^{{}} y_{1}^{{}} }} } & {\sigma _{{y_{m}^{{}} y_{2}^{{}} }} } & {\sigma _{{y_{m}^{{}} y_{3}^{{}} }} } & {....} & {\sigma _{{y_{m}^{{}} }}^{2} } \cr } } \right]=\left[ {\matrix{ {{1 \over {h_{1}^{2} }}} & {{{r_{{y_{1} y_{2} }} } \over {h_{1}^{{}} h_{2}^{{}} }}} & {{{r_{{y_{1} y_{3} }} } \over {h_{1}^{{}} h_{3}^{{}} }}} & {....} & {{{r_{{y_{1} y_{n} }} } \over {h_{1}^{{}} h_{n}^{{}} }}} \cr {{{r_{{y_{2} y_{1} }} } \over {h_{2}^{{}} h_{1}^{{}} }}} & {{1 \over {h_{2}^{2} }}} & {{{r_{{y_{2} y_{3} }} } \over {h_{2}^{{}} h_{3}^{{}} }}} & {....} & {{{r_{{y_{2} y_{n} }} } \over {h_{2}^{{}} h_{n}^{{}} }}} \cr {...} & {...} & {...} & {....} & {...} \cr {...} & {...} & {...} & {....} & {...} \cr {{{r_{{y_{n} y_{1} }} } \over {h_{n}^{{}} h_{1}^{{}} }}} & {{{r_{{y_{n} y_{2} }} } \over {h_{n}^{{}} h_{2}^{{}} }}} & {{{r_{{y_{n} y_{3} }} } \over {h_{n}^{{}} h_{3}^{{}} }}} & {....} & {{1 \over {h_{n}^{2} }}} \cr } } \right]$$
As V and C are directly dependent on the genetic parameters, these matrices can be derived directly from Table 1 to build the desired index.
(b) Computation of p eq : equivalent weights.
On the other hand, to analyse the consequences of applying the reference weights on the performances instead of genotypes, the equivalent relative economic values were also computed (p
eq
). In this case, b is fixed to a particular set of values and they are not more unknown (for instance, 50% for FD and 50% for CV), and equivalent economic values in p
eq
are derived such that:
 $${\bf b'}={\bf p}_{{eq}} {'\bf CV}^{{{\bf {-}1}}} \Rightarrow{\bf b'}\left[ {{\bf CV}^{{{\bf {-}1}}} } \right]^{{{\minus}1}} ={\bf p}_{{eq}} {\bf '}\Rightarrow{\bf p}_{{eq}} {\bf '}={\bf b'VC}^{{{\bf {-}1}}} $$
. As before, coefficients in p
eq
were expressed in % over the sum of their absolute values to help in their interpretation.
Proportional expected genetic responses
Since 2007, PACOMARCA experimental ranch carries out artificial selection based on breeding values obtained via BLUP (Morante et al., Reference Morante, Goyache, Burgos, Cervantes, Pérez-Cabal and Gutiérrez2009), combining the different traits according to their interest. However, as the traits are genetically correlated, selection response on each trait involves changes in other traits. Therefore, genetic responses have been obtained by weighting, for each of the traits, all those responses obtained in the correlated selected traits including the own direct genetic response for itself. Thus, assuming the breeding values known with certainty, and under the above assumption about all the additive genetic variances being one, the direct genetic response would be the square root of the heritability times the selection intensity (i), and the correlated response would be the square root of the heritability of the measured trait times the genetic correlation times the selection intensity. Gathering this information into a matrix expression the cumulated genetic responses will be obtained by:
 $${\bf t}={\bf p'T}{i} ={\bf p'}\left[ {\matrix{ {h_{1} } & {r_{{u_{1} u_{2} }} h_{1} } & {r_{{u_{1} u_{3} }} h_{1} } & {....} & {r_{{u_{1} u_{2} }} h_{1} } \cr {r_{{u_{1} u_{2} }} h_{2} } & {h_{2} } & {r_{{u_{1} u_{2} }} h_{2} } & {....} & {r_{{u_{1} u_{2} }} h_{2} } \cr {...} & {...} & {...} & {....} & {...} \cr {...} & {...} & {...} & {....} & {...} \cr {r_{{u_{1} u_{2} }} h_{n} } & {r_{{u_{1} u_{2} }} h_{n} } & {r_{{u_{1} u_{2} }} h_{n} } & {....} & {h_{n} } \cr } } \right]i$$
where each t k in t is the cumulated genetic response in the trait k and h k the squared root of the heritability of the k trait. For the computations of analysis of responses, results will be shown assuming a selection intensity of one across the paper as this will be a constant that will lead to comparable relative results. To discuss the relationship between expected and realized genetic gains, breeding values were obtained with the updated data set by fitting the model by Cervantes et al. (Reference Cervantes, Pérez-Cabal, Morante, Burgos, Salgado, Nieto, Goyache and Gutiérrez2010) standardized to have a mean value of 100 and an s.d. of 20 and were averaged within years of birth and plotted.
Results
Weighting traits
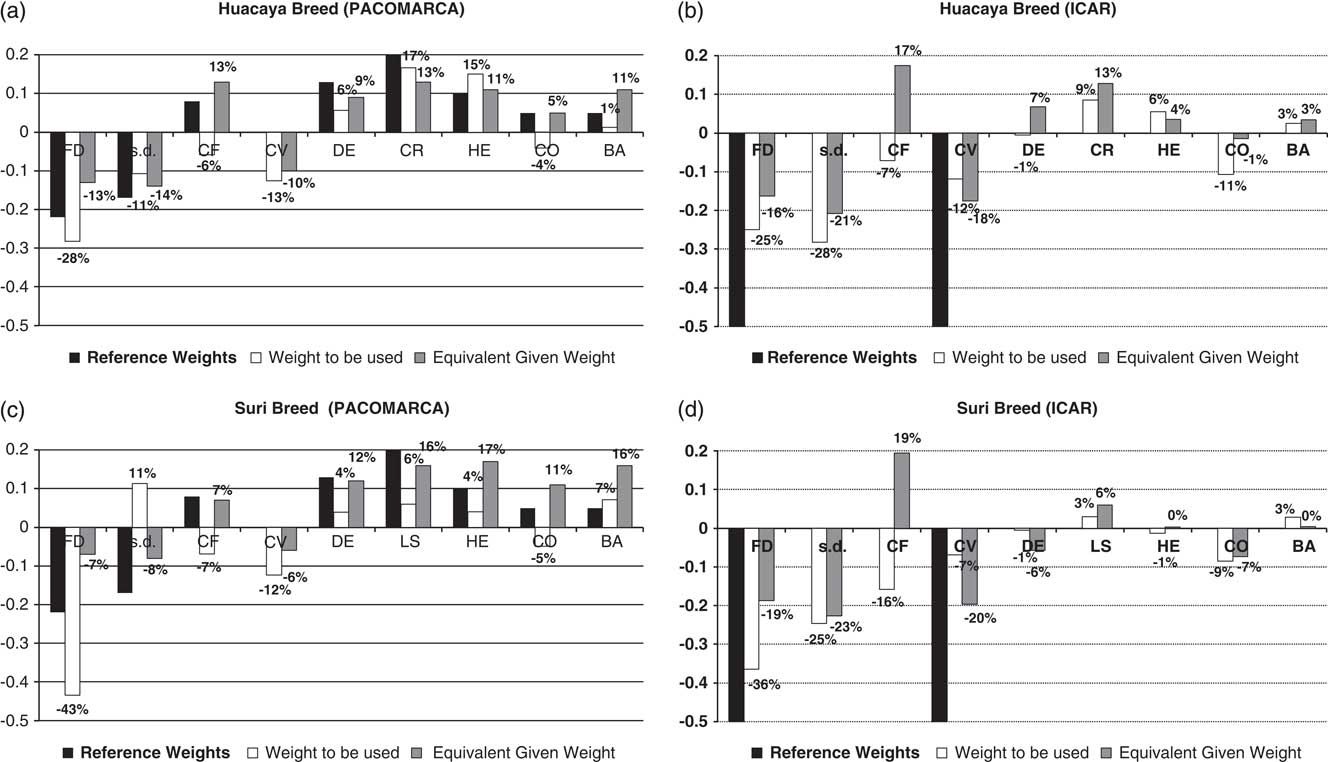
Figure 1 shows the comparison between PACOMARCA and ICAR reference weights and the results involving weights based on selection index, which will be used to obtain the desired relative improvement (i.e., b) and the equivalent economic values in the function objective if the reference weights were applied on the performances (i.e., p eq ) in both HU and SU ecotypes. When PACOMARCA reference weights were targeted (Figure 1a and c), the sign of weights to be given on the selection index generally agreed, excepting CF and CO traits in both ecotypes, and importantly also s.d. in SU ecotype. However, some differences can be observed. Some important traits, such as FD, should have been more weighted to the detriment of s.d. (particularly in SU ecotype). In addition, whereas CV is not considered in the economic objective, it seems as important as s.d. in the index. The relative importance between fibre and morphological traits for the PACOMARCA reference weights is 47% and 53%, respectively. However, in the index become, respectively, 58% and 42% in HU ecotype, and 74% and 26% in SU ecotype, which reveals how much of the performances in morphological traits are determined by the fibre traits, particularly in SU ecotype. If the ICAR reference weights were of concern (where only FD and CV are considered), the relative importance of these two traits in the index was 37% (HU ecotype) and 43% (SU ecotype). In this situation, the ratios between fibre and morphology were 70 : 30% and 83 : 17% for HU and SU ecotypes, respectively (Figure 1b and d). An important fact to be highlighted is the need of weighting CF negatively, regardless of the ecotype and reference weights, even though it is negatively correlated, both genetically and phenotypically, with s.d., CV and FD, and it had a positive weight (8% in PACOMARCA reference) or null weight (ICAR reference). Concerning morphological traits, CO is the only one that has to be negatively weighted in the index in all circumstances even when this weight was low, when, again, it had positive (5% in PACOMARCA reference) or null (ICAR reference) importance in the objective function.
Reference weights for PACOMARCA (suggestions by textile industry) and ICAR (first two traits in the list recommended by ICAR 2012 guidelines), weights to be used on selection index to obtain the desired relative improvement, and the equivalent economic values in the function objective if the reference weights were applied on the performances, for Huacaya and Suri ecotypes.

Equivalent economic values
If genetic and phenotypic correlations among traits were ignored by weighting the traits, such as if they were not correlated when they really are, expecting a proportional selection response, the equivalent economic values in the aggregated genotype would be fortunately all in the same sign than those applied on the performances. In the case of ICAR reference weights, the ignored traits become important up to, for example, 21% (s.d.), 17% (CF) and 13% (CR) in HU ecotype, and 23% (s.d.) and 19% (CF) in SU ecotype. Assuming no interest on other traits than FD and CV (as in the reference weights), their relative importance was still roughly equally weighted, being 47% for FD and 53% for CV in HU ecotype, and 49% FD and 51% CV in SU ecotype. If PACOMARCA reference weights were accounted for, and ignoring CV which is not of interest in PACOMARCA, the change in relative importance of those traits between the reference and the index ranged between 1 and 7 points of percentage in HU ecotype, resulting in 45% fibre and 55% morphology (22% to 15% for FD, 17% to 15% for s.d., 8% to 15% for CF, 13% to 10% for DE, 20% to 15% for CR, 10% to 12% for HE, 5% to 6% for CO and 5% to 12% for BA), which are important but not marked changes with respect to the reference weights. Nevertheless, if SU ecotype is equally analysed and summing up within fibre and morphological traits, their relative importance becomes 24% fibre and 76% morphology from 47% and 53%, respectively.
Proportional expected genetic responses
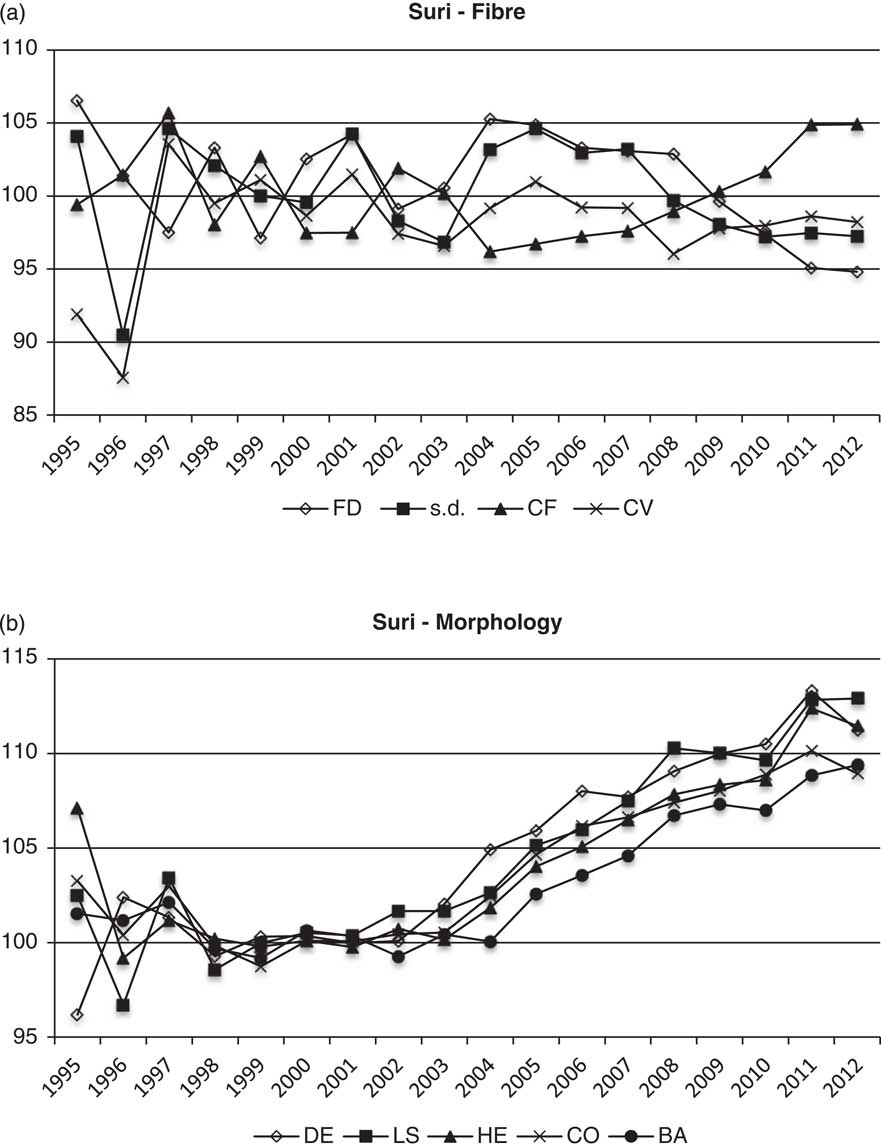
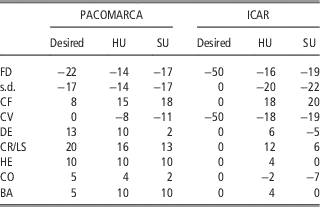
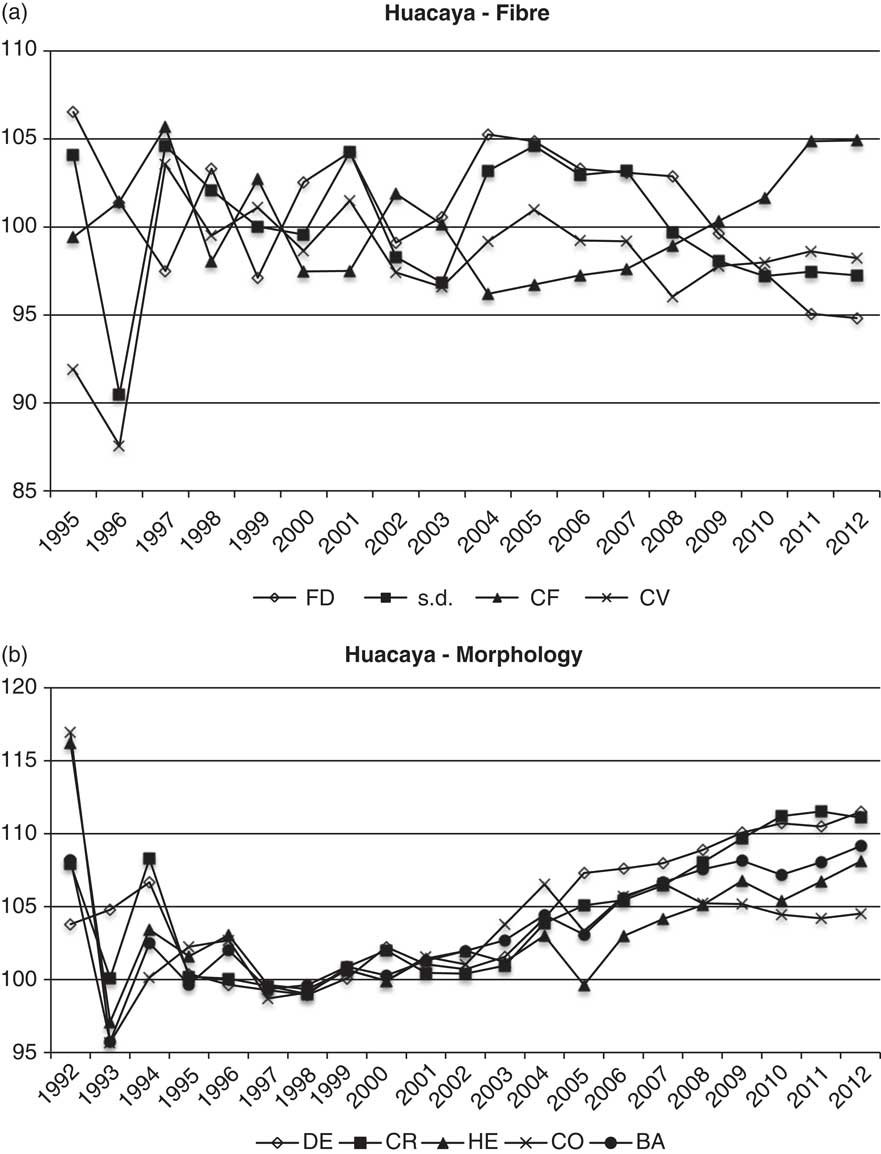
Table 3 shows the comparisons between PACOMARCA and ICAR reference weights and the expected genetic responses within trait in HU and SU ecotypes. Regardless of the ecotype, when ICAR reference weights are applied, and accounting with all the traits, the proportional expected genetic responses of s.d., trait assumed without interest, becomes the highest among all traits with a success of roughly 20%. As expected, the genetic response in morphological traits was low (between 0% and 12%), being in the undesired direction for CO in both ecotypes and also negative for DE in SU ecotype. Although only FD and CV are of concern in ICAR reference weights, looking only at these traits, fortunately the proportional expected response would be roughly balanced in both ecotypes. When PACOMARCA scenario was analysed, and accounting for all the traits, including CV, the proportional expected responses were similar to those desired in HU ecotype, change in the absolute value from 22% to 14% for FD, 17% to 14% for s.d., 8% to 15% for CF, 0% to 8% for CV, 13% to 10% for DE, 20% to 16% for CR, 10% to 10% for HE, 5% to 4% for CO and 5% to 10% for BA. If CV is not considered, then the change was from 22% to 15% for FD, 17% to 15% for s.d., 8% to 16% for CF, 13% to 11% for DE, 20% to 17% for CR, 10% to 10% for HE, 5% to 4% for CO and 5% to 11% for BA. In discussing more of the SU ecotype, this scenario is not worth because all results were very similar. Only in this case note that CO, and especially DE, would be affected by changing their relative weight from 5% to 2% and from 13% to 2%, respectively. Figure 2 shows the genetic trends plotted by averaging standardized breeding values of HU ecotype in fibre (Figure 2a) and morphological (Figure 2b) traits. From 2004, global trend was in the desired direction for all traits, except that for CO which is stable but descending in the last few years unless desired. Figure 3 shows the same information for SU ecotype. Global trends were all also in the desired direction from 2004, but in this ecotype they were stronger for morphological traits and lower for fibre traits.
Genetic trends by averaging standardized breeding values of Huacaya ecotype in fibre (a) and morphological (b) traits.
Genetic trends by averaging standardized breeding values of Suri ecotype in fibre (a) and morphological (b) traits.

Relative desired responses and expected genetic responses in percentage for PACOMARCA (suggestions by textile industry) and ICAR (first two traits in the list recommended by ICAR 2012 guidelines identically weighted) in Huacaya and Suri ecotypes

FD=fibre diameter; s.d.=standard deviation; CF=comfort factor; DE=density; CR=crimp; LS=lock structure; HE=head; CO=coverage; BA=balance.
Discussion
PACOMARCA experimental ranch has recently been doing a deep research effort to optimize the genetic economic gain of their animals (Gutiérrez et al., Reference Gutiérrez, Goyache, Burgos and Cervantes2009 and Reference Gutiérrez, Varona, Pun, Morante, Burgos, Cervantes and Pérez-Cabal2011; Morante et al., Reference Morante, Goyache, Burgos, Cervantes, Pérez-Cabal and Gutiérrez2009; Cervantes et al., Reference Cervantes, Pérez-Cabal, Morante, Burgos, Salgado, Nieto, Goyache and Gutiérrez2010; Pérez-Cabal et al., Reference Pérez-Cabal, Cervantes, Morante, Burgos, Goyache and Gutiérrez2010; Paredes et al., Reference Paredes, Membrillo, Gutiérrez, Cervantes, Azor, Morante, Alonso, Molina and Muñoz-Serrano2013), and has implemented a strict genetic selection on their animals looking for a desired proportional improvement of some determined traits. As a consequence, success has been globally observed both in the performances and in the genetic trends, but this success has not been obtained in the expected proportionality. Given the recognized difficulties known to compute realistic economic weights, these are not usually computed. Instead, those weights are decided by the responsible of the breeding programme in light of the more defective traits, which usually are under this state as a consequence of their genetic evolution because of the past decisions in the weights to be applied to the different traits. These situations could have been anticipated. In this study, a methodology based on the selection index theory by Hazel and Lush (Reference Hazel and Lush1943) has been developed for the first time to standardize the weights to be used as economic weights in the index, and to study relative genetic responses starting from genetic parameters such as heritabilities and genetic and phenotypic correlations. Inverse transformations have also been developed for better use of relative weights, showing the consequences of applying relative weights on the performances instead of breeding values. In addition, the aggregated genetic response on each trait assessed directly from genetic parameters has been developed for the first time. The methodology has been essayed in the PACOMARCA data set using the genetic parameters equivalent to those by Cervantes et al. (Reference Cervantes, Pérez-Cabal, Morante, Burgos, Salgado, Nieto, Goyache and Gutiérrez2010), but updated using the whole data set at the end of 2012. It should be remarked that, under the developed methodology, the heritabilities and genetic correlations are assumed to be exactly known without uncertainty. However, they are not the true values, but their estimates are known to be estimated with some uncertainty, particularly the genetic correlations. Therefore, it should be recommended to periodically update all the parameters provided here.
Two approaches have been used. In the first one, the relative importance of the traits in the aggregate genotype was taken into account to derive the appropriate weights of the traits in the selection index; that is, the breeder should decide the weights of the index to be applied on the performances. Theoretically, economic weights mean the importance of each trait on goal and setting, along with the economic importance of trait, their scale and their variability. As all the traits are under this methodology on the same scale and variability by considering all the additive genetic variances being one, the comparison between different weights allows to directly determine the relative importance of each one. The resulting values inform about how much a trait should be proportionally selected related to each other to obtain the desired relative weights as defined in the aggregated genotype by the economic weights. Therefore, their relative importances are easily assessed as they are all on the same scale. Under this approach, a trait-weighted null is understood as not providing increase or decrease in economic gain and it should be freely modified by indirect selection. Conversely, the equivalent economic values were computed, assuming that individuals were being selected using those weights directly applied on the performances. Now in the inverse approach, reference weights were used directly on the performances to create a hypothetical index and then the equivalent economic values in the aggregated genotype were computed. These equivalent economic values reflect how the genetic components of traits were actually being weighted unless desired as a consequence of applying the weighting on the criteria (performances) instead of the objectives (genetic values).
In a second approach, the obtained integrated genetic responses for each trait were analysed, assuming that selection was carried out on breeding values of all traits weighted according to the reference set of values. Here we can analyse how the relative importance of the traits were modified when ignoring the genetic correlations between them leading to finally different relative desired genetic response. To essay the methodology, two sets of reference weights have been chosen to emulate real situations (Table 2).
ICAR reference weights
This set of weights is inspired in the ICAR recommendations (ICAR, 2012) that suggested FD and CV as the two first traits to be recorded, and across this manuscript it represents a breeder that decides selecting equally for both traits. The interest for both traits is reducing them; therefore, −50% was applied to each of them. Under this scenario, if all the traits were recorded, selection index theory reports that the trait to be highly weighted in HU ecotype should be s.d. (−28%), in which the breeder is not theoretically interested, with CO being negatively weighted (−11%) and almost, to the same extent, one of the target traits, CV (−12%). CO trait is assumed not to be important for this particular breeder, but this proceeding probably will conduct to worsening this trait. The same trend was observed in SU ecotype, but in this case FD (−36%) was highly weighted than s.d. (−25%), a different weighting of the two target traits in the index but equally important in the objective. According to the index, FD should have to be weighted more than twice in HU ecotype (−25% v. −12%), and five times in SU ecotype (−36% v. −7%). Moreover, to cite the most relevant traits, CF, which is of highly importance for the textile industry, would have a negative weight in both ecotypes (−7% in HU ecotype and −16% in SU ecotype). It must be noted that the application of the methodology can result in unexpected weighting of the different traits; however, if economic weights are believable, the user has to be blind to the weighting in the index. Next we have to see what will happen if the desired weights were directly applied on the performances while believing they are being applied on the genetic value. If looking only at the two traits presented at the objective, the equivalent proportional value remains similar in both ecotypes and therefore without serious implications. However, the breeder will easily realize that the other two fibre traits, highly correlated with FD and CV, had a similar or even higher importance in the real objective. The morphological traits are also involved but not in a real important magnitude.
Concerning the approach studying the proportional expected genetic response, when compared with the proportional desired responses addressed by the economic weights, the drawn conclusions were almost identical to those coming from the inverse approach above. Therefore, some ignored traits in the set of reference weights, such as s.d. and CF, are strongly modified by indirect genetic selection, and also morphological traits are roughly unmodified, with CO being the most negatively committed trait.
PACOMARCA reference weights
The performance of these methodologies has also been studied in the PACOMARCA scenario. In this experimental farm, artificial selection has been carried out based on performances since 2003 and from BLUP breeding values since 2008. Since 2003, mates are not exactly designed according to a synthetic index, but roughly searching animals according to their defined relative importance. Each mating tries to improve the lesser characteristic with the best suitable particular mate for that trait. Obviously, phenotypic information was available at this point and it could have been influencing while designing matings. One additional point of uncertainty is that, although reference weights are defined for both ecotypes, they are not exactly bred with the same objectives. Thus, HU animals are in greater number and are intended preferably for textile industry, whereas SU animals, besides being less, have a different textile objective. Consequences of such mating management are commented on the light of the genetic parameters, the results of the selection index, the expected genetic responses analyses and the realized genetic trends. As this is a real scenario with many more involved traits, monitoring links among traits is not straightforward. Thus, the discussion has been tackled globally.
Focusing on the fibre traits, CV was ignored in the profit function, but its strong relationship with the other three traits of these groups led to become as one of the most important. Then, although it is not accounted for when selecting animals, its negative (favourable) genetic trend appeared clear in both breeds from 2003. An interesting detail about the implications of not including CV in the index is found in its unsteady genetic trend that finally depends on those relatives of the FD and s.d. traits defining CV. Thus, for example, CV greatly increased from 2008 to 2009 in HU ecotype, given that the decrease in s.d. between those years was very low when compared with the correspondent of FD. Concerning morphological traits, CO was the biggest loser. The farm responsible claimed that animals were worsening for this trait, even when they had put some weight to improve it. In fact, it was the trait with the lowest trend, being negative in many years, particularly in HU ecotype. The explanation comes from some hidden relationship with other traits with much more weight in the aggregated genotype. It must be noted that the CO performance should have to be negatively weighted to globally gain if the breeder really believes in the applied economic weights. However, the breeder could have been interested in modifying those economic weights. Anyway, note that this result could have been advanced if these computations had been carried out before. Thus, these analyses might help breeders realize that they were in fact interested in some ignored objectives and using index allows a better response on economic objective.
Assuming a unique set of desired PACOMARCA weights to be applied in both HU and SU ecotypes, when looking at the observed genetic trends, it seems that morphological and fibre traits have similarly evolved for HU ecotype. However, morphological trend seems to have been stronger than fibre traits in SU type. It probably could have been predicted if the genetic parameters were known to give the equivalent economic weights, summed up to 45% fibre and 55% morphology in HU ecotype but 24% fibre and 76% morphology in SU ecotype when the hypothetical weights in both ecotypes were 47% fibre and 53% morphological. As a consequence, blinding the relationships between traits, the breeder was surprised by the different successes in the two ecotypes when mating was designed equally in both.
A joint analysis involving genetic parameters together with all the approaches essayed here and the real current genetic trends is rather complex. For example, CF should have to be negatively weighted in both sets of economic weights and both ecotypes if the index was properly used. However, the genetic trend of CF was good because of a very high genetic correlation with FD, which had a much higher heritability value and the highest importance defined. It can be confirmed when no phenotypic correlations were account as when analysing expected responses, showing that CF was the most favoured trait. This relationship does not exist between CO and other traits, leading to its negative expected response in some cases and its undesired current genetic trend. Another interesting point was found when weights were applied on performances instead of genetic values, showing that undesired responses never occurred but relative importance of traits greatly changed. In this case, genetic progress slows down but it exists. And finally, if genetic trends were available, some new reconsidering of weights was possible, helping to define the relative importance in the dynamic breeding scheme of this farm.
The proposed methodology has been shown to be an effective proceeding to study the relative importance granted by the manager of a breeding scheme to the aggregated genotype. Implementing it in a spreadsheet is straightforward so that the breeder can interactively essay by checking different sets of weights to immediately ascertain the feedback of the expected consequences in the genetic response for each trait. Thus, the results shown here have been of great utility to the responsible of managing the breeding in PACOMARCA experimental ranch, but they have to be seen as an example for any other populations under genetic improvement. The number of possible combinations of involved traits are infinite, and thus in this paper only two relevant sets of weights have been essayed; however, as introduced above, the methodology can easily be implemented in a spreadsheet to probe different situations. Some of them helping to disentangle the hidden genetic and non-genetic relationships among traits are, for example, selecting sequentially only for each of the traits, only a group of highly correlated traits or by assigning identical weight for all traits.
Direct selection from combinations of traits used as a selection criterion does not necessarily result in an improvement in the same traits and in the same desired proportions. The importance defined by the relative weights applied to the objective traits in a selection index are currently decided in a rough manner, and therefore the relative weights of the traits should alternatively be monitored in the sense presented in this study that allows anticipating the correlated responses. In the particular case of alpacas, special attention should be paid to the relationships between some of the traits, as the selection made with the intention of improving a particular group may adversely affect others. Given the high individual economical value attributed to some animals, the long time needed to gather enough pedigree and performance information from the screening of some animals for breeding, and the availability of a predicted breeding value for them makes this tool valuable to predict the behaviour of the traits in an aggregated genotype. It will be of great applicability and it can complement and refine, if necessary, the evaluations obtained by traditional methods.
Acknowledgement
Authors are indebted to the staff of the Pacomarca experimental farm.