Implications
Ruminant livestock production in tropical regions is mainly based on grazing on natural grasslands. Sustainable production in such areas requires that the nutritional status of animals is adequately monitored, thus providing an objective basis for various management decisions such as optimum allocation of forage to different types of animals, selection of animals compatible with the forage resource, selection of species for reseeding deteriorated ranges, as well as designing appropriate supplementation strategies. The importance of the present findings is that n-alkanes and their carbon isotopic composition can be used as markers for the indirect estimation of feed intake, diet composition and nutrient digestibility of grazing animals.
Introduction
In extensive agro-pastoral systems rangelands are the main sources of nutrition for domestic and wild herbivores. In Ethiopia, about 62% of the total land mass is classified as arid and semi-arid and mainly used for livestock production based on grazing (Kassahun et al., Reference Kassahun, Snyman and Smit2008). Proper management of grazing animals is important to maintain sustainable range resource utilisation in such areas (Bailey et al., Reference Bailey, Dumont and WallisDeVries1998).
Naturally, free-ranging herbivores grazing on diversified plant communities exert different levels of selection to optimise their nutrient intake (Prache et al., Reference Prache, Gordon and Rook1998). Understanding the type of plant species selected by the animal and the contribution of each species to the total intake could give an insight into the nutritional status of the animal and offer a feasible range management strategy to optimise resource utilisation (Dumont et al., Reference Dumont, Carrere and D’Hour2002). However, measurement of feed intake, diet composition and nutrient digestibility in free-ranging animals remains a challenge in nutritional studies because of the inherent errors associated with the methods that are used at present (Dove and Mayes, Reference Dove and Mayes1991; Mayes and Dove, Reference Mayes and Dove2000).
The use of plant wax components, mainly n-alkanes, as markers for the estimation of intake and diet composition of herbivores has evolved in the last two decades (Dove and Mayes, Reference Dove and Mayes2005; Ferreira et al., Reference Ferreira, Garcia, Rodrigues, Celaya, Dias-da-Silva and Osoro2007). N-alkane profiles of plants show distinct differences between species and, to some extent, between plant parts of the same species. In addition, they have high recovery rates in the faeces of herbivores (Ferreira et al., Reference Ferreira, Celaya, Garcia, Rodrigues and Osoro2009), offering an opportunity to reconstitute the diet of the herbivore from the faecal patterns of these compounds (Dove and Mayes, Reference Dove and Mayes1996; Bugalho et al., Reference Bugalho, Dove, Kelman, Wood and Mayes2004). Validation experiments revealed the potential of using n-alkanes to estimate intake, diet composition and nutrient digestibility of individual animals (Monks et al., Reference Monks, Payton and Efford2005; Oliván et al., Reference Oliván, Ferreira, Celaya and Osoro2007a).
Although validation experiments using n-alkanes produced good estimates with less complex vegetations, grouping of species or use of other markers in addition to n-alkanes was necessary for the correct estimation of diet composition of herbivores grazing botanically diverse vegetation (Oliván et al., Reference Oliván, Ferreira, Garcia, Celaya and Osoro2007b). Stable carbon isotopic (13C) composition of plants has been used to estimate the proportion of C3 and C4 plants in the diet of herbivores (Bennett et al., Reference Bennett, Hammond, Williams, Chase and Kunkle1999). Garcia et al. (Reference Garcia, Holmes, Hodgson and Macdonald2000) reported that the use of a combination of the n-alkanes and 13C composition of the organic matter of feeds could increase the accuracy of estimation of diet compositions in cows. However, so far, the 13C of n-alkanes has not been evaluated as an additional marker together with the alkane profiles themselves. Currently, the possibility of separating organic compounds of interest prior to isotope ratio analysis using gas chromatography (GC)–combustion isotope ratio mass spectrometry provides an opportunity to consider the 13C of n-alkanes rather than the whole organic matter. The latter would improve the reliability of isotopic techniques, as plant compounds that are stable both in herbage and in faeces can be specifically targeted for isotope analysis.
There is little information about the plant wax profiles of native pasture species in Ethiopia for application in nutritional assessments of grazing animals. The aims of this study were: (1) to describe the n-alkane profiles of pasture species commonly available in the Mid Rift Valley rangelands of Ethiopia, (2) to determine the stable carbon isotope enrichment of individual n-alkanes for each pasture species and (3) to evaluate the potential for using the two markers to estimate the diet composition of free-ranging herbivores.
Material and methods
Description of study site
The research area lies in the Mid Rift Valley region of Ethiopia extending from 7°30′N to 8°00′N and from 38°35′E to 38°45′E. The area is classified as semi-arid with an annual rainfall ranging from 500 to 700 mm/annum (Ministry of Agriculture (MoA), 2000). The rainfall pattern is bimodal with short rains from March to May, followed by the main wet season from July to October. The mean annual minimum and maximum daily temperature ranges between 11.4°C and 26°C. The grazing lands exhibit typical savannah woodland vegetation with a scattered population of acacia trees and broadleaved shrubs. Cattle are the dominant livestock in the area followed by goats. Natural pasture is the main source of feed, supplemented by agricultural crop residues (Central Statistical Agency (CSA), 2007).
Plant sampling and processing
A total of 23 commonly available pasture species were collected from the study area during the months of July and August, 2008. For the collection of samples, several transect walks covering 15 km of length were conducted across both enclosed and communal grazing lands. Whole-plant pasture species were sampled from various locations along the transects by cutting at a height of 5 cm from the ground. The sampling was done at the time of the flowering stage for all the species. After harvesting, the biomass sample of the individual species was coded and stored in a pollen bag, while a specimen for each species was placed in a plant press for species confirmation in a herbarium. On average, a species was sampled from about 20 sites. Biomass samples of the same species collected from different sites were pooled to a sample before drying. The samples were dried in a forced air oven at 60°C for 48 h. The dried samples were ground to pass through a 1 mm sieve size (Thomas Wiley Lab mill, Model 4, Philadelphia, USA), and afterwards pulverised using a bullet mill (MM 2000; 4 min at 80 Hz; Retsch Technology GmbH, Haan, Germany) before analysis of n-alkane concentrations and 13C enrichment of alkanes.
Chemical analysis
The chemical analysis was conducted at the laboratory of the Animal Nutrition Group of Wageningen University, the Netherlands. N-alkane extraction and analysis were carried out as described by Mayes et al. (Reference Mayes, Lamb and Colgrove1986), with modifications by Salt et al. (Reference Salt, Mayes and Elston1992) and tetratriacontane (C34) was used as an internal standard. The extracted samples were analysed for n-alkanes (C27 to C36) using a GC (Carlo Erba HRGC Mega 2 series, CE Instruments, Milan, Italy) fitted to a flame-ionising detector, using helium as the carrier gas. The column was a 40 m × 0.32 mm (i.d) fused silica capillary (SPB-1) with 0.10 μm film thickness. A split-type injector was used, with a split ratio of 1 : 10. The temperature for both the detector and injector was 340°C (temperature program: 1 min at 210°C, increase at 7.2°C/min to a temperature of 300°C, 6 min at 300°C). Chrom Card Data System 2.2 (Thermo Finnigan, Waltham, MA, USA) software was used to calculate peak areas. The data were transferred to an Excel spread sheet to calculate alkane concentrations according to the following formula:

where IS wt is the weight of the internal standard, SDW is sample dry weight and SRFi is the standard response factor for alkanei, calculated as area % alkanei in the mixed standard divided by weight % alkanei in the mixed standard.
Using the same alkane extracts, the carbon isotope composition of the alkanes was determined by fitting a GC (Finnigan_MAT, TraceGC Ultra, Milan, Italy) with a split/splitless injector operated in split mode (split ratio 1 : 10), to a combustion interface (Finnigan_MAT Combustion interface III, Bremen, Germany), which was connected to an elemental analyser isotope ratio mass spectrometer (Finnigan_MAT CN, Bremen, Germany). Full-base line separation of all individual alkanes was achieved by fitting the TraceGC with a capillary column as described earlier and using helium as carrier gas. The temperature setting of the column was identical to that described earlier. The isotope ratio of the alkanes was calculated in terms of conventional delta values (δ13C) as follows:

where, Rsample is the abundance ratio of 13C to 12C in the plant sample, and Rstandard is the abundance ratio of 13C to 12C in the standard sample (Vienna Pee Dee Belemnite, PDB).
Data analysis
Principal component analysis (PCA) was used to explore the pattern of n-alkane profiles and 13C enrichments of alkanes across the species. The correlation matrix was used for the calculation, after the data was mean-centred and standardised. The first two principal components (PC1 and PC2) were plotted graphically where points on the graph represent plant species. The distance between species in the scatter plots is an indication of the difference in marker profile between the species. The species that are positioned close together in the scatter plots are the ones with a similar marker profile. On the other hand, the species that are placed far apart are expected to have large differences in their marker profiles.
The principal components for the two groups of markers were compared by orthogonal procrustes rotation (OPR) to assess the similarity between the two data sets in describing the species identities. The PCA coordinates based on n-alkanes were used as fixed values, and those based on 13C were used as fitted values. The OPR procedure rotates the fitted PCA axes to match the fixed axes, minimising the residual sum of squares between the two PCA configurations. The magnitude of unexplained residual variance after OPR indicates the extent to which the two PCA configurations differ from one another. The two data sets were again examined together by employing redundancy analysis (RDA), in which the PCA based on the alkane profile was constrained by 13C enrichments of n-alkanes and then the dispersion of species was presented in a two-dimensional space. Data were analysed using GenStat for Windows (11th edition).
Results
Alkane concentrations
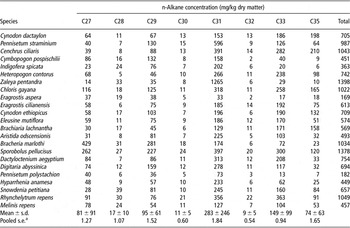
The n-alkane concentrations (C27 to C35) in the pasture species collected from the grazing lands are shown in Table 1. The odd-chain alkanes were found in much higher concentrations than the even-chain alkanes. The even-chain alkane C36 was excluded from the results as the values for most of the species were within the range of the analytical error of the GC. In most species, C31 was the most abundant odd-chain alkane, ranging from 33 mg/kg dry matter (DM) in Eragrostis aspera to 1265 mg/kg DM in Zaleya pentandra with a mean concentration of 283 ± 246 mg/kg (mean ± s.d.) DM across the species. This was followed by C33, which ranged from 13 mg/kg DM in Pennisetum polysachion to 363 mg/kg DM in Rhynchelytrum repens with a mean concentration of 149 ± 98 mg/kg DM for all the species. While alkane C35 was abundant in some species (e.g. Cenchrus ciliaris, Cynodon dactaylon), it was found in very low concentration in Indigofera spicata, Cymbopogon pospischilii and Pennisetum polystachion. The sum of C27 to C35 concentrations showed large between-species variation, ranging from 169 mg/kg DM in E. aspera to 1398 mg/kg DM in Z. pentandra.
n-Alkane concentration for pasture species collected from the Mid Rift Valley rangelands of Ethiopia

aPooled s.e. of measurement.
Carbon stable isotope composition of alkanes
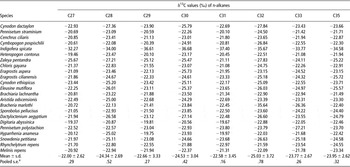
The stable isotope enrichment of carbon (δ13C) for individual n-alkanes (Table 2) showed a wide variation, ranging from −19.37‰ (Digitaria abyssinica) to −37.40‰ (I. spicata). The lowest level of enrichment was observed in I. spicata, which was the only legume species in the collected samples, followed by that of Z. pentandra (a non-legume forb). The other grass species showed higher levels of enrichment, but differences could be observed between species. Regarding the delta values of individual alkanes, the odd-chain alkanes had a higher level of 13C enrichment by at least one delta unit than the subsequent even-chain alkanes (Table 2). The level of enrichment tended to decrease, in both even- and odd-chain alkanes with increasing carbon number.
Carbon stable isotope (13C) enrichment of n-alkanes for pasture species collected from the Mid Rift Valley rangelands of Ethiopia

aPooled s.e. of measurement.
Principal component and RDA
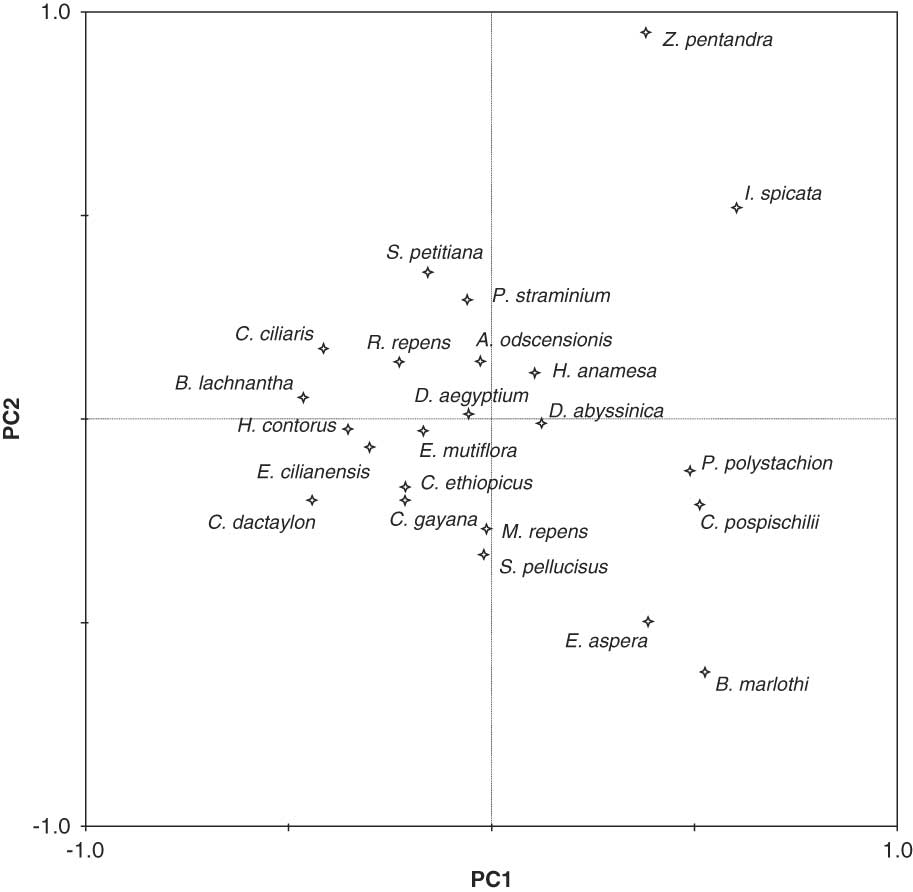
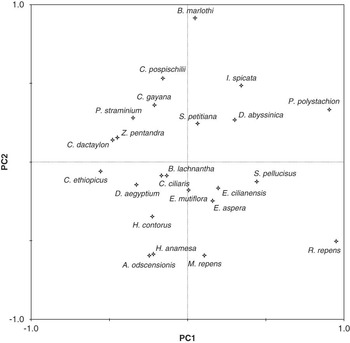
The results of the PCA are shown in Table 3, and Figures 1 and 2. When the PCA was based on n-alkane concentrations, about 91% of the variance between species was explained by the first three principal components (PC1 to PC3). Similarly, when the analysis was based on δ13C values of n-alkanes, 74% of the variance was explained by the first three principal components (Table 3).
The variance (%) in the pattern of n-alkane concentration and δ13C values of n-alkanes explained by the first three principal component axes (PC1, PC2 and PC3) for each data set, and the residual variance (%) remaining after comparison by Orthogonal Procrustes Rotation (OPR) of the two principal component scores

Scatter plot of pasture species on a two dimensional space using the first two principal components (PC1 and PC2) derived from PCA based on the n-alkane concentrations.
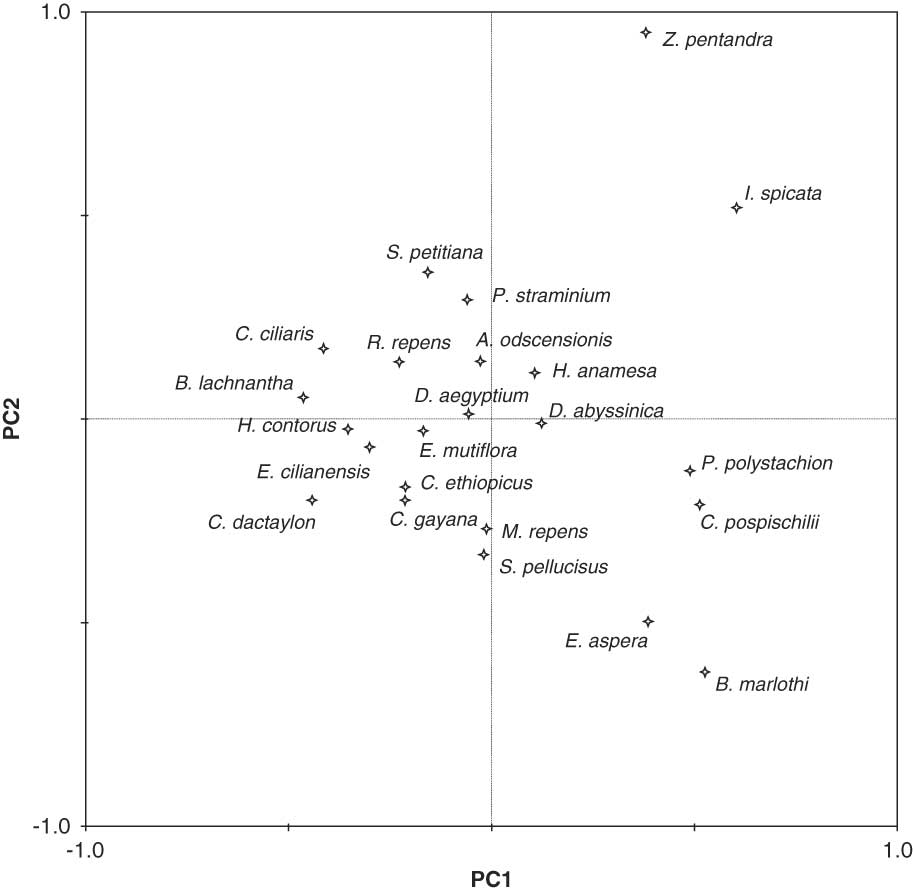
Scatter plot of pasture species on a two dimensional space using the first two principal components (PC1 and PC2) derived from PCA based on δ13C values of n-alkanes.

The scatter plot based on n-alkanes (Figure 1) shows good species separation. For example, Brachiaria marlothi, I. spicata, Z. pentandra and E. aspera scattered widely from the rest of the species. Brachiaria lachnantha, Heteropogon contortus, P. polystachion, C. pospischilii, C. ciliaris and C. dactylon were also separated along the two principal axes. On the other hand, clustering between some of the species, like Chloris gayana and Cynodon ethiopicus was observed. The scatter plot based on the δ13C values of n-alkanes (Figure 2) showed that the species were scattered along the two axes in a different way. On one hand, those species that clustered closer when the analysis was based on n-alkanes (Figure 1), showed wider separation when the analysis was based on δ13C values of n-alkanes (Figure 2). On the other hand, some of the species (e.g. C. dactaylon and Z. pentandra; C. ciliaris and B. lachnantha), which were better separated with the n-alkane data set, showed aggregation with the isotope data set.
The comparison of the species ordinations by OPR revealed that the residual variance remaining after fitting the two PCA scores was 84.7% (Table 3). This indicated little similarity between the two PCA scores and that the majority of the variance explained by δ13C values of n-alkanes was additional to that explained by the n-alkane profile of species.
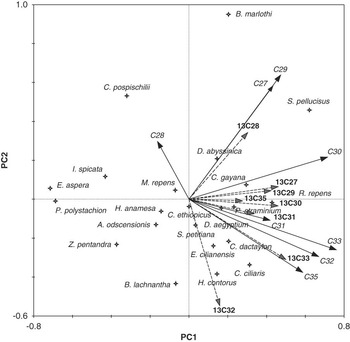
Figure 3 shows a tri-plot of species points and the direction of the steepest increase for n-alkanes profile and δ13C values of n-alkanes in the space of the first two principal axes derived from RDA. As shown in the graph, overlapping or clustering of species points was not observed. Those species that were clustered together in Figure 1 (PCA based on n-alkane) and Figure 2 (PCA based on δ13C values of n-alkanes) appeared separated in Figure 3. On the other hand, those species that had distinct coordinate points in either Figures 1 or 2 remained distinct in Figure 3.
A triplot in the space of the first two principal axes derived from redundancy analysis of n-alkane concentration of species (solid arrows) as constrained by δ13C values of n-alkanes (dashed arrows). The direction of the arrow points towards the steepest increase of the marker it represents.

Discussion
n-Alkane concentrations
The presence of significant variability in the n-alkane profile between plant species has long been documented and this variability is increasingly being used for the indirect estimation of the diet composition of free-ranging herbivores (Dove and Mayes, Reference Dove and Mayes2005; Ferreira et al., Reference Ferreira, Garcia, Rodrigues, Celaya, Dias-da-Silva and Osoro2007). To make effective use of these markers in nutritional studies, however, it is important to document location-specific information on the n-alkane profiles of available herbage species (Ali et al., Reference Ali, Mayes, Hector and Ørskov2005). This is because environmental conditions and geographical locations could influence the pattern of the cuticular wax profile of plant species growing in different places (Samuels et al., Reference Samuels, Kunst and Jetter2008).
In this report, the general trend that odd-chain alkanes exist in higher concentration than even-chain alkanes, conforms with previous findings (Dove and Mayes, Reference Dove and Mayes1996). The dominance of C31 in the pasture species was also consistent with previous reports (Ali et al., Reference Ali, Mayes, Hector and Ørskov2005). This makes it easier to quantify odd-chain herbage alkanes more accurately than even-chain alkanes, and hence their role as a diet composition marker appears indispensable. Although found in small quantities some of the even-chain alkanes, like C30 and C32, have shown high discriminatory potentials (Pueyo et al., Reference Pueyo, De Vega, Askar and Guada2005).
Feed intake estimation using the ratio of a natural odd-chain to dosed even-chain n-alkane in the faeces is another important advantage of the n-alkane method (Mayes et al., Reference Mayes, Lamb and Colgrove1986). One of the requirements for estimating intake accurately using this approach is that the faecal recovery rates of the dosed and herbage n-alkanes should be similar (Dove and Mayes, Reference Dove and Mayes1991). Generally, pairs of n-alkanes with consecutive carbon chain lengths are reported to have similar recovery rates (Mayes and Dove, Reference Mayes and Dove2000). As a result, a combination of either C31/C32 or C33/C32 has been used for this purpose. The present analysis also confirms herbage C31 and C33 alkanes as priority choices for intake estimation together with dosed C32. The alkane C35 could also be used in combination with dosed C36, as it was found in considerable amounts in many of the species (Table 1), and is known to have high faecal recovery rates (Ferreira et al., Reference Ferreira, Celaya, Garcia, Rodrigues and Osoro2009).
The δ13C values of n-alkanes
It is known that all photosynthetic plants discriminate against the natural stable isotope 13C during their CO2 absorption and utilisation. This results in the depletion of 13C in organic tissues, as well as in specific compounds, like n-alkanes, of plants in comparison with the natural abundance (Bendle et al., Reference Bendle, Kawamura and Yamazaki2006). Plants that follow the C3 photosynthetic pathway exhibit a higher level of carbon isotope fractionation than C4 plants (Marshall and Zhang, Reference Marshall and Zhang1994). The resulting difference in carbon isotope composition of the organic matter has been exploited to estimate the gross diet composition of herbivores in terms of the two plant groups (Coates et al., Reference Coates, Schachenmann and Jones1987; Norman et al., Reference Norman, Wilmot, Thomas, Masters and Revell2009).
Differences in carbon isotope fractionation between species that follow the same photosynthetic pathway have also been documented (Ehleringer, Reference Ehleringer1991). However, these differences have not been evaluated as an additional source of plant marker. The main reason for that may be the general assumption that the within-photosynthetic-group variations in carbon isotopic ratio are too small to be used as an additional marker (Osmond et al., Reference Osmond, Allaway, Sutton, Troughton, Queiroz, Luettge and Winter1973).
From previous reports, the δ13C values of n-alkanes range between −30% and −40% for C3 plants and −17% to −24% for C4 plants (Reddy et al., Reference Reddy, Eglinton, Palic, Benitez-Nelson, Stojanovic, Palic, Djordjevic and Eglinton2000). The results of the present analyses largely agree with these ranges of values. I. spicata was the only legume species analysed in this study, and the δ13C values obtained for this species (−32.27% to −37.40%) fall within the range of values observed for C3 plants. This conforms to the established knowledge that in tropical grasslands, legumes are represented by C3 plants (Dove and Mayes, Reference Dove and Mayes2005). The other species that are analysed exhibited a range of carbon isotope enrichment, which is typical of C4 plants (Bendle et al., Reference Bendle, Kawamura and Yamazaki2006), although some of the species like Z. pentandra showed a lower level of enrichment. In this study, the general isotope enrichment level of even- and odd-chain alkanes agrees with the finding of Reddy et al. (Reference Reddy, Eglinton, Palic, Benitez-Nelson, Stojanovic, Palic, Djordjevic and Eglinton2000), who reported that even-chain alkanes were depleted by about –1% compared to the neighbouring odd-chain alkanes. This may suggest that during the biosynthesis of n-alkanes (elongation of carbon skeletons) there is a differential carbon isotopic fractionation.
Multivariate analysis
A variety of multivariate statistical procedures are available to study the patterns of interspecies variability in n-alkanes and other plant markers (Dove et al., Reference Dove, Mayes and Freer1996; Dove et al., Reference Dove, Wood, Simpson, Leury, Ciavarella, Gatford and Siever-Kelly1999). PCA was chosen here as the n-alkane and 13C analyses were based on bulked samples and the data do not provide within-species variability in the two markers. The PCA carried out showed that most of the variance between species was explained by the first three principal components. This indicated the presence of high variability among the plants studied, which can be ascribed to the patterns of the two markers. The results obtained with regard to the n-alkanes is similar to several other investigations over the past decades for pasture and browse species (Ferreira et al., Reference Ferreira, Garcia, Rodrigues, Celaya, Dias-da-Silva and Osoro2007). However, to our knowledge, there is no previous published report regarding interspecies variability in the 13C enrichment of n-alkanes.
One of the constraints in using n-alkanes is that the concentrations of many of the lower-chain n-alkanes and the even-chain n-alkanes are too low for accurate measurement. As a result the number of n-alkanes that can be used as markers is limited. This, in turn, may limit the number of diet components that can effectively be estimated. There are, however, circumstances that the diet of animals grazing on botanically diverse vegetation could contain more diet components than the number of effective n-alkane markers available for diet composition estimation. Taking this limitation into account, research in the area has focused on evaluating other plant wax components, like long-chain fatty alcohols and fatty acids, for use as additional markers (Mayes, Reference Mayes1998). This has been supported by the development of exhaustive analytical laboratory protocols (Dove and Mayes, Reference Dove and Mayes2006).
Generally, the use of a combination of plant wax component n-alkanes, long-chain fatty alcohols and acids, has provided increased accuracy and power in the estimation of diet composition (Kelman et al., Reference Kelman, Bugalho and Dove2003; Bugalho et al., Reference Bugalho, Dove, Kelman, Wood and Mayes2004; Fraser et al., Reference Fraser, Theobald and Moorby2006). The present analysis also showed that interspecies variability in δ13C values of n-alkanes could be used as an additional source of information to estimate diet components of herbivores. The scatter plot derived from RDA, by constraining the species dispersion based on the n-alkane profile by the isotope composition of n-alkanes, showed that those species that tended to cluster when the analysis was based on either n-alkanes or δ13C values of n-alkanes, appeared to be separated. This graphical presentation supports the OPR result that the isotopic composition of the n-alkanes provides additional discriminatory power to species separation.
The increased analytical capacity to separate specific compounds prior to isotope composition analysis (Muccio and Jackson, Reference Muccio and Jackson2009) provides enormous potential to study the isotopic ratio of not only n-alkanes but also long-chain fatty alcohols and fatty acids. The possibility of generating two different types of internal markers from a single set of compounds such as n-alkanes would be a desirable feature in terms of increasing the discriminatory power of wax components.
Estimation of diet composition
Estimation of diet composition using plant wax n-alkanes as markers is achieved by relating the marker patterns found in faeces (corrected for incomplete recovery) to those calculated from the marker patterns of individual diet components (plant species or plant parts). A number of mathematical algorithms and approaches including least squares optimisation procedures (Dove and Mayes, Reference Dove and Mayes2005) and linear programming (Barcia et al., Reference Barcia, Bugalho, Campagnolo and Cerdeira2007) have been developed and used for this purpose. Regarding the application of isotopic enrichment, Bugalho et al. (Reference Bugalho, Barcia, Caldeira and Cerdeira2008) demonstrated that the linear programming model of Barcia et al. (Reference Barcia, Bugalho, Campagnolo and Cerdeira2007) can be effectively used to estimate the contribution of different sources to a mixture by relating the isotopic composition of carbon (δ13C) and sulphur (δ34S) in the sources and mixture. In relation to the present findings, it should also be possible to adopt a suitable mathematical model to use both the n-alkane profiles and their carbon isotopic compositions (δ13C) as inputs in the calculation of diet compositions.
It is now well established that the recovery of n-alkanes in faeces is incomplete with the recovery rate generally increasing in a curvilinear fashion with increasing carbon number. A suitable faecal recovery correction factor is therefore required to increase the accuracy of the calculations (Ferreira et al., Reference Ferreira, Celaya, Garcia, Rodrigues and Osoro2009). However, little is known about the relative recoveries of 12C and 13C isotopes for a particular n-alkane, which could potentially alter the carbon isotope enrichment values of the alkane in feed and faeces and influence diet composition estimation. Controlled in vivo experiments may be required to document the relative fates of the two carbon isotopes in the gut. Gut microorganisms are unable to synthesise long-chain n-alkanes (Keli et al., Reference Keli, Mayes and Vega de2008) indicating that there would be no bias in the estimation of diet composition due to endogenous n-alkane excretion into faeces.
Due to the difficult nature of the measurement, the presence of differential recoveries (if any) of the same n-alkane originating from different plants has not yet been established. In view of this study that the same n-alkane originating from different plants could have different isotopic compositions and that this could be used as an additional marker, it would be interesting to investigate the issue of differential recoveries in relation to the molecular weight of the alkanes.
Conclusion
The n-alkane profile as well as the isotopic enrichment of n-alkanes showed considerable variability among the species studied. The majority of the interspecies variances explained by the two types of data sets are independent of each other. Therefore, generating information on the n-alkane concentration of plant species in combination with their isotopic enrichment could be a valuable tool to improve the accuracy of estimating diet composition and quality of free-ranging animals. However, further validations need to be conducted with actual feeding experiments. Within-species variations in the δ13C values of n-alkanes, as well as changes with physiological maturity are also topics that need to be addressed.
Acknowledgement
The assistance offered by Michel Breuer, Dick Bongers, and Jane-Martine Muijlaert during laboratory analysis; Amsalu Sisay during field sample collection and species identification; and Prof. Cajo ter Braak for the statistical analysis are highly acknowledged. This study was funded by Nuffic (The Netherlands Organisation for International Cooperation in Higher Education) and the Ministry of Education of Ethiopia.