INTRODUCTION
Freezing tolerance comprises at least two independent genetic components, i.e. non-acclimated freezing tolerance and acclimation capacity (Stone et al. Reference Stone, Palta, Bamberg, Weiss and Harbage1993). The ability of many temperate plants to increase their freezing tolerance when exposed to low temperatures is known as cold acclimation (Levitt Reference Levitt1980). Cold acclimation is a result of highly complex biochemical mechanisms including the induction of genes encoding such stress proteins as dehydrins, increased levels of sugars, enhancements of antioxidative mechanisms, changes in lipid compositions, etc. (Borovskii et al. Reference Borovskii, Stupnikova, Peshkova, Dorofeev and Voinikov1999; Thomashow Reference Thomashow1999). Guy (Reference Guy1990) estimates that the expression of hundreds of genes can be altered during this process. All processes during cold acclimation are activated by low-temperature signals alone and, in most cases, by low-temperature dehydration that is deleterious for plants (Stupnikova et al. Reference Stupnikova, Borovskii, Dorofeev, Peshkova and Voinikov2002). Plant cells undergo dehydration during freezing stress due to the presence of ice in extracellular spaces (Levitt Reference Levitt1980). Thus, in this view, responses evoked because of water stress may also be involved in the freezing tolerance mechanism (Arora & Wisniewski Reference Arora and Wisniewski1994).
Soluble sugars and sugar alcohols (mannitol and inositol) could act in several ways to promote cold acclimation with most hypothetical mechanisms involving interactions with other components of the acclimation response (Stitt & Hurry Reference Stitt and Hurry2002). It has been suggested that sugars either play a key role in osmosis or protect specific macromolecules during dehydration (Danyluk et al. Reference Danyluk, Perron, Houde, Limin, Fowler, Benhamou and Sarhan1998). Changes in subcellular concentration and distribution of sugars might also provide a mechanism to protect specific compartments, or to regulate their volumes during cell expansion or dehydration (Stitt & Hurry Reference Stitt and Hurry2002; Uemura et al. Reference Uemura, Warren and Steponkus2003; Jacobsen et al. Reference Jacobsen, Monteros, Christiansen, Bravo, Corcuera and Mujica2005). It is also known that this impact of sugars is due to their capacity to directly interact with phospholipids (PLs) in a manner that imitates the presence of water (Caffrey et al. Reference Caffrey, Fonseca and Leopold1988). In addition to direct membrane stabilization, a regulatory effect of sucrose has been demonstrated for cold-induced expression of non-specific lipid transfer protein and dehydrin in barley cell cultures (Tabaei-Aghdaei et al. Reference Tabaei-Aghdaei, Pearce and Harrison2003). In this respect, PL biosynthesis is also an important component in the cold-acclimation process. Alterations in lipid synthesis and composition of plasma membrane during cold acclimation have been demonstrated in relation to cryobehaviour of the plasma membrane in several studies (Lynch & Steponkus Reference Lynch and Steponkus1987; Steponkus et al. Reference Steponkus, Lynch and Uemura1990, Reference Steponkus, Uemura, Webb and Steponkus1993; Steponkus & Webb Reference Steponkus, Webb, Somero, Osmond and Bolis1992; Uemura & Steponkus Reference Uemura and Steponkus1994; Uemura et al. Reference Uemura, Joseph and Steponkus1995). Recently, Wei et al. (Reference Wei, Dhanaraj, Arora, Rowland, Fu and Sun2006) indicated that PL biosynthesis and desaturation were important components of cold hardening in Rhododendron.
Since olive (Olea europaea L.) is one of the most characteristic evergreen species in the Mediterranean area, the most limiting factor in growing olives is the minimum temperature during winter and early spring (Lavee Reference Lavee1996). Unexpected drops in temperature following temperate weather conditions occur quite frequently in many Mediterranean countries where olive is now cultivated (Fontanazza Reference Fontanazza1985; Bartolozzi et al. Reference Bartolozzi, Mencuccini and Fontanazza1999). If global climatic changes lead to greater variation in local weather, the subject will need more attention in future. Thus, more detailed physiological data are needed to develop cold-hardy olive genotypes as well as to understand the mechanisms of cold hardiness in olive on a cultivar basis.
Biochemical studies on frost tolerance of olive mostly focused on soluble sugars (Lavee Reference Lavee1989; Bartolozzi & Fontanazza Reference Bartolozzi and Fontanazza1999; Bartolozzi et al. Reference Bartolozzi, Mencuccini and Fontanazza1999, Reference Bartolozzi, Rocchi, Camerini and Fontanazza2001) rather than antioxidative enzymes, proteins or lipid metabolism. Recently, Eris et al. (Reference Eris, Gulen, Barut and Cansev2007) demonstrated the changes in annual patterns of total soluble sugar (TSS) and proteins related to the cold-acclimation process of olive cv. Gemlik. Moreover, alterations in protein composition including dehydrins and antioxidative enzyme activities related to cold hardiness of nine olive cultivars were documented by Cansev et al. (Reference Cansev, Gulen and Eris2009). Those authors indicated that cvs Domat and Lecquest were the most cold-hardy among the nine cultivars investigated. In addition Ascolona, Gemlik and Hojoblanca had moderate cold hardiness, whereas Samanli, Meski, Uslu and Manzanilla were the most sensitive. However, the relations of various fractions of soluble sugars and PL of olive cultivars to their differential cold hardiness are still unknown. The aim of the present study was to elucidate whether accumulation and the alterations in the composition of soluble sugars and PL were related to cold hardiness of the olive cultivars at two different physiological stages, cold-acclimated (CA) and non-acclimated (NA), under field conditions. Concomitantly, the goal of the research was to develop a better understanding of the cultivar-dependent response to cold acclimation in olive.
MATERIALS AND METHODS
Plant material
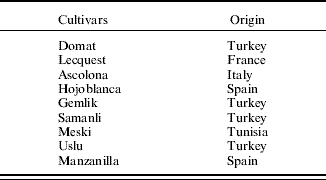
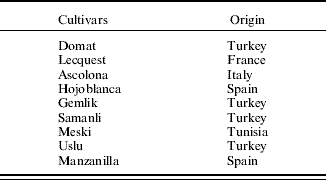
Fully expanded, uniformly sized leaves from 2-year-old shoots of nine olive (Olea europaea L.) cultivars (Ascolona, Domat, Gemlik, Hojoblanca, Lecquest, Manzanilla Meski, Samanli and Uslu) of different cold hardiness (LT50) values were collected from 20-year-old trees at the Atatürk Central Horticultural Research Institute in Yalova, Turkey (29°04′E, 40°39′N) at CA and NA stages. Cansev et al. (Reference Cansev, Gulen and Eris2009) recently determined the LT50 values of these cultivars and these were in good agreement with other reports (Fiorino & Mancuso Reference Fiorino and Mancuso2000; Mancuso Reference Mancuso2000; Barranco et al. Reference Barranco, Ruiz and Gomez-del Campo2005). The cultivars in order from highest to lowest LT50 were Domat, Lecquest, Ascolona, Hojoblanca, Gemlik, Samanli, Meski, Uslu and Manzanilla (Table 1). CA leaves were field collected in winter (January), whereas NA leaves were collected from the same individual olive trees in summer (July). Average temperatures in January and July were 7·3°C (0·4–18·3°C) and 24·9°C (14·5–33·2°C), respectively. Leaf samples were collected randomly from three or four trees of each cultivar, packed on ice and brought to the laboratory. The leaves were separated into two groups; leaves in one group were frozen in liquid nitrogen and kept at −80°C until further analysis of soluble sugars was carried out; leaves in the other group were lyophilized for further analysis of PL.
The olive cultivars in order from highest to lowest cold hardiness as characterized by the LT50 (determined by electrolyte leakage)Footnote *
* Adapted from Cansev et al. (Reference Cansev, Gulen and Eris2009).
Soluble sugars
Sugars were extracted by suspending 100 mg of leaves in 5 ml of 8:10 (v/v) ethanol in an 85°C water bath for 1 h and then removing the suspension from the tissue. This procedure was repeated four times for 1 h, 30 min, 15 min and 15 min. The ethanol solutions were combined and evaporated to dryness at 55°C with the aid of continuous ventilation. Pellets were dissolved in 1 ml of distilled water. TSS and sucrose concentrations were determined according to the anthrone reagent method, as modified for the determination of non-reducing sugars (Van Handel Reference Van Handel1968) by a Beckman UV-DU 520 spectrophotometer (Beckman Coulter, Fullerton, CA, USA) at 620 nm using glucose and sucrose as the standards, respectively. Reducing sugars were determined colorimetrically with dinitrosalicylic acid (Miller Reference Miller1959) using glucose as the standard at 550 nm.
PLs
PLs were extracted and measured by slight modification of the method of Folch et al. (Reference Folch, Lees and Sloane-Stanley1957) and Knowles et al. (Reference Knowles, Trimble and Knowles2001). Briefly, 200 mg of freeze-dried and ground olive leaf tissues was extracted for 30 s in 3 ml of boiling isopropanol, and a further 60 s after the addition of 4 ml of trichloroethane. The homogenate was filtered through a 0·20 μm filter (Uniflo, Keene, NH, USA). Aliquots (1 ml) were then mixed with 2 ml of a trichloroethane+methanol mixture (2:1, v/v) and vortexed vigorously for 30 s. After cooling on ice for 1 h, the mixture was mixed sequentially with 4 ml of a trichloroethane+methanol mixture (2:1, v/v) and 2 ml of ice-cold deionized water. The mixture was vortexed vigorously and allowed to stand overnight at 4°C. The organic (lower) and aqueous (upper) phases of the mixtures were separated by centrifugation (10 min at 4°C and 1000 g). Aliquots (0·1–0·4 ml) of the lower (organic) phase were dried under vacuum (SC210A SpeedVac Plus, Thermosavant, Holbrook, NY, USA) for PL analysis. Residues of 0·1 ml aliquots of the lower phase were assayed for total PL content by measuring phosphorus (Svanborg & Svennerholm Reference Svanborg and Svennerholm1961). Residues of 0·4 ml aliquots of the lower phase were reconstituted in 50 μl of methanol (1:1) and subjected to thin-layer chromatography using silica G plates (Adsorbosil Plus-1, Alltech), and a system consisting of trichloroethane/ethanol/triethylamine/water (30:34:30:8, v/v/v/v) as the mobile phase. PL standards were used to identify the corresponding bands under UV light after the plates were sprayed with 1:10 diphenylhexatriene in petroleum ether. Bands for individual PL classes such as phosphatidylcholine (PC), phosphatidylethanolamine (PE) and phosphatidylinositol (PI) were scraped off the plates and extracted into 1 ml of methanol (1:1); dried under vacuum; and assayed for phosphorus content (Svanborg & Svennerholm Reference Svanborg and Svennerholm1961).
Statistical analysis
The experiment was arranged in a randomized block design with three replications. Data were tested using SPSS 13.0 software for Windows and mean separation was accomplished by the Tukey test at P<0·05.
RESULTS
Soluble sugars
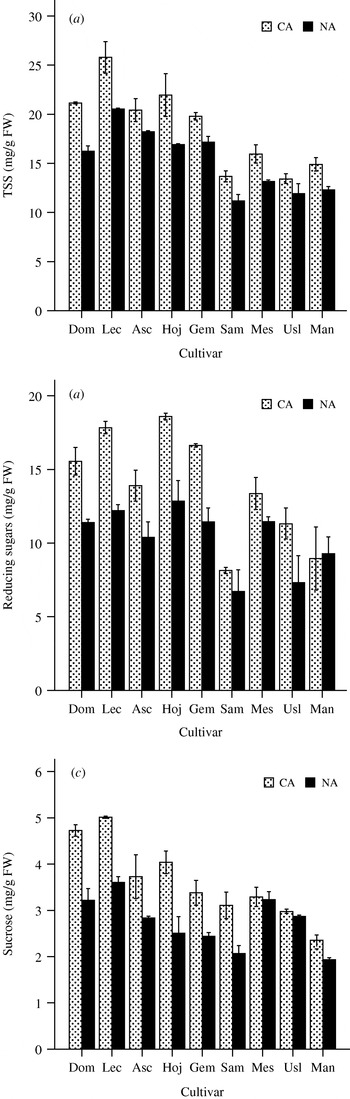
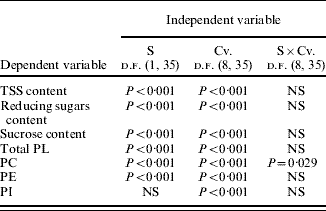
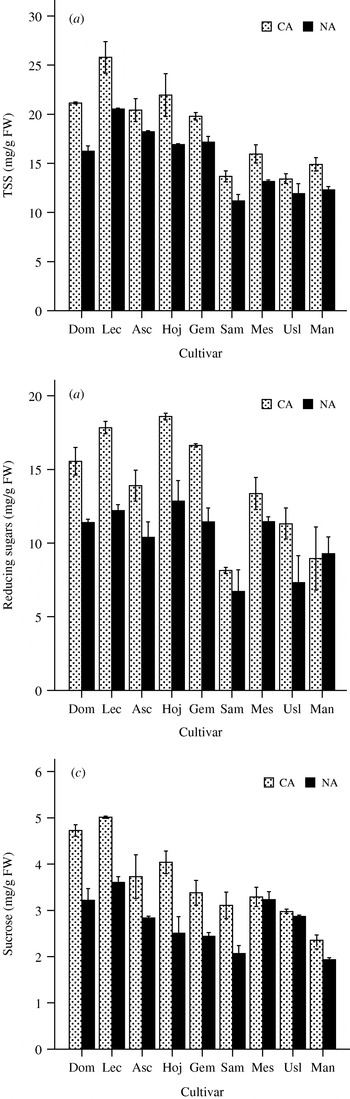
In general, TSS contents of all cultivars were higher in the CA stage than that in the NA stage, except for cv. Uslu (Fig. 1a). When data from the CA period were considered, the highest TSS content was measured in cv. Lecquest and the lowest in Manzanilla and Meski. The order of the cultivars with lower TSS contents in the NA stage was similar to that in the CA stage. Two-way analysis of variance (ANOVA) revealed a significant effect of sampling stage and cultivars but not the interaction of sampling stage and cultivars on TSS content (Table 2).
TSS (a), reducing sugars (b) and sucrose (c) contents in cold-acclimated (CA, in January) and non-acclimated (NA, in July) leaf tissues of nine olive cultivars. Cultivars: Dom, Domat; Lec, Lecquest; Asc, Ascolona; Hoj, Hojoblanca; Gem, Gemlik; Sam, Samanli; Mes, Meski; Usl, Uslu; Man, Manzanilla; FW, fresh weight. Data are presented as means±s.e.m. for three replicates.
Results of ANOVA of the effects of sampling stages (S), cultivar (Cv.) and their interaction (S×Cv) on TSS, reducing sugars, sucrose, total PL, PC, PE and PI contents. The P-values represent the probability that the effect is due to chance (NS=P>0·05)
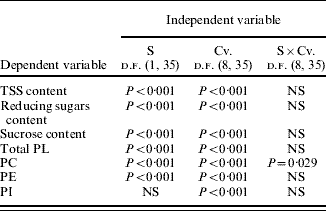
Generally, the cultivars had significantly higher reducing sugar content when sampled at the CA than at the NA stage (Fig. 1b). Reducing sugars in cold-tolerant cvs Domat, Lecquest and Hojoblanca were significantly higher in the CA stage compared with the NA stage. However, no significant differences in reducing sugars of the cold-sensitive cvs Samanli and Manzanilla were detected between the CA and NA stages. Two-way ANOVA revealed a significant effect of sampling stage and cultivars, but not the interaction of sampling stage and cultivars on reducing sugars (Table 2).
As with TSS and reducing sugars, there were significantly higher sucrose contents in the CA stage, except for cvs Meski and Uslu (Fig. 1c). Almost two-fold differences were observed between the sucrose content of the most cold-tolerant (cvs Domat and Lecquest) and the most cold-sensitive (cv. Manzanilla) cultivars, particularly in the CA stage. When data from the two sampling stages were considered, the highest and the lowest sucrose contents were detected in cvs Lecquest and Manzanilla, respectively. Two-way ANOVA revealed a significant effect of sampling stage and cultivars but not the interaction of sampling stage and cultivars on sucrose content (Table 2).
PLs
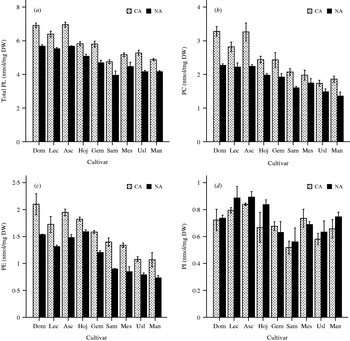
Total PL contents of all cultivars were significantly higher in the CA stage compared with those in the NA stage (Fig. 2a). In addition, levels of total PL varied among cultivars in both CA and NA stages. The highest total PL was detected in the cold-tolerant cvs Domat, Lecquest and Ascolona in both CA and NA stages, whereas the lowest total PL was determined in the cold-sensitive cvs Samanli, Meski, Uslu and Manzanilla in both CA and NA stages. Two-way ANOVA revealed a significant effect of sampling stage and cultivars but not the interaction of sampling stage and cultivars on total PL content (Table 2).
Total PL (a), PC (b), PE (c) and PI (d) contents in cold-acclimated (CA, in January) and non-acclimated (NA, in July) leaf tissues of nine olive cultivars. Cultivars: Dom, Domat; Lec, Lecquest; Asc, Ascolona; Hoj, Hojoblanca; Gem, Gemlik; Sam, Samanli; Mes, Meski; Usl, Uslu; Man, Manzanilla. Data are presented as means±s.e.m. for three replicates.

PC content of all cultivars, except cv. Meski, indicated significant differences between CA and NA stages (Fig. 2b). The highest PC contents in both CA and NA stages were determined in the cold-tolerant cvs Domat, Lecquest and Ascolona. The lowest PC contents were measured in the cold-sensitive cvs Uslu and Manzanilla in both CA and NA stages. Two-way ANOVA revealed a significant effect of sampling stage, cultivars and the interaction of sampling stage and cultivars on PC content (Table 2).
Data from PE analysis indicated significant differences between CA and NA stages of all cultivars (Fig. 2c). The highest PE values in both CA and NA stages were detected in the cold-tolerant cvs Domat and Ascolona, whereas the lowest PE values were determined in the cold-sensitive cvs Uslu and Manzanilla in both CA and NA stages. Two-way ANOVA revealed a significant effect of sampling stage and cultivar, but not the interaction of sampling stage and cultivars on PE content (Table 2).
In general, no significant difference was detected in the PI contents of any cultivar between CA and NA stages (Fig. 2d). However, as with total PL, PC and PE, the highest PI was determined in the cold-tolerant cvs Lecquest and Ascolona, whereas the lowest PI was determined in the cold-sensitive cv. Samanli in both CA and NA stages. Two-way ANOVA revealed a significant effect of cultivars but not a significant effect of sampling stage and the interaction of sampling stage and cultivars on PI content (Table 2).
DISCUSSION
Soluble sugars
Soluble sugars are known to be essential components in plant cold acclimation; changes in their levels during this process have been well documented in Arabidopsis mutants (Uemura et al. Reference Uemura, Warren and Steponkus2003). Besides soluble sugars, sugar alcohols such as mannitol have also been reported in olive leaves related to frost tolerance (Bartolozzi et al. Reference Bartolozzi, Mencuccini and Fontanazza1999). Increases in content of soluble sugars in the CA stage have been proposed to be a part of cold-acclimation mechanisms in olive plants (Lavee Reference Lavee1989; Bartolozzi et al. Reference Bartolozzi, Mencuccini and Fontanazza1999, Reference Bartolozzi, Rocchi, Camerini and Fontanazza2001; Proietti & Famiani Reference Proietti and Famiani2002; Eris et al. Reference Eris, Gulen, Barut and Cansev2007) as well as in many other plant species such as peach cultivars (Burak & Eris Reference Burak and Eris1992), winter rye leaves (Antikainen & Pihakaski Reference Antikainen and Pihakaski1994) and cabbage genotypes (Sasaki et al. Reference Sasaki, Ichimura and Oda2001). Similarly, cold hardening resulted in significant changes in soluble sugars of olive cultivars investigated in the present study. These findings suggest that enhancement in soluble sugars was caused by cold-acclimation and greater freezing tolerance and cold-acclimation were partially associated with increased levels of soluble sugars.
The present data agree well with earlier reports (Galiba et al. Reference Galiba, Kerepesi, Snape and Sutka1997; Sasaki et al. Reference Sasaki, Ichimura, Imada and Yamaki1998) and show that the differences in cold-tolerance between the cultivars are reflected by differences in the ability to accumulate carbohydrates under cold-stress conditions. Although higher TSS were detected in cold-tolerant cultivars (Domat and Lecquest) than in cold-sensitive ones (Samanli, Meski and Manzanilla) in both CA and NA stages, TSS accumulations were higher in tolerant cultivars (by c. 23%) than sensitive ones (by c. 20%). Similarly, Vagujfalvi et al. (Reference Vagujfalvi, Kerepesi, Galiba, Tischner and Sutka1999) showed that total water-soluble carbohydrates increased continuously during the cold treatment in all wheat genotypes, resulting in higher contents in tolerant genotypes than those in sensitive ones. More recently, Jacobsen et al. (Reference Jacobsen, Monteros, Christiansen, Bravo, Corcuera and Mujica2005) reported that the variation in frost tolerance between the two quinoa cultivars was due to differences in the level of soluble sugars and thus frost tolerance was attributed to an increased level of solutes, which protect and support cellular structures under frost stress.
Sucrose is known as the soluble sugar that accumulates most rapidly in response to low temperature (Guy et al. Reference Guy, Huber and Huber1992), due to the fact that low temperatures favour the hydrolysis of polysaccharides to soluble carbohydrates, particularly to sucrose. In fact, sucrose is a storage carbohydrate that can be rapidly mobilized in response to metabolic requirements and at low temperatures its accumulation is simply for respiration energy (Guy et al. Reference Guy, Huber and Huber1992; Ögren et al. Reference Ögren, Nilsson and Sundblad1997). Also, sucrose accumulation is often correlated with frost tolerance because of its protective activity in woody plants (Sauter et al. Reference Sauter, Wisniewski and Witt1996). Palonen (Reference Palonen1999) found that accumulation of TSS in cold-hardy buds of red raspberry was caused mainly by an increase in sucrose content and high concentrations of sucrose and glucose (as a reducing sugar) were characteristic of a hardy raspberry cultivar. Similarly, it was reported that changes in TSS, particularly glucose and sucrose, contents were related to variations in freezing tolerance of wheat (Perras & Sarhan Reference Perras and Sarhan1984), spinach (Guy et al. Reference Guy, Huber and Huber1992) and cabbage seedlings (Sasaki et al. Reference Sasaki, Ichimura, Okada and Oda1996, Reference Sasaki, Ichimura, Imada and Yamaki1998). In olive plants, Bartolozzi et al. (Reference Bartolozzi, Mencuccini and Fontanazza1999) reported a sharp increase in the amount of sucrose in olive leaves analysed immediately after a week of freezing temperatures. However, in the present study, reducing sugar, but not sucrose, was the major soluble carbohydrate in olive leaves due to the fact that reducing sugars accounted for roughly 0·6–0·9 of the TSS (Fig. 1). On the other hand, the proportional increase in sucrose content in CA and NA stages was greater than that of reducing sugars. Reducing sugars in cold-tolerant cultivars significantly increased in the CA stage compared with that in the NA stage (i.e. cv. Hojoblanca by 36%, cv. Lecquest by 33% and cv. Domat by 31%), whereas reducing sugars in cold-sensitive cultivars either did not change (cv. Samanli and cv. Manzanilla) or increased slightly in the CA stage compared with that in the NA stage (i.e. cv. Meski by 15% and cv. Uslu 16%). Sucrose content in cold-tolerant cultivars increased in the CA stage compared with that in the NA stage (by c. 40% in cv. Lecquest and 43% in cv. Domat), whereas sucrose content in cold-sensitive cultivars increased slightly in the CA stage compared with that in the NA stage (by 26% in cv. Samanli and 14% in cv. Manzanilla). Consequently, the present results are in good agreement with those of Kameli & Lösel (Reference Kameli and Lösel1993), who considered that monosaccharides might play important roles in more tolerant genotypes. In tolerant genotypes, sucrose translocated to the stem was initially metabolized to monosaccharides, causing their sucrose content to rise. Thus, the present results support the theory that lower sucrose allows an increase in quantities of reducing sugars (Leprince et al. Reference Leprince, Hendry and McKersie1993; Galiba Reference Galiba and Janick1994). In conclusion, the genotypes investigated here responded to cold in a similar way and increased their cold hardiness by increasing their TSS, reducing sugars and sucrose contents significantly in the CA stage.
PLs
The plasma membrane is considered the primary site of freezing injury (Levitt Reference Levitt1980) and the cryobehaviour and the functional stability of the plasma membrane are clearly affected by the lipid composition in the plasma membrane (Uemura et al. Reference Uemura, Tomınaga, Nakagawara, Shıgematsu, Mınamı and Kawamura2006). Therefore, collective changes in various lipid components in the plasma membrane occur during cold-acclimation. Many studies have indicated that the plasma membrane PL content, particularly PC and PE, increases during cold acclimation (Uemura & Yoshida Reference Uemura and Yoshida1984; Lynch & Steponkus Reference Lynch and Steponkus1987). As demonstrated in the present work and by others, the amount of total PL, PE and PC is increased in CA by low-temperature-induced cold acclimation (Fig. 2). Thus, the data indicated that PL composition may have a profound impact on the cold-acclimation process and susceptibility of the membrane to cold stress. The data published by Cansev et al. (Reference Cansev, Gulen and Eris2009) supported this by demonstrating greater cold hardiness in the CA stage as an indication of less membrane injury in comparison with the NA stage. Consequently, the increase in the total PL, PC and PE content in olive leaves can be considered as evidence of the involvement of cell membrane during the CA process. This hypothesis is further supported by previous observations on development of frost tolerance, which has been related to increased PL in winter rye leaves (Sikorska & Kacperska-Palacz Reference Sikorska and Kacperska-Palacz1979) and an increase in PC fraction of the total plasma membrane PL of CA winter rye leaves compared with that of NA samples (Lynch & Steponkus Reference Lynch and Steponkus1987). In addition, Wang & Lin (Reference Wang and Lin2006) recently reported a significant difference in PL content between two strawberry cultivars grown in different temperature regimes.
Changes in membrane lipid composition occur when plants are exposed to freezing temperatures (Yoshida & Sakai Reference Yoshida and Sakai1974). Several studies have demonstrated alterations in the lipid composition of the plasma membrane of winter rye leaves (Lynch & Steponkus Reference Lynch and Steponkus1987; Uemura & Steponkus Reference Uemura and Steponkus1994) and Arabidopsis thaliana (Uemura et al. Reference Uemura, Joseph and Steponkus1995) during cold acclimation. The alterations in lipid composition during cold acclimation have been associated with alterations in the cryobehaviour of the plasma membrane (Steponkus et al. Reference Steponkus, Lynch and Uemura1990, Reference Steponkus, Uemura, Webb and Steponkus1993; Steponkus & Webb Reference Steponkus, Webb, Somero, Osmond and Bolis1992). As evidence, a significant increase in PC fraction in various plants during cold acclimation made PC the most abundant membrane PL (Yoshida & Sakai Reference Yoshida and Sakai1974; Lynch & Steponkus Reference Lynch and Steponkus1987; Palta et al. Reference Palta, Whitaker and Weiss1993; Cyril et al. Reference Cyril, Powell, Duncan and Baird2002). In addition, the increase in PL during cold acclimation has been associated with an increase in the proportion of di-unsaturated species of PC and PE fractions in rye and oat (Uemura & Steponkus Reference Uemura and Steponkus1994). Similarly, PC fraction was determined as the most important PL in cold acclimation of olive leaf tissues, since PC constituted c. 0·42 of total PL, whereas PE and PI constituted almost 0·25 and 0·10 of total PL, respectively (Fig. 2). Indeed, PC accumulated in significantly higher levels in cold-tolerant cvs Domat, Lecquest and Ascolona (c. 0·33) than those in the cold-sensitive cvs Samanli, Meski, Uslu and Manzanilla (c. 0·25). Moreover, only PC showed a significant interaction between cultivars and acclimation stages, which means that PC can be increased by the cold-acclimation process, depending on the cold tolerance of genotype. The present data obviously indicate that PC was more effective than PE and PI in maintaining the cold hardiness of olive cultivars. These results suggest the existence of relations between the genotypic differences in PL composition, depending on the cold hardiness of the cultivars and alterations in PL composition induced by CA. This evidence suggests that PC could be a selection criterion in cold tolerance of olive genotypes.
The cold hardiness of the evergreen woody plant olive is a highly complex phenomenon. A combination of physiological and molecular approaches is required to establish more definitively the causes of genotype-dependent cold hardiness. The variations in tolerance to freezing in nine olive cultivars previously reported by Cansev et al. (Reference Cansev, Gulen and Eris2009) could now be explained in part by increased content of soluble sugars and PL in the CA stage, compared with those in the NA stage of the cultivars. Indeed, the accumulation of both soluble sugars and PL in CA leaf tissues of olive was associated with cold hardiness of cultivars. It was concluded from the previous study (Cansev et al. Reference Cansev, Gulen and Eris2009) that the relatively cold-tolerant olive cvs Domat, Lecquest, Ascolona and Hojoblanca more effectively utilize PL, particularly PC and soluble sugars by preserving COR proteins like dehydrins (Tabaei-Aghdaei et al. Reference Tabaei-Aghdaei, Pearce and Harrison2003), to protect cells against cold-injury than the cold-sensitive cvs Samanli, Meski, Uslu and Manzanilla. The data indicated PC to be a promising PL marker in the screening of olive genotypes related to cold hardiness.
This research was supported by grants from the Turkish Republic Prime Ministry State Planning Organization and the Committee of Scientific Research Projects of Uludag University, under project number 2002/1. We thank Dr Erol Yalcinkaya and Nesrin Aktepe Tangu (Atatürk Central Horticultural Research Institute, Yalova, Turkey) for supplying plant material. We are grateful to Professor Richard Wurtman (Brain and Cognitive Science, MIT, MA, USA) for making his laboratory available for PL analyses.