


1. Introduction
The accumulation rate and its spatial pattern across Antarctica are the main influences determining the growth and movement of the ice sheet. The accumulation distribution is needed as a fundamental input factor in glacier mass-balance studies, necessary to, for instance, estimate current sea-level changes. The interpretation of physical and chemical properties measured along ice cores, used for paleoclimatic reconstruction, also relies on an exact knowledge about present and past surface mass-balance distribution across the Antarctic continent.
Surface mass-balance calculations are usually based on stake readings, snow-pit samples and shallow firn cores. These measurements yield parameters to estimate the spatial variability of the Antarctic surface mass balance, as well as its variation over the last few decades. Use of this information has the disadvantage that it is uncertain how these irregularly and sparsely collected datasets are able to represent general climatic trends of precipitation and wind-drift patterns for larger areas.
Over recent years, the traditional methods have been supplemented by methodological ice-penetrating radar (IPR) studies to improve the understanding of spatial accumulation patterns (e.g. Richardson and others, 1997; Reference Nereson, Raymond, Jacobel and WaddingtonNereson and others, 2000; Richardson-Naslund, 2001; Reference Frezzotti and FloraFrezzotti and Flora, 2002; Reference PälliPälli and others, 2002). High-frequency IPR is capable of imaging the physical structure of the upper hundreds of metres of the ice column. On the Antarctic inland plateau, this provides a means to derive information about the local surface mass balance over the last 100– 1000 years. It has thus become possible to map accumulation rates and their spatial variations along continuous profiles within the upper parts of the snowpack.
The studies underlying this paper were carried out within the European Project for Ice Coring in Antarctica (EPICA), but are likewise a contribution to the International Trans-Antarctic Scientific Expedition (ITASE) programme. The latter was established in order to improve the collection and understanding of environmental parameters, representing the spatial variability of the Antarctic climate within the last 200 years. IPR data collected on Amundsenisen, Dronning Maud Land (DML), the Atlantic sector of Antarctica, allow us to derive spatial characteristics of the distribution of accumulation. Moreover, we estimate the spatial representativity of accumulation rates derived from point measurements, like firn and ice-core studies located on or near the profile line, by comparison with the IPR-based results. This enables us to judge the suitability of regional surface mass-balance estimation for Amundsenisen.
2. Origin of Data
2.1. Deriving accumulation rates from IPR surveys
Coherent internal radar reflection horizons (IRHs) detected with IPR systems on ice sheets are generally considered to be features of equal age, often referred to as isochrones. The processes forming electromagnetic reflectors take place at or near the glacier surface at approximately the same time, with the submergence rate of the isochronic surface being determined by interaction of the flow field and surface accumulation rate (Reference Robin, Evans and BaileyRobin and others, 1969; Reference GudmandsenGudmandsen, 1975; Reference MillarMillar, 1981). Knowledge of the depth of an IRH in respect to the surface, its age and the density–depth profile of the firn enables us to calculate the mass accumulated after formation of the IRH, and thus the average surface mass balance.
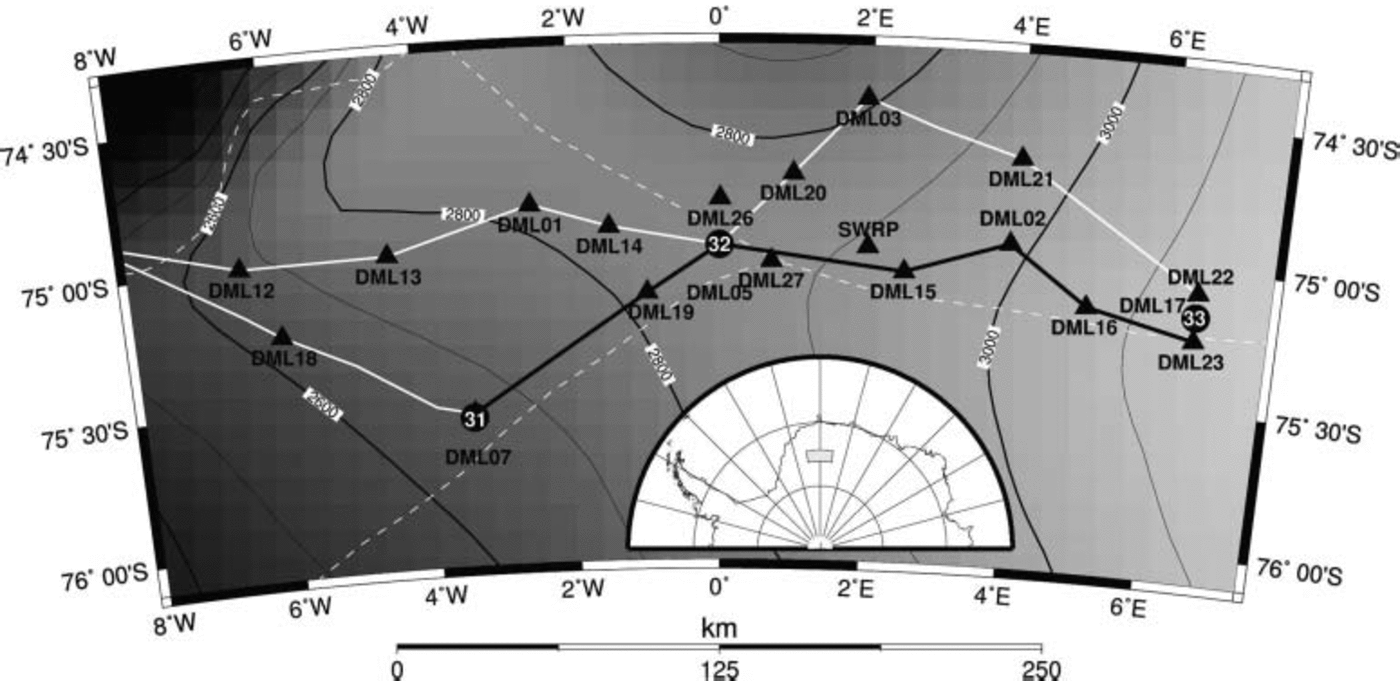
IPR data analyzed here result from common-offset measurements between various borehole locations and were performed with a commercial RAMAC radar set (Malå Geoscience, Sweden). The monopulse bistatic radar system was operated with antennae at 200 and 250MHz: unshielded dipoles at a fixed distance of 60 cm in the former, and shielded antennae at a distance of 36cm in the latter case. Both set-ups are permanently mounted in skid-boxes and connected with the central processing unit via light-conducting cables, thus avoiding noise from ohmic conductors. The processing unit was operated by a Husky FC PX5 personal computer, using the radar system software. The 200 MHz survey was carried out in 1999 between ice cores B32 and B33, using a snow tractor for pulling at an average speed of 8 km h–1 (Fig. 1). Traces were recorded every 1.5 m, triggered by a distance wheel, in a 1500 ns time window consisting of 2400 samples. The 250MHz data were recorded in 2001 between B32 and B31, pulling the device with a snowmachine at 12 km h–1 with traces recorded every metre in a 1570 ns time window with 2048 samples. For either measurement set-up, the stored traces consist of eight vertically stacked pulse recordings. Continuous geographical positioning of the GPR profiles was obtained from kinematic global positioning system (GPS) measurements.
Radar profiles and surface topography (Reference Liu, Jezek, Li and ZhaoLiu and others, 2001) in the region of interest on Amundsenisen plateau. Elevation contours (100m interval and grey code) are given as thin solid black lines; the position of ice divides is indicated by the dashed white lines. The route of the radar survey (1999 and 2001) is shown as solid straight lines. The section of the radar profile analyzed here is shown as thick solid black line, extending from the ice-core drilling sites (circles) DML07 (B31) to DML17 (B33), passing DML05 (B32), near the EPICA deep-drilling camp Kohnen. Other firn-core sites in the vicinity of radar profiles within the study area are shown as triangles including site labels: DML: Alfred-Wegener-Institut pre-site surveys (Reference OerterOerter and others, 2000); SWRP: Swedish Antarctic Research Programme (Reference Isaksson, Karlén, Gundestrup, Mayewski, Whitlow and TwicklerIsaksson and others, 1996). The location of the study area on the Antarctic continent is indicated as the shaded region in the inset.
Post-recording processing was performed using Paradigm Geophysical FOCUS version 4.2 software and includes fivefold horizontal stacking, bandpass filtering and automatic gain control. IRHs were semi-automatically tracked in the processed data with the Landmark OpenWorks release 2003.0 software, exploiting the coherency of signal features. IRHs were observed at numerous travel times and tracked continuously between the boreholes.
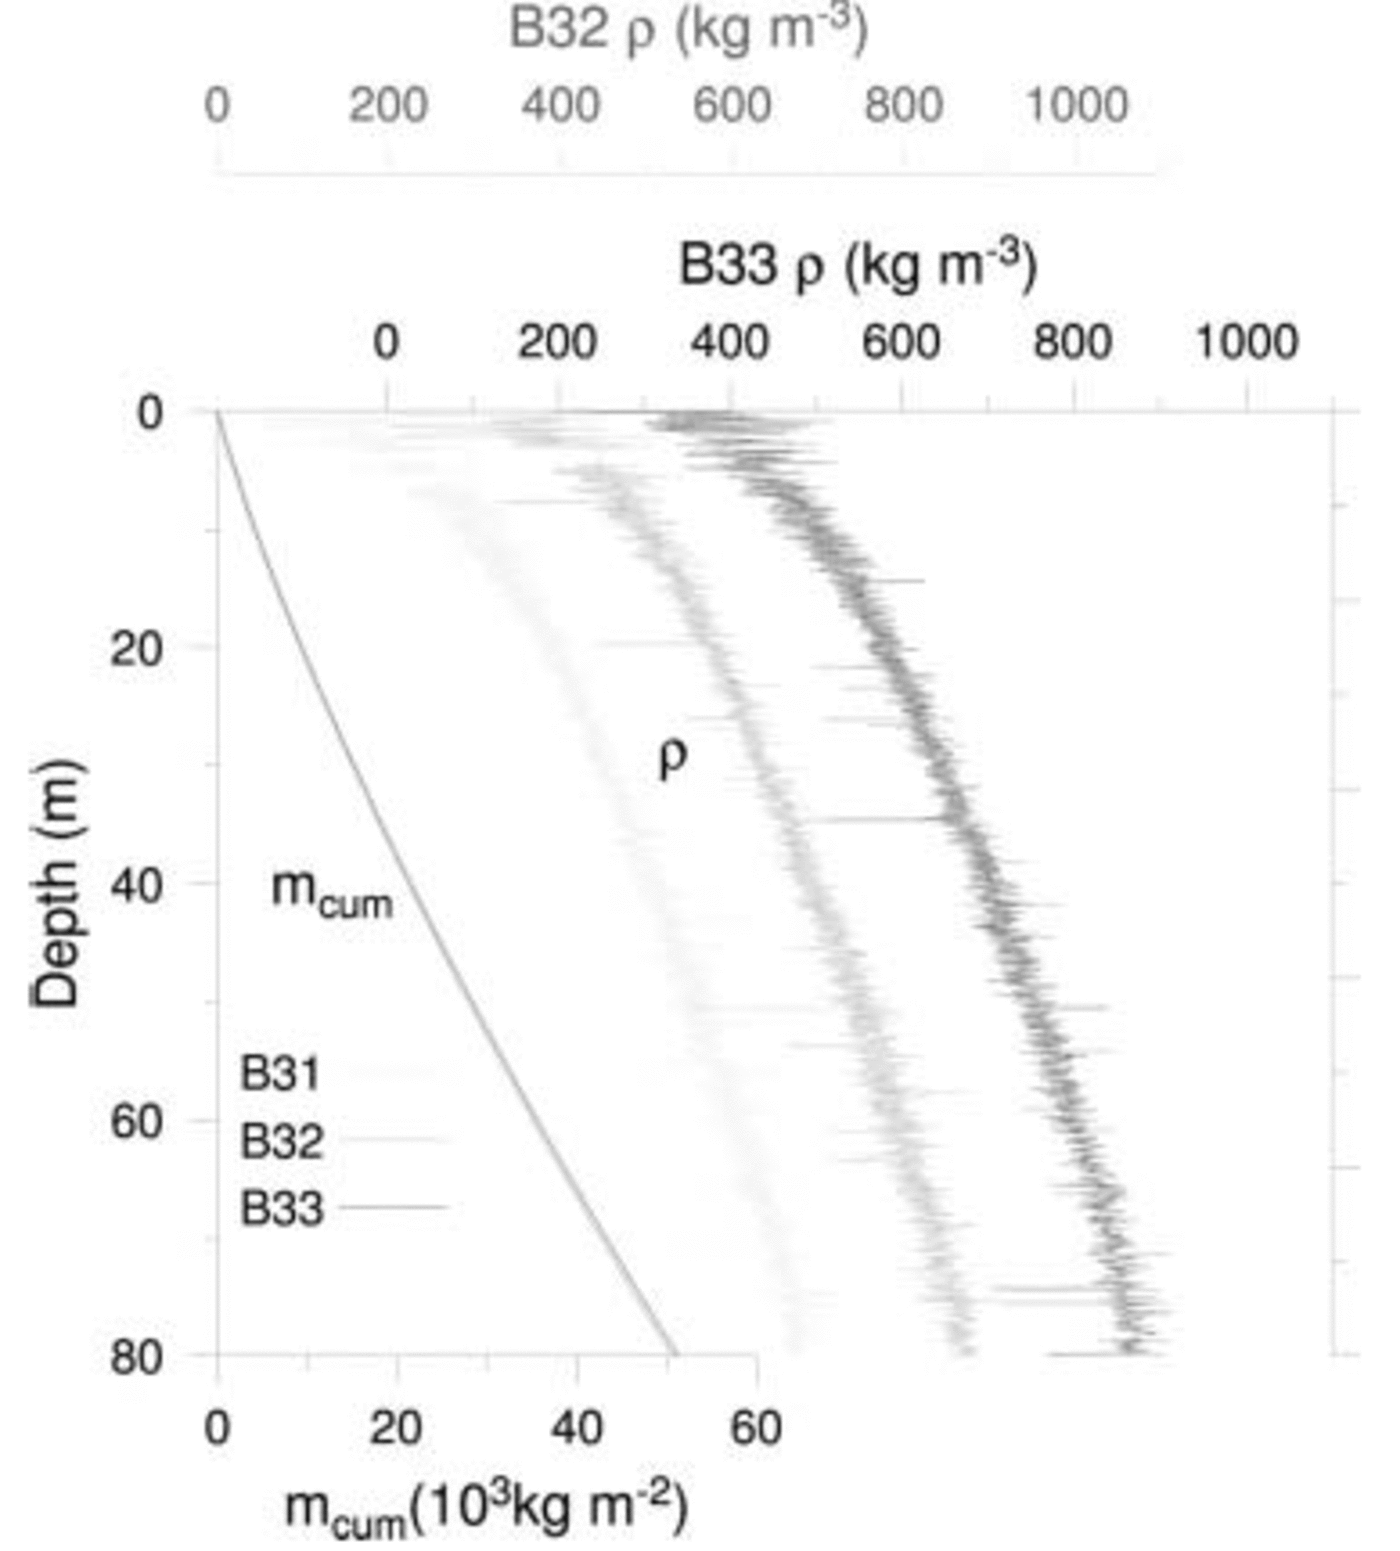
Dielectric profiling of the firn and ice cores at 5mm intervals provides profiles of the wave speed–depth and the density–depth distribution (Reference WilhelmsWilhelms, 2000; Reference Eisen, Nixdorf, Wilhelms and MillerEisen and others, 2002). Wave speeds are used to convert radar data from travel time to depth, and integration of density profiles yields the distribution of cumulative mass with depth. The travel-time and cumulative mass profiles of all three ice cores are quasi-identical (Fig. 2) and show differences only on a high-resolution depth scale. It is therefore justified to assume a homogeneous density–depth distribution within the area of interest and thus using the data from B32, located between B31 and B33, for the whole radar profile.
Depth profiles of density ρ derived from dielectric profiling (x axes at top of graph) of ice cores B31 (light grey), B32 (dark grey) and B33 (black). Note the different x-axis offset for each density profile. The cumulative mass profiles (m cum, bottom axis) result from integration of the density profiles. They are virtually indistiguishable, as small differences in density are smoothed out by integration. As the cumulative mass profiles are plotted without offset, only the black profile on top of the other two is visible.
Datings of IRHs are obtained by transferring the ice-core ages to the respective depth of the IRH at each drilling location. The ice cores are dated by annual-layer counting of multi-parameter chemical records combined with identification of volcanic horizons (Reference SommerSommer and others, 2000). For further analysis in this study, we use the uppermost strong IRH that is continuously trackable along the whole profile. Near B32 it is located at around 25 m depth. Dating estimates of this IRH are AD 1815 at B31, AD 1822 at B32, and AD 1813 at B33, indicating that the IRH is likely related to the Tambora (Indonesia) volcanic eruption in AD 1815. The mean of all three datings, AD 1817, is used as the time of origin of this IRH, with an uncertainty of ± 5 years. This error accounts for uncertainties in the travel-time depth conversion, ice-core dating, and age transfer from ice-core depth to IRH depth (Reference Eisen, Nixdorf, Wilhelms and MillerEisen and others, 2004), as well as the 1–2 year delay of aerosol deposition related to the volcanic eruption (Reference Traufetter, Oerter, Fischer, Weller and MillerTraufetter and others, 2004). The total error of the IRH age and depth is thus a combination of different uncertainties, resulting from the resolution of the radar system (0.8 m), the error related to tracking of IRH (about 1 m), and dating accuracy, as described above.
Finally, we transfer the cumulative mass corresponding to the depth of the IRH along the profile. The average surface mass balance then results from dividing the cumulative mass by the respective age of the reflector, i.e. 184 years for section B31–B32 (survey 2001) and 182 years for section B32–B33 (survey 1999).
2.2. Accumulation data based on point sampling
A compilation of accumulation data, consisting of 121 data points, is available for the DML region (Reference ÜhleinÜhlein, 1999) and roughly comprises 106km2. It is based on snow-pit studies and firn-core data taken from the literature. The distribution of accumulation in the region of interest is presented and discussed by Reference OerterOerter and others (2000). The averaging period of the different data points varies between 5 years for snow pits and up to 200 years for ice cores.
3. Results
For comparison purposes, we focus on the accumulation measurements adjacent to the IPR route near the ice divide (Fig. 1). Profiles of surface topography, accumulation, internal structure and bedrock topography along the route are shown in Figure 3a–d. Before comparing and discussing the results of the two different methods in respect to accumulation rates, we briefly describe typical characteristics of each dataset separately.
(a) Surface topography (Reference Liu, Jezek, Li and ZhaoLiu and others, 2001) given as World Geodetic System 1984 ellipsoid (WGS84) elevation (thin line, left axis), and its variation as difference of local height from the 50 km running mean of the surface elevation (thick line, right axis). (b) Surface mass-balance profiles based on radar (thin line), its 50 km running mean (thick line) and linearly interpolated point samples (dashed line). Location and values of firn and ice cores are shown as triangles, with their site labels next to them (numbers: DML sites; see Fig. 1). (c) Depth distribution of selected internal horizons as a function of two-way travel time. The uppermost horizon, dated to AD 1817, is used to derive the surface mass balance shown in (b). (d) Bedrock topography (Reference Steinhage, Nixdorf, Meyer and MillerSteinhage and others, 1999). The location of the three ice cores B31–33 is shown on top of the graph.

3.1. IPR-based surface mass-balance profiles
In total, five strong IRHs are continuously tracked from B31 to B33. The variation of travel times around the mean increases from ∼100 ns for the uppermost reflector to ∼500 ns for the deepest (Fig. 3c). This amounts to changes in the horizons’ depths between about 10 and 50 m, respectively, over short distances along the surveyed profiles. The annual surface mass-balance rate calculated from the AD 1817 horizon at around 20 m depth is shown in Figure 3b, together with accumulation rate estimates of firn and ice cores along the same profile line. The accumulation derived from the radar data varies between 32.6 and 74.3 kg m–2 a–1. The resulting mean accumulation is 53.8 kgm–2 a–1, with a standard deviation of 7.7 kgm–2 a–1 for an average sampling rate of 1.3 m. The autocorrelation function calculated from the IPR-based accumulation rate along the whole profile shows a strong decrease to 0.65 over the first 3 km separation (Fig. 4). The decrease continues less steep to around 10 km, to level out at a value of about 0.4.
Autocorrelation function of the unfiltered accumulation rates derived from tracking of the AD 1817 IRH.

The mass-balance information is complemented by surface and bedrock topography given along the IPR route (Fig. 3a and d). Bedrock heights are taken from Reference Steinhage, Nixdorf, Meyer and MillerSteinhage and others (1999), and surface altitude data from RADARSAT Antarctic Mapping Project (RAMP) digital elevation model version 2.0 (Reference Liu, Jezek, Li and ZhaoLiu and others, 2001). The elevation along our route gently rises from about 2650 to 3150ma.s.l. over a distance of 320 km from DML07 to DML17. To emphasize small-scale surface variations of just a few metres over 10 km within the smooth surface topography, the difference of local surface elevation from a 50 km running mean is also calculated. They can be linked to undulations in the bedrock relief, a well-known phenomenon (Reference RobinsonRobinson, 1966; Reference Budd and CarterBudd and Carter, 1971; Reference Robin and MillarRobin and Millar, 1982), being on the order of hundreds of metres over the same distance. As most sections of our survey profiles are not parallel to the mean flow directions, the bedrock and surface undulations are slightly shifted.
3.2. Regional distribution of accumulation rates from point sampling
The accumulation distribution for the Amundsenisen plateau as derived from point measurements covers a 150 km wide stripe along both sides of latitude 75˚ S, between 5˚W and 5˚ E. As described by Reference OerterOerter and others (2000), the distribution shows a continuing general trend of decreasing accumulation rates from the coastal area towards the interior of the ice sheet. Along the whole profile, the mean surface balance between B31 and B33 is 56 kg m–2 a–1, with a standard deviation of 9 kg m–2 a–1. In the east as well as in the west of the studied area, spots with accumulation rates of <45 kg m–2 a–1 are found. In the centre, mainly eastwards of point DML05 along the ice divide, the accumulation rates vary between 45 and 65 kg m–2 a–1. Towards the north, the accumulation rates increase to values around 90 kg m–2 a–1, as determined at point DML03. The value of 77 kg m–2 a–1 reported by Reference Isaksson, Karlén, Gundestrup, Mayewski, Whitlow and TwicklerIsaksson and others (1996) at site SWRP in Figure 1 is exceptional compared to surrounding values of 65 kg m–2 a–1.
4. Discussion
The mass balances obtained from IPR data agree well with values gathered from several firn and three shallow icecores which are located along the IPR travel route (Fig. 3). The values are nearly identical to most of the point samples. Exceptions are the locations DML15, DML23, DML27 and SWRP, where larger discrepancies of up to 13 kg m–2 a–1 are observed. The reasons for this will be discussed later.
Between the single core locations, the IPR results show large variations in layer thickness and thus local surface mass-balance rates, revealing a rather complex accumulation pattern for our study area. The standard deviation of 14% compares well with observations by Richardson-Naslund (2001), who quantified the spatial variability of the net snow accumulation to around 10% for undisturbed plateau areas of DML.
As the observed changes in accumulation are irregular in character beyond a separation of 10 km (Fig. 4), they cannot be systemized in terms of wavelength, unlike other features (e.g. snow megadunes: Reference Frezzotti, Gandolfi and UrbiniFrezzotti and others, 2002). Nevertheless, it seems likely that the surface mass-balance variations are related to small-scale undulations of the surface topography. In some parts of the survey profile (e.g. between DML07 and DML19), an increase in mass balance occurs at apparent surface depressions, while a lower accumulation rate can be observed where the elevation is higher then the average. In other parts, accumulation maxima occur rather in phase with surface heights. Care needs to be taken with these observations, however. An accurate relation between surface topography and accumulation rates requires a two-dimensional map of elevations in high resolution, as the topography along track is not necessarily the same in other directions.
Linear interpolation of the point data along the IPR profile line shows an alternating over- and underestimation of accumulation rates compared to the IPR-derived mass-balance data. Applying a 50 km running mean to the IPR surface mass balance results in a distribution that is approximately in phase with the interpolated point samples (Fig. 3b). Starting in the west, a gradual decrease in accumulation is followed after a minimum near km 80 (DML19) by a strong increase up to km 170 in both profiles. However, whereas the smoothed IPR-based accumulation remains level with slight variations, the interpolated point samples continually decrease from km 175 (SWRP) to km310 (DML23). One reason for the differences in the eastern half of the profiles is the strong influence of individual sample points representing local extremes. For example, the interpolated maximum at km 170 is a consequence of the relatively high accumulation rate of 77 kg m–2 a–1 mentioned above, and the strong minimum at km 310 results from the low value of 38 kg m–2 a–1. Near these sites, the IPR-based accumulation rate shows strong variations, but still very different values than the interpolated ones.
In two cases, the point samples are not directly located on the radar route. DML27 is about 5 km to the south, and on the other side of the ice divide the SWRP site is about 8 km north of the IPR route. Given the strong decorrelation of the surface mass balance over the first 3 km (Fig. 4), the differences to the radar-based mass balance are not surprising.
The disagreement between radar- and core-based mass-balance values at DML15 and DML23 originates from two different kinds of miscalculation. Examination of the firn-core profile retrieved at DML15 reveals that bad core quality lead to gaps within the upper part of the density– depth profile, which were closed by linear interpolation. Thus, the increase of density with depth is too strong, which in turn leads to an overestimation of the cumulative mass.
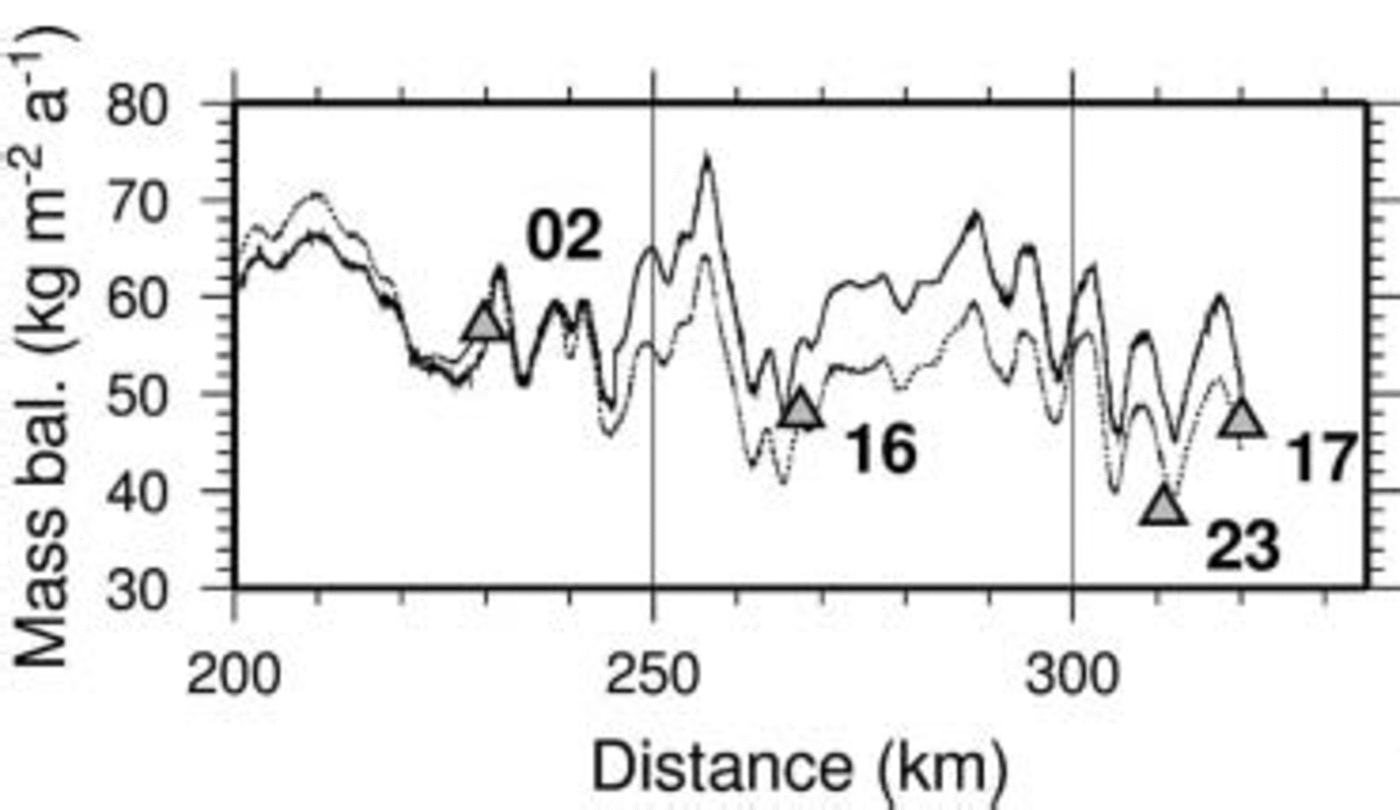
In contrast, at DML23, increased antenna ringing causes a noisy radargram in the upper 20m (∼200 ns) of the ice column. Hence, our reference IRH has likely been incorrectly tracked, leading to an underestimation of the calculated accumulation rate. Noise caused by antenna ringing decreases with increasing travel time. Repeating the whole calculation process for a deeper reflection horizon, linked to the year AD 1619, produces an accumulation rate that again matches with the core data (Fig. 5), confirming that the AD 1817 IRH includes a larger error between DML16 and DML17.
Surface mass-balance profiles obtained from two IRHs of different age, dated to AD 1817 (upper solid line) and AD 1619 (lower dashed line). The deeper buried reflection horizon (dashed line) better reproduces mass-balance values obtained from core analysis (triangles) at locations DML16, DML23 and DML17 (indicated next to the symbols).
5. Conclusions
We successfully used IPR to map the accumulation variation on the Amundsenisen plateau, increasing the spatial resolution of previous accumulation studies. Our results confirm findings of earlier studies that IPR surveys are capable of providing detailed information on surface mass-balance rates along continuous linear profiles, which cannot be provided by point sampling. Calculation of surface mass balance, however, still depends on an exact knowledge of the density–depth distribution along the survey route and dating of observed internal layers, which must be supplied by ice-core data. As radar surveys and point sampling of firn and ice cores along the route complement each other, the two methods should always be combined to ensure cross-check measurements.
Naturally, small-scale variations cannot be resolved by wide-spaced sampling locations. In general, however, point measurements are capable of determining regional trends, associated with meteorological conditions rather than flow features. Interpolations may thus yield an overview of the general distribution of accumulation for wider areas. However, being susceptible to over- and underestimations due to outliers, these have to be taken with care. Future studies should be optimized by a well-balanced aerial sampling scheme, sufficient for applying more sophisticated interpolation algorithms based on geostatistical correlation analyses.
Small surface undulations caused by bedrock topography are likely responsible for variations of the accumulation pattern on the generally smooth high-altitude plateau of DML. Deriving the temporal variation of accumulation rates from either ice-core profiles or IRHs at different depths of the ice column therefore requires a detailed understanding of the interaction between bedrock relief and ice flow, resulting in surface undulations and thus disturbances in a homogeneous precipitation pattern. To overcome two-dimensional limitations of IPR surveys, either an aerial IPR survey set-up or satellite remote sensing should be applied to obtain a three-dimensional picture of the internal structure, and thus accumulation. This will require the interpretation of backscattering signatures of other radar sensors in connection with known accumulation patterns.
Acknowledgements
Preparation of the manuscript profited greatly from discussions with W. Rack and D. Steinhage. The important contribution of the field parties during data acquisition is gratefully acknowledged. Preparation of this work was supported by Deutsche Forschungsgemeinschaft grant Niñ493/1 and two scholarships of the Studienstiftung des Deutschen Volkes. This work is a contribution to the ‘European Project for Ice Coring in Antarctica’ (EPICA), a joint European Science Foundation (ESF))/European Commission (EC) scientific programme, funded by the EC and by national contributions from Belgium, Denmark, France, Germany, Italy, the Netherlands, Norway, Sweden, Switzerland and the United Kingdom. This is EPICA publication No. 116.



