INTRODUCTION
The Critical Zone (CZ), which extends from the top canopy to bedrock or bottom of the groundwater, supports terrestrial life (Brantley et al. Reference Brantley, Goldhaber and Ragnarsdottir2007), which includes the biogeochemical cycling system. Short-term soil weathering and long-term soil denudation, plus soil production determines the ultimate structure and function in the CZ (Heimsath et al. Reference Heimsath, DiBiase and Whipple2012). The abundance of soil organic carbon (SOC) greatly impacts CZ development, soil formation (Dawson et al. Reference Dawson, Ugolini, Hrutfiord and Zachara1978), mineral weathering (Raulund-Rasmussen et al. Reference Raulund-Rasmussen, Borrggaard, Hansen and Olsson1998), and pollutant transport (Kalbitz et al. Reference Kalbitz, Popp, Geyer and Hanschmann1997). However, the large variability in the rate of soil formation and cycling of SOC is linked to changes in the environment (Kalbitz et al. Reference Kalbitz, Solinger, Park, Michalzik and Matzner2000; Hicks Pries et al. Reference Hicks Pries, Castanha, Porras and Torn2017). The potential impact of pedological processes on the biogeochemical cycling system remains one of the great uncertainties in our understanding of global climate change (Davidson and Janssens Reference Davidson and Janssens2006; Heimann and Reichstein Reference Heimann and Reichstein2008; Hicks Pries et al. Reference Hicks Pries, Castanha, Porras and Torn2017). Quantification of soil formation rates is needed to track the evolutionary trajectory of the CZ across different temporal and spatial scales (Hicks Pries et al. Reference Hicks Pries, Castanha, Porras and Torn2017).
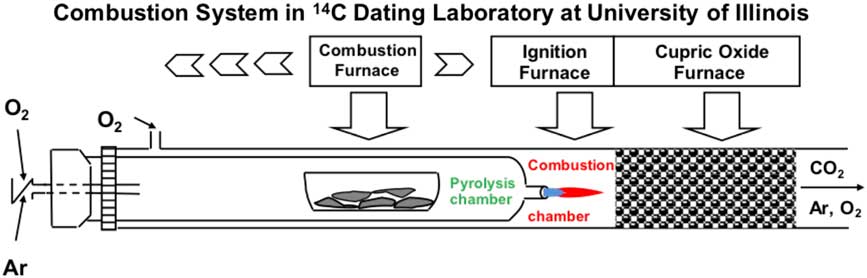
In this study, we examine SOC accumulation, erosion, and leaching, and the dynamic connections in the weathering and unweathered zones by accelerator mass spectrometry radiocarbon (AMS 14C) and δ13C analyses performed on the labile and inert pools of carbon, and variation in total SOC and CC content on an intensively managed landscape. The study site is located in the Intensively Managed Landscapes Critical Zone Observatory (IMLCZO) in central Illinois, USA (Kumar Reference Kumar2015). The high temperature (800°C) and low pressure pyrolysis-combustion technique (Wang et al. Reference Wang, Hackley, Panno, Coleman, Liu and Brown2003; Figure 1) was used to partition total SOC into pyrolysis-volatile (labile) and pyrolysis-resistant (inert) pools. The labile (active) SOC pool, characterized as a simple alkyl group derived mainly from materials containing carbohydrates and proteins (Berendse et al. Reference Berendse, Berg and Bosatta1985; Rovira and Vallyjo Reference Rovira and Vallyjo2002; Wang et al. Reference Wang, Hackley, Panno, Coleman, Liu and Brown2003) is susceptible to microbial decay, with fast turnover rates (Hoyle and Murphy Reference Hoyle and Murphy2006). The inert (refractory) SOC pool, characterized as complicated poly-phenol (aryl) group compounds is derived mainly from lipids and lignins (Berendse et al. Reference Berendse, Berg and Bosatta1985; Rovira and Vallyjo Reference Rovira and Vallyjo2002; Wang et al. Reference Wang, Hackley, Panno, Coleman, Liu and Brown2003), and is resistant to biogeochemical degradation. Typically, inert SOC has a turnover rate of thousands to tens of thousands of years (Huang et al. Reference Huang, Li, Bryant, Bol and Eglinton1999; Trumbore Reference Trumbore2000; Wang et al. Reference Wang, Hackley, Panno, Coleman, Liu and Brown2003).
Diagrammatic representation of the Pyrolysis-combustion system (modified from Wang et al. Reference Wang, Hackley, Panno, Coleman, Liu and Brown2003). The inner tube (pyrolysis chamber) is connected to the outer tube (combustion chamber) through a small orifice in the inner tube. The inner tube is purged with Ar and the outer tube is purged with O2 gas. Volatile compounds from samples released during pyrolysis at 800°C are carried to the combustion chamber by Ar gas through the orifice where it is oxidized giving off CO2. Afterwards, the pyrolysis resistant compounds in the pyrolysis chamber are combusted by switching Ar to O2 gas to generate CO2. Two aliquots of the CO2 are collected from one sample for AMS 14C dating and stable carbon isotope analyses.

Since this SOC is derived from decomposition of litter fall, roots, and microbial decay of near surface humus-rich soil (Rumpel and Kogel-Knabner 2011; Richter and Billings Reference Richter and Billings2015; Angst et al. Reference Angst, John, Mueller, Kögel-Knabner and Rethemeyer2016), sparsely vegetated and/or landscapes with thin or eroded topsoil do not contribute sufficient SOC to the substrata, which results in a younger-to-older 14C age pattern in labile and inert carbons. The input of SOC where dense vegetation with strong bioturbation, intensive farming, and warmer and/or wetter climatic conditions predominates could overwhelm the residual composition of labile and inert SOC pools (Sanderman et al. Reference Sanderman, Baisden and Fallon2016), diminishing this younger-to-older 14C age pattern. The depth, at which this process occurs, could be used to model interactions along the boundary between the weathered and pristine soil horizons. With the depth, the SOC content is expected to decrease from a maximum in the organic-rich surface soil to a constant value or background characteristics of unweathered sediments. The concentration of CC is primarily controlled by leaching and is expected to increase from nearly zero at the land surface to high concentration at this depth. In glaciated landscapes of the Midwest United States, such as in central Illinois, the CC content is derived mainly from dolomite, which is more resistant to leaching than calcium carbonate and the sudden increase is an important indicator for modeling the boundary between weathered and pristine soil horizons.
MATERIALS AND METHODS
Study Site and sampling
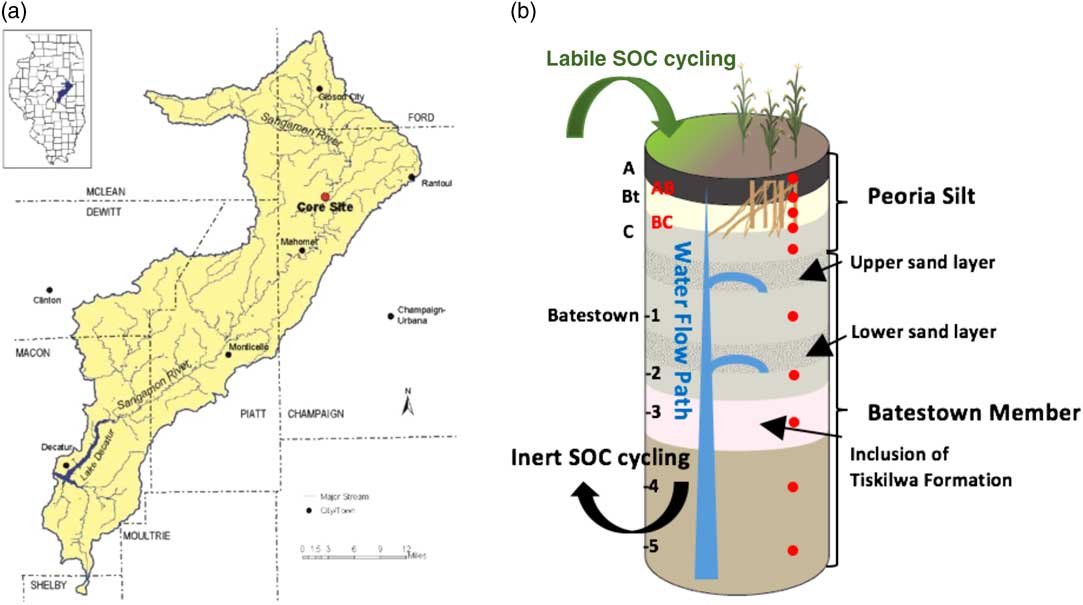
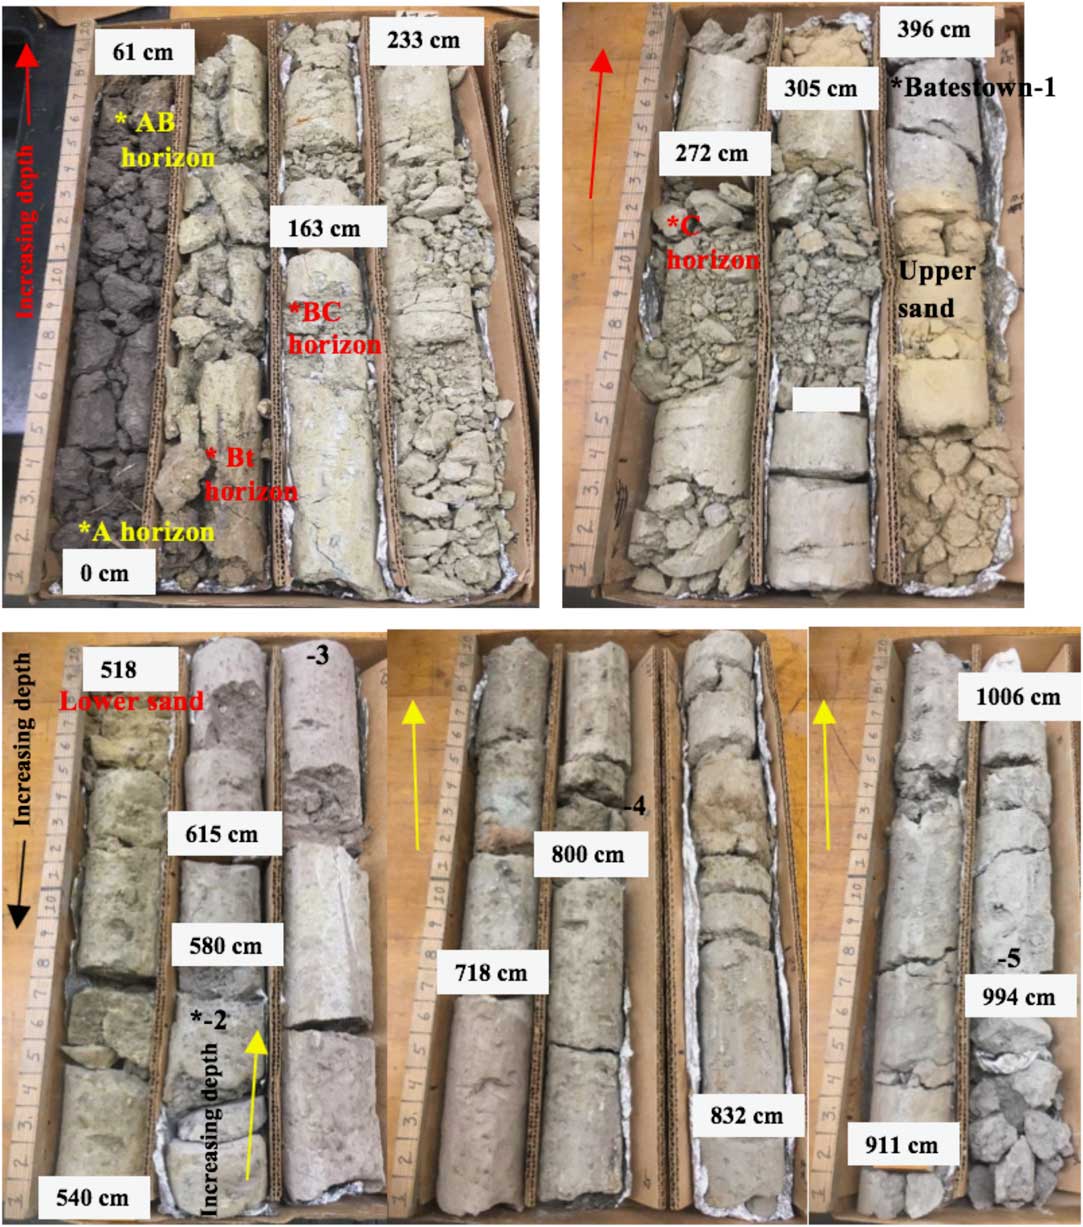
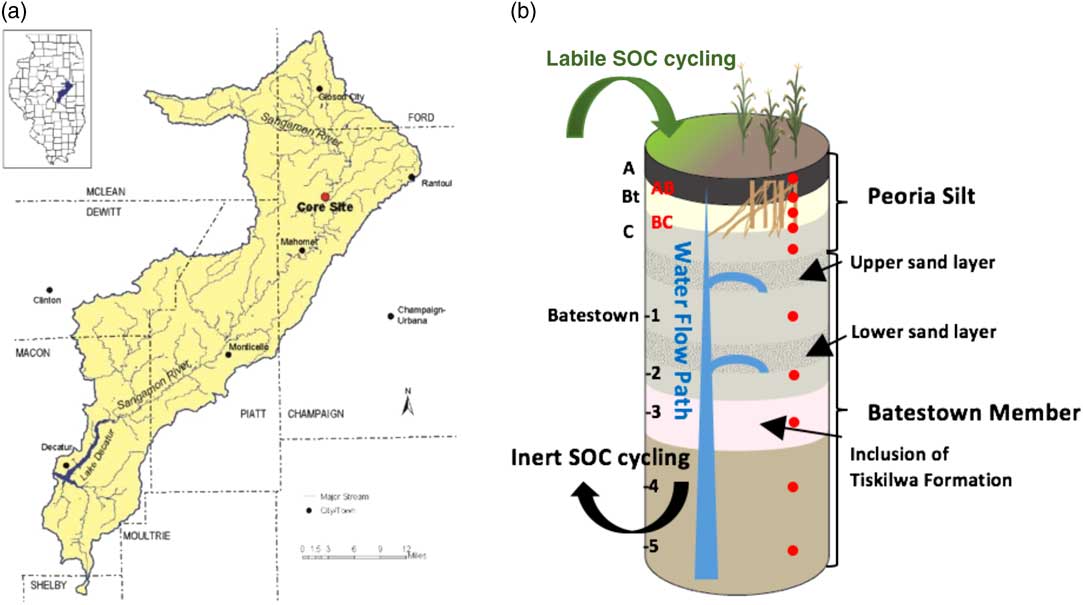
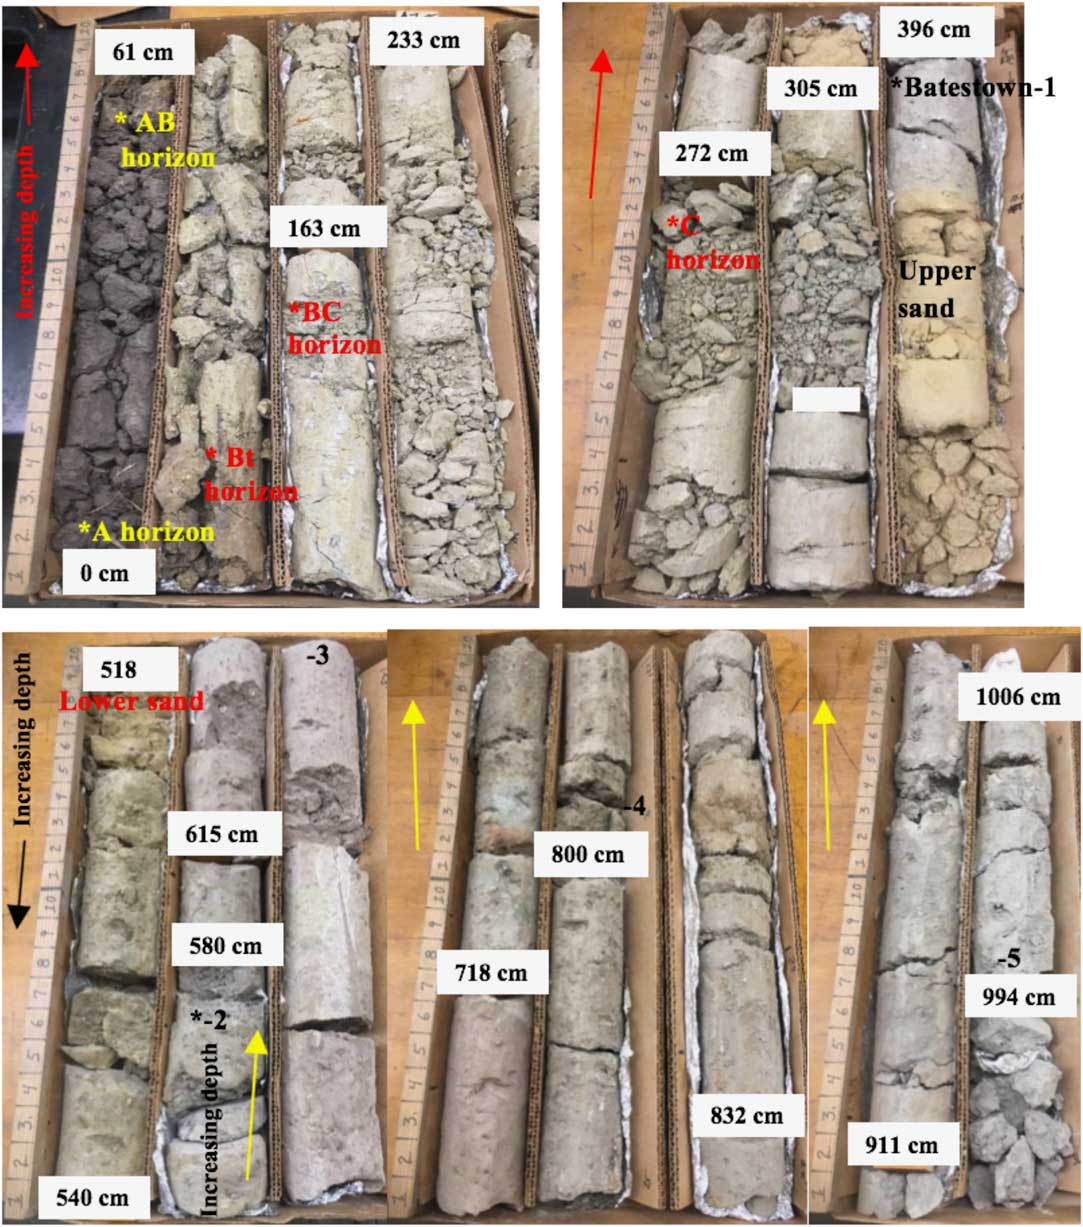
Ten samples were taken from a 10-m-long continuous sediment core acquired at the Sangamon River field site (N40.281539°, W88.355576°). The site is located in tallgrass prairie, which was recently restored from cultivated corn-soybean agricultural land. The site is situated on a morainal upland adjacent to the floodplain of the Sangamon River (Figure 2a) that was formed during the last (Wisconsin Episode) glaciation. The major components of the CZ at the site include a weathered zone with a soil developed in loess and unweathered glacial till with two outwash sand layers (Figures 2b and 3). The uppermost five samples were collected from the modern soil profile developed in the Peoria Silt (loess), which is classified as a Molisol, containing a thick organic-rich A horizon and clayey argillic Bt horizon. These samples were taken from the A, AB, Bt, BC, and C soil horizons at the depths of 0.30 m, 0.58 m, 0.88 m, 1.55 m, and 2.62 m. The lower five samples were collected from unweathered Batestown Member till (Lemont Formation), which was deposited by the Laurentide Ice Sheet when the Upper Sangamon River Basin was glaciated prior to 23,000 calibrated years before present (BP) (Grimley et al. Reference Grimley, Anders and Stumpf2016). These till samples were taken at depths of 3.93 m, 5.61 m, 6.80 m, 8.02 m, and 9.97 m (Figures 2b and 3).
(a) Map of the Intensively Managed Landscapes Critical Zone Observatory field area in central Illinois showing the location of the core site. The borehole from which the core was taken was drilled in 2014. (b) Stratigraphy in the borehole, including modern soil developed in the Peoria Silt and underlying unweathered Batestown Member till. The local subsurface hydrologic system includes two layers of glaciofluvial sand and gravel. Samples of the modern soil were collected from the A, AB, Bt, BC, and C soil horizons, and samples of the unweathered till are identified as Batestown-1, -2, -3, -4, and -5 locations. The depths of sampling are denoted by the red solid circles. The illustration is modified after von Blanckenburg and Schuessler (Reference von Blanckenburg and Schuessler2014). The brief description of samples are: A horizon: dark; organic rich silt; granular; AB horizon: brownish grey; organic silt; Bt horizon: reddish clay; blocky; Fe/Mn stain; BC horizon: grey; calcareous, silt; Batestown-1; -2: greenish, gravel/sand/clay; -3: pinkish, gravel/sand/clay; -4: brownish, gravel/sand/clay; -5: greenish, gravel/sand/clay. (See online version for colors.)
The sediment core collected at the Sangamon River site is 10 m long (from upper left to lower right) with sampling depths. The modern soil was sampled in A, AB, Bt, BC, C soil horizons. The unweathered Batestown Member till was sampled and labeled Batestown-1, -2, -3, -4, and -5. The upper and lower sand and gravel layers occur between the C soil horizon and the Batestown-1, and Batestown-1 and Batestown-2 samples. No core was recovered between the 396 and 518 cm depths.
Composition of Sampled Materials
The A soil horizon, the first mineral horizon below the litter zone, is rich in organic matter with the highest SOC content. The AB soil horizon is a transition zone from the A to clay-rich Bt horizons, and SOC in the A and AB soil horizons is derived primarily through the decomposition of vegetation, roots and fauna and root exudation, the microbial decay of soil humus, and most importantly, tilling of residue from cultivated corn and soybeans. In the A and AB soil horizons, carbon cycling that occurs between the biosphere and geosphere has found to be the most vigorous (Rumpel and Kogel-Knabner 2011; Richter and Billings Reference Richter and Billings2015; Angst et al. Reference Angst, John, Mueller, Kögel-Knabner and Rethemeyer2016). The Bt soil horizon is rich in eluviated clay minerals, and iron/aluminum hydroxide and oxide, represented by the argillic horizon and reddish color. Dissolved SOC leaches into this horizon (McDowell and Wood Reference McDowell and Wood1984) and is irreversibly absorbed by iron and aluminum hydroxides and oxides (Gu et al. Reference Gu, Schmitt, Chen, Liang and McCarthy1994) and clay minerals, such as kaolinite (Jardine et al. Reference Jardine, Weber and McCarthy1989). These constituents in Bt horizon form clay−humus complexes that are stabilizing dissolved SOC (Lutzow et al. Reference Lutzow, Kogel-Knabner, Ekschmitt, Matzner, Guggenberger, Marschner and Flessa2006). The BC soil horizon is the transition zone from the Bt to C horizons. In this horizon, a portion of the dissolved SOC may be adsorbed and interact with the antecedent carbon pools from weathering of minerals or transported by groundwater from buried organic deposits. We anticipate a significant decrease in SOC and corresponding increase of CC within the BC and parent soil C horizons.
The presence of sand inclusion at the base of the loess, and intra-units of sand and gravel in the till (Figures 2b and 3) are characteristics of deposits in ice-contact and subglacial environments (Dreimanis Reference Dreimanis1988). The higher water holding capacity of sand and gravel controls the local hydrology, and possibly the carbon cycling dynamics. The age date from Grimley et al (Reference Grimley, Anders and Stumpf2016) provides a reference to establish a chronology for SOC in the unweathered till, which was derived from contemporaneous or older sources.
Sample Preparation Methods
The Radiocarbon Dating Laboratory at the Illinois State Geological Survey (ISGS), Prairie Research Institute, University of Illinois at Urbana-Champaign, is equipped with a uniquely designed combustion system that consists of a concentric inner quartz tube with Ar for pyrolysis and an outer quartz tube with O2 for combustion. The two tubes are connected only through an orifice in the inner tube downstream from the pyrolysis section (Figure 1). During pyrolysis at 800ºC, the Ar carrier gas transports volatile or labile carbon compounds released from the soil samples in the inner tube into the outer tube through the small orifice where combustion by O2 occurs forming CO2. The high temperature pyrolysis-resistant or inert carbon compounds are oxidized afterward with O2 to replace Ar gas in the inner tube (Figure 1) generating second aliquot of CO2 for two separate AMS 14C dates and δ13C values.
Air-dried soil and sediment samples were gently crushed using a mortar and pestle and sieved through 320 μm grid size. Approximately 10 g of material was placed in 50 mL beakers with 20 mL of 2 M HCl to dissolve and remove the carbonate minerals. The beakers were placed on a hot plate and boiled for 0.5 hr, and were periodically stirring using a glass rod. An additional 20 mL of 2 M HCl was added and continuously boiled for 1.5 hr. The beakers were removed from the hot plate and covered loosely by heavy-duty aluminum foil overnight. The residual solution was filtered using quartz filter paper and wet-rinsing with deionized water until the pH of the solution reached 6.0. The soil sample was placed back into the same beaker and the quartz filter paper discarded. The beakers were oven dried at 70°C overnight. Approximately 1–5 g of the dried sample (depending on the concentration of SOC) was weighed into the combustion boat and inserted into the pyrolysis chamber (Figure 1). The pyrolysis-combustion system was evacuated to create a vacuum. After the copper oxide, ignition, and combustion furnaces reach 800ºC (Figure 1), the pyrolysis chamber was purged with argon gas and the combustion chamber purged with O2 gas until the pressure reached 1.5 psi. A positive pressure in the combustion system and a full vacuum in the collection system are maintained by a needle valve. The positive pressure inhibits contamination of the combustion system by atmospheric CO2, if unexpected leak occurs. The pressure also propels gas flow forward with the vacuum driving force at the downstream of the system. Flow meters are adjusted to a 1:1 ratio between the inner and outer chambers.
The combustion furnace was moved forward so that it wrapped around the sample boat for pyrolysis. Thermally volatile compounds of organic-rich soil sample ignited at the orifice in the pyrolysis chamber until all the compounds were completely removed. For materials with low organic carbon content without the flame of volatile compounds, the pyrolysis was performed in about 20–30 min, when the overshooting temperature in the combustion furnace (Figure 1) stabilized back to 800°C, suggesting that the exothermal reactions had ceased. Both aliquots of CO2 were transferred separately into the manometer using a small vacuum system to prepare samples for AMS 14C dating and δ13C analysis.
Several reference samples were also combusted using the pyrolysis-combustion vacuum system to QA/QC the analyses. The Oxalic Acid II, reference sample from the National Institute of Standard Technology, the Fourth International Radiocarbon Intercomparison (FIRI) sample D (wood), and ISGS deadwood blanks were processed with the core samples. All purified CO2 samples with the volume equivalent to 0.5−1.0 mg carbon were submitted to the Keck Carbon Cycle AMS Laboratory at the University of California, Irvine, for AMS 14C dating analysis by the hydrogen reduction method (Southon Reference Southon2007) with δ13C values measured on prepared graphite (for isotope correction only). All results are corrected for isotopic fractionation according to the conventions of Stuiver and Polach (Reference Stuiver and Polach1977). Sample preparation backgrounds were subtracted based on the measurements from deadwood blanks. All 14C dates are calibrated using the online IntCal13 (Calib 7.1) (Reimer et at al. Reference Reimer, Bard, Bayliss, Beck, Blackwell, Bronk Ramsey, Buck, Cheng, Edwards, Friedrich, Grootes, Guilderson, Haflidason, Hajdas, Hatté, Heaton, Hogg, Hughen, Kaiser, Kromer, Manning, Niu, Reimer, Richards, Scott, Southon, Turney and van der Plicht2013). The δ13C values for carbon cycling study were determined using the ISGS Finnegan 252 isotope ratio mass spectrometer with a dual inlet device.
RESULTS AND DISCUSSION
AMS 14C Dating of Labile and Inert SOC
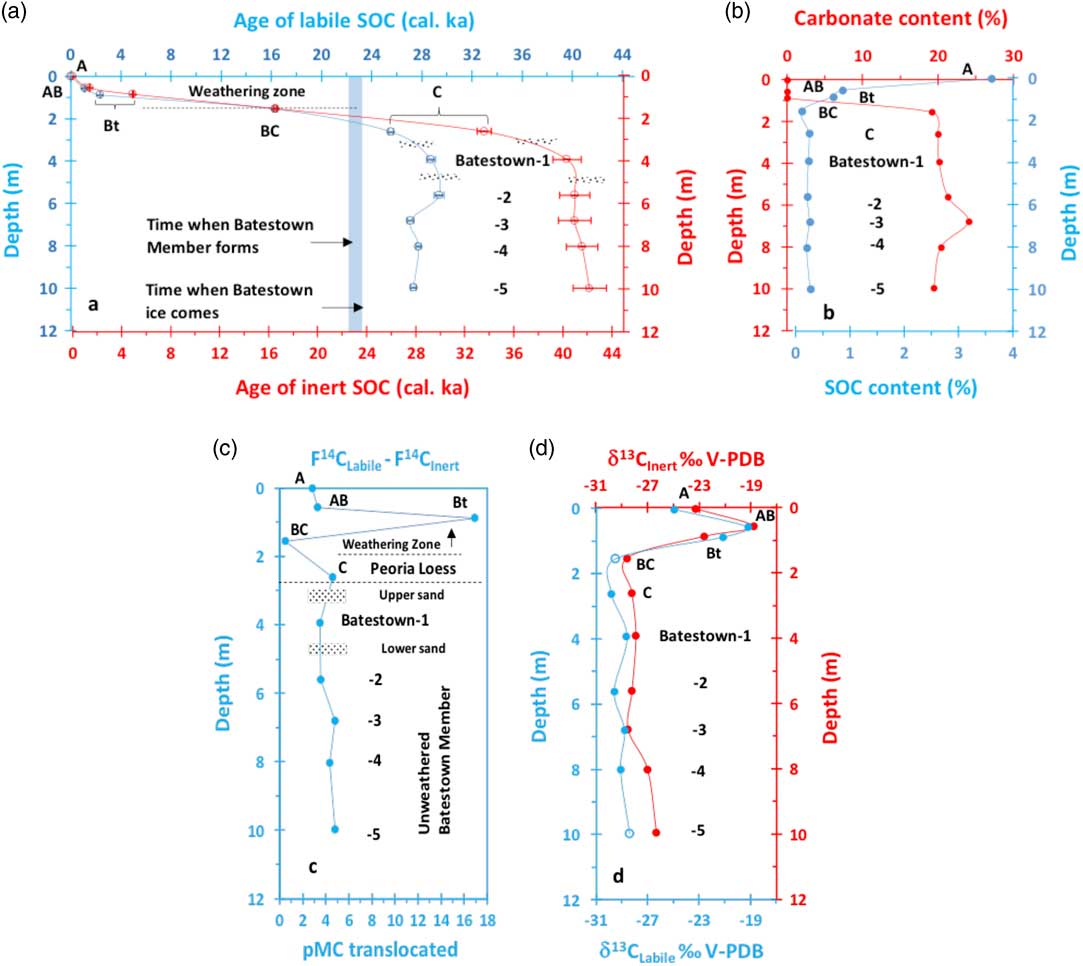
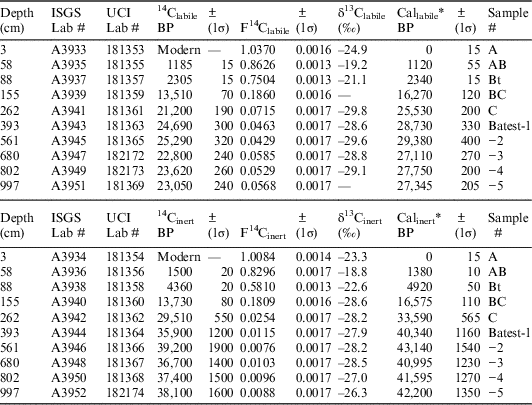
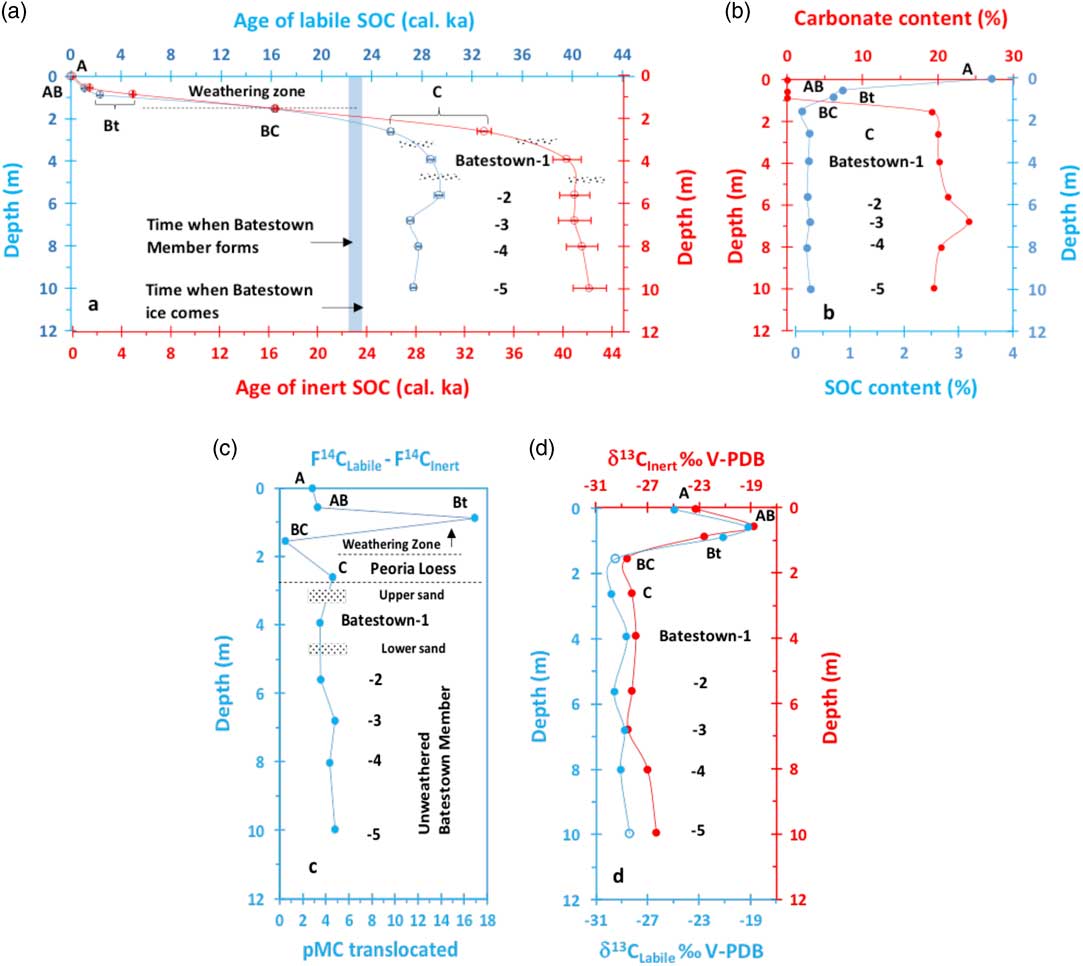
Small differences between the AMS 14C ages of the two carbon pools were observed in the A, AB, and BC soil horizons. However, the labile carbon in the Bt soil horizon is 2000 years younger than the inert carbon (Figure 4a). However, the pools of labile and inert carbon in the C soil horizon and Batestown Member till yield significantly different ages. The age of labile carbon ranges from 25,530–29,380 calibrated years BP, ~8,000–14,800 years younger than the inert carbon, which was dated to be 33,590–43,125 calibrated years BP (Tables 1 and 2; Figure 4a). The sequential AMS 14C dates do not correlate with increasing depth, and both pools of carbon yield unexpectedly older ages compared with the Batestown Member till (Figure 4a). This variance suggests that SOC from an old source was incorporated into the glacial sediments.
(a) AMS 14C dates of labile (blue) and inert (red) SOC pools at the Sangamon River site. Overlapping 14C dates are observed in the upper 1.55 m, except in the Bt soil horizon. A large offset of 14C dates occurs below the C soil horizon in the unweathered Batestown Member till. (b) SOC (blue) and CC (red) content variations show a large shift at 1.55 m depth in the BC soil horizon. (c) We estimate that <3.5−4.5% modern carbon (pMC) equivalent SOC was translocated into deeper subsurface. (d) The δ13C profiles of labile (blue) and inert (red) carbon pools. The two open circles for the labile carbon are modeled δ13C values based on the proportional decrease/increase of δ13C in the inert carbon pool. (See online version for colors.)
Results of AMS 14C dating using high temperature pyrolysis-combustion pretreatment.

Batest=Batestown member; Cal=calibrated; F14C=fraction of modern carbon.
* Using IntCal13.
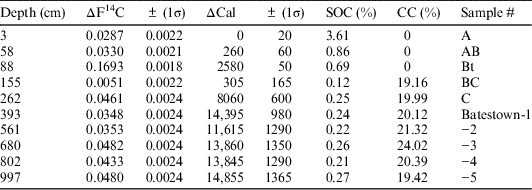
ΔF14C between labile and inert carbon pools, SOC, and CC content.

CC=carbonate carbon; Cal=calibrated.
We attribute the “overlapping” 14C dates in the A, AB, and BC soil horizons to represent persistent turnover of SOC from decomposition of prairie vegetation and corn residue, from soil humus and root exudation, microbial decay of roots, and bioturbation mixing over the last 18,000 years (Figure 4a). We suggest that the observed differential rates in cycling of the labile and inert carbon in the Bt soil horizon confirm the interaction between dissolved modern SOC and minerals, translocation, and accretion at this site, while the older-than-expected 14C dates in the unweathered zone suggest that the pools of labile and inert carbon have not turned over since deposition occurred. Over such a long time period, however, a small amount of modern labile SOC is expected to be translocated into the unweathered zone, resulting in 14C ages of labile SOC pools significantly younger (Figure 4a).
In the weathering zone, the production of SOC is inferred to be greater than its loss because of the high SOC content in A, AB, and Bt horizons (Figure 4b; Table 2). The soil formation rate can be derived by dividing the thickness of the modern soil of 1.55 m, marked by the bottom of the weathering zone or the BC soil horizon, by 16,300 years (Figure 4a). At 1.55 m depth, the age-depth trajectories of labile and inert carbon start to diverge and the linear age-depth relationship abruptly begins to disappear (Figure 4a). This pattern is used to define the weathering zone above 1.55 m depth (Figure 4a). From these inferences, the soil is estimated to accumulate at a rate ~0.95 cm/100 years over the last 16,300 years. Such an accumulation rate suggests that the vegetation has stabilized the landscape, and there has not been any large eolian depositional event during the time period (Figure 4a).
Variations in SOC and CC Contents
The total SOC content was found to decrease from 3.61% in the A soil horizon to 0.12% in BC soil horizon in the upper 1.55 m (Figure 4b; Table 2). The minimum at 1.55 m is considered the background value in the modern soil profile. The SOC content in the C soil horizon and underlying unweathered Batestown Member till remains low ranging from 0.21–0.27%. The decrease in total SOC to background at 1.55 m provides the independent evidence to support the pattern of AMS 14C content of labile and inert SOC pools to define the weathering zone and unweathered sediments (Figure 4a). Furthermore, the measured CC content in the soil represents the leaching index, which increases from 0% in A, AB, and Bt soil horizons to >19% in the BC soil horizon at 1.55 m. Below this depth, the CC content varies from ~20% to >24% (Figure 4b; Table 2). The variation in CC content also confirms the depth of intensive weathering. The highest CC content, measured in sample Batestown-3 (Figure 4b; Table 2), either reflects a change in provenance or lowest leaching intensity. It is clear that the CC content is inversely correlated to the total SOC content.
Variations of AMS 14C in Labile and Inert SOC
The differences of F14C (fraction of modern carbon) between labile and inert carbon was found to increase from 2.87–16.93% of modern carbon (pMC) in the A, AB, Bt soils horizons, respectively, and then decrease significantly to between 0.51–4.61 pMC in the BC and C soil horizons. In the unweathered zone, the pMC varied from 3.48–4.82 (Figure 4c; Table 2), but did not follow a linear trend with depth. The difference in AMS 14C contents between the two SOC pools (expressed as ΔF14C), quantifies pMC equivalence and associated potential pollutants that are translocated deeper into the subsurface (Figure 4c; Table 2). The amount of modern carbon that was translocated from the land surface into the deeper strata is consistently between 3 and 5%, except for the Bt soil horizons (Figure 4c; Table 2). Therefore, the 17% excess in modern carbon in the SOC labile pool compared to the inert pool within the Bt soil horizon suggests biogeochemical interactions between the clay and iron/aluminum minerals and the dissolved modern SOC irreversibly fixed the SOC into “humus-clay” complexes. Because the dissolved modern SOC was largely removed when passing through the Bt soil horizon, the ΔF14C measured in BC soil horizon is much lower and is the lowest ΔF14C measured in the entire profile (Figure 4c; Table 2). This interpretation is supported by the decrease in total SOC content to the background value and increase in total CC content to a maximum in the BC soil horizon (Figure 4b; Table 2). Below the BC horizon, the translocation of modern SOC and associated potential pollutants remains slow, having ΔF14C values between 3.5−4.8% (Figure 4c; Table 2).
δ13C in Labile and Inert SOC
The δ13C values in the labile and inert carbon pools of the A soil horizon, ranging from −24.9 to −23.3‰ (Figure 4d; Table 1) reflect a strong influence of C3 prairie plants. Because the prairie was restored at the site within the last 7 years, the turnover from C4 carbon pool with average δ13C value of −13‰ (O’Leary Reference O’Leary1981) to C3 carbon pool with δ13C value of −24.9 to −23.3‰ occurred fast. The δ13C values from −19.2 to −18.8‰ for the labile and the inert carbon pools in the AB soil horizon increase by 23 and 20% compared to δ13C values in the A horizon. It results from a superposition of C3-dominant prairie signal on the pure C4 cornfield signal. The δ13C values from −21.1 to −22.6‰ in the Bt horizon indicate prevailed aboriginal prairie ecosystem with some superposition of C4 vegetation through leaching process.
The δ13C values −28.2 to −29.8‰ for labile and inert carbon in the BC and C soil horizons reflect a dominant boreal forest ecosystem that would have prevailed during deposition of the loess. Although, the δ13C values cannot be used to reconstruct the local biome developed in the Batestown Member till because old detrital organic carbon is present in the till that is from different sources, these low δ13C values reveal that the carbon sources in the Batestown Member till sediments originated from cool-wet adapted boreal forest components that were incorporated into the glacial diamictons. Indeed, stable carbon isotopic compositions of labile and inert SOC pools consistently agree with the AMS 14C dating results and further explain the SOC cycling dynamics.
CONCLUSIONS
Combining AMS 14C dating with high temperature pyrolysis-combustion technique has allowed us to quantify the rates of labile and inert carbon cycling at a restored prairie within an intensively managed landscape. The content of AMS 14C provide a chronology for the production and retention of labile and inert carbon, which returned distinctive age-depth patterns that are used to define the limits of weathering in the CZ. The variations in total SOC and CC (mainly from dolomite) content delineate the boundary between the weathered and unweathered zones. These results reveal that SOC production in the weathered zone exceeds its loss, and a small amount (3−5%) of modern equivalent carbon (except in the Bt soil horizon) was translocated deeper in to the subsurface. The ~17% excess in modern carbon measured in the labile SOC pool in the Bt soil horizon suggests the dissolved modern SOC was irreversibly fixated to clay and iron oxides minerals. The variation in ΔF14C between the labile and inert carbon pools further suggests that less than 3.5−4.8% of pMC equivalent SOC is reached to the lower part of the CZ. Stable carbon isotopic compositions of labile and inert SOC further reveal the variability in the SOC cycling dynamics. The application of this unique high temperature pyrolysis-combustion technology for AMS 14C dating analysis provide a new approach for quantifying and predicting biogeochemical cycling of SOC in the CZ.
ACKNOWLEDGMENTS
This research was supported in part by the National Science Foundation grant EAR 1331906 for the Critical Zone Observatory for Intensively Managed Landscapes (IML-CZO) to P. Kumar. We thank B. Brandon Curry, Susana Roque-Malo, and Meredith Richardson for scientific and editorial review of the paper. We thank John Southon at the Keck Carbon Cycle AMS Laboratory at the University of California, Irvine, for graphitization and AMS 14C measurement, and for scientific comments. We also thank the two anonymous reviewers for their comments and suggestions.