


1.Introduction
Ice is an extremely brittle material. Yet at very low loading rates, ice creeps, dissipating energy mainly as heat. This is not a result of the loading rate per se, but rather the result of the fact that the creep process keeps the load, and consequently the strain-energy density, at a level low enough to preclude fracture. Once this density exceeds a critical value, fracture processes take place. These can consist of tensile fractures (splitting or flexural) and also crushing in compression.
The present work concentrates on the crushing of ice in indentation, and is focussed particularly on the results of a test series in which a flat indenter is pushed at constant rate through a level ice sheet. In an earlier paper by the authors (Reference Timco and JordaanTimco and Jordaan, 1987), it was shown that due consideration should be given to two different aspects of the indentation process. These are:
(1) The pulverization (crushing) of the ice.
(2) The clearing of the products in the pulverized zone.
Of special interest is the relation of these events to the force—time variation. These time series were discussed in the reference noted above, and it was concluded that sudden drops in load were associated with pulverization of ice ahead of the indenter and that the clearing of crushed ice carried on continuously. A mechanism along these lines with almost instantaneous pulverization had been suggested to explain the dynamic action of ice in the crushing mode (Reference JordaanJordaan, 1987). It is important to test these assumptions by a detailed analysis, and also to analyse the exchanges of energy in the process so as to assist in an understanding of the indentation process.
With regard to previous work, a number of articles deal with the crushing process in ice on both rigid and flexible structures. Some of the earlier studies were concerned with the development of an analogue model of the crushing process (Reference Matlock, Dawkins and PanakMatlock and others, 1971; Reference Swamidas, Reddy and PurcellSwamidas and others, 1977). Reference MäättänenMäättänen (1978) dealt with flexible structures, in particular lighthouses, and presented analysis methods for this kind of structure. There have also been a number of experimental investigations in the laboratory using model ice, primarily by Reference MäättänenMäättänen (1983) and Reference Sodhi and MorrisSodhi and Morris (1986). A number of researchers have investigated the crushing process in terms of the energy processes involved (Reference Kheysin and LikhomanovKheisin and Likhomanov, 1973; Reference Kurdyumov and KheysinKurdyumov and Kheisin, 1976; Jordaan, Reference Jordaan1986, Reference Jordaan1987; Reference Kivisild, Blanchet, Revill, Lunardini, Sinha, Wang and GoffKivisild and Blanchet, 1987; Reference Timco and JordaanTimco and Jordaan, 1987; Reference Jordaan, Maes and NadreauJordaan and others, 1988). Most recently, Reference Jefferies and WrightJefferies and Wright (1988) presented a very interesting paper on the crushing of ice against the Molipaq structure in the Canadian Beaufort Sea. The papers mentioned above represent only a small number of those published in this area. A recent review by Sodhi (in press) gives more details, to which the reader is referred. Nevertheless, the abundance of work in this area gives a clear indication of the interest in and complexity of the problem of the ice-crushing process.
2. Experimental
Due to the complexity of the interaction process, it is necessary to simplify it as much as possible. A good way to do this is to perform tests of ice crushing under controlled conditions in the laboratory. For the present purposes, edge-loaded penetration of an indenter through an ice sheet is an appropriate experimental approach. A test series was performed in the ice tank in the Hydraulics Laboratory at the National Research Council of Canada in Ottawa using a fine-grained (1–2 mm) columnar S2 ice. A 63.5 mm wide rigid indenter was pushed through a 9 mm thick sheet of ice at a rate of 60 mm s−1. This gives a crushing failure mode of the ice.
The indenter was attached to a high-capacity load cell so the load on it could be determined. The output of the load cell was sampled at a rate of 1000 Hz, and a load-time series of the interaction event was obtained. During the crushing event, the crushed ice was collected and sieved, giving the size and size distribution of the ice pieces. The reader is referred to a recent paper by Reference Timco, Lunardini, Wang, Ayorinde and SodhiTimco (1986) for further details of the experimental arrangement.
Idealization of ice sheet; plan view of (a) photographie representation showing progress of damage, and (b) idealization into three zones

3. Results And Interpretation
3.1. Cracks and the Crushing Process
During the indentation process, micro-cracking in the ice started some distance ahead of the indenter in the zone of compressive stresses. Figure la shows the crack pattern that moves ahead of the indenter; the cracks appear to be aligned along the directions of maximum shear, as indicated in a previous analysis (Reference JordaanJordaan, 1986).
The ice is idealized as shown in Figure 1b. Zone 1 represents the virgin ice; zone 2 represents the ice that is cracked, with some loss of stiffness, whereas zone 3 represents ice that is pulverized to the point where the ice pieces may slide over each other and be ejected from the pulverized zone, that is, they can move independently of each other.
The process of cracking of ice in essentially compressive states of stress is referred to as “damage”; the material can continue to resist stress but its integrity is impaired. Thus, the effect of the cracks in compressive fields is not immediate disintegration of the ice; compressive states are mentioned in the present context since cracks in tension will tend to propagate unstably, leading to splitting of ice pieces. The array of cracks of shorter length with a considerable density is characteristic of compressive states and leads to loss of stiffness, when the stiffness is averaged over a length of ice containing many cracks.
Damage mechanics has been used to study a variety of brittle materials, and several definitions of damage itself have been proposed. It is convenient here to adopt the definition used by Reference Resende and MartinResende and Martin (1984); the damage parameter, λ., is a quantity that varies from 0 (undamaged virgin ice) to 1 (completely pulverized ice). It is given by

where G 0 = shear modulus of virgin ice, and G = shear modulus of damaged ice. This is in line with the approach suggested elsewhere to the effect that the damage to the shear modulus is the most important aspect of the degradation of ice (Jordaan, Reference Jordaan1986, Reference Jordaan1987). Attention is focussed on the total absence of elastic rigidity with regard to shear stress in crushed ice (zone 3), as compared to virgin ice. Pulverized ice that is densely packed would be able to resist volumetric stress in a manner not dissimilar to virgin ice. No doubt, dilatation must occur as the network of micro-cracks forms upon pulverization. These events are likely to occur only at discrete points in time. The strategy in the present approach is that detailed analysis of dilatation and any effect on the bulk modulus (including possible non-linearities) be regarded as “second order” in comparison to shearing and flow.
The progression from virgin to damaged ice is likely to be of the kind illustrated in Figure 2, i.e. the progression to the fully damaged state increases rapidly only as the boundary of the crushed layer is approached. In analysing this problem, it seems reasonable to treat zones 1 and 2 as essentially elastic. Zone 3, on the other hand, could be modelled as a viscous material with its flow motivated by shear stress.
Damage acceleration near the crushed layer. The parameter y denotes the distance from the indenter face along the length of the ice sheet

3.2. The Time Series
A typical time series from the interaction event is shown in Figure 3. It is evident that the loading event is irregular, cyclic, and complex. Clearly, dynamic processes are taking place. To understand the crushing process, it is necessary to try to understand (1) what causes these load-level fluctuations, and (2) what controls the magnitude of the crushing event. To this end, it is instructive to examine the time series in more detail. This was done recently by Reference Timco and JordaanTimco and Jordaan (1987) for the time series shown in Figure 3. They found that there were two predominant frequencies — one at 20 Hz and the other at 50 Hz. Since the interaction speed was constant throughout the test, these frequencies correspond to lengths of 3 mm and 1.2 mm, respectively. In the analysis it was concluded that the lower frequency corresponded to “pulverization” events where the ice in the region directly in front of the indenter crushes into a myriad of small ice pieces. This produces a crushed zone with, on average for this case, a length of 3 mm and a total size of 63.5 mm × 9 mm × 3 mm. It was further suggested that the higher frequency corresponds to either further crushing or large clearing events. The whole process is cyclic with regard to the crushing process — the clearing, on the other hand, is virtually continuous.
Load variation during a half-second time period. The interaction speed was constalll. giving an equivalelll distance of 3 cm.

4. Relative Movements Of The Indenter
The rapid variations in load observed in tests (e.g. Fig. 3) are considered to be associated with pulverization events, resulting in variations about the mean layer thickness discussed above. This variation often appears to be of the order of the layer thickness. In larger-scale interactions the variation in load can be quite regular. A factor that should also be considered is the variation of the actual rate of movement across the pulverized layer that results from elastic movements of the ice and the indenter. For this purpose, a period of time 0.05 s, corresponding to a movement 3 mm, will be considered.
The symbol Kwill be used to denote the composite stiffness of the ice and the indenter; noting that the calculations below are all for the case of unit indenter width, Kwill also be taken as being per unit width. The value of K is calculated from the stiffness of the indenter and the ice. Consider first the loading device (Fig. 4), which deflects a distance δD during the application of load F T = Fw where Ft = total load, F = load per unit width, and w = width of indenter. It is impossible to construct a perfectly rigid device so that in general

where K D = stiffness of loading device (including the load cell), and δD = deflection of loading device (at the ice surface). Equation (2) assumes linear elastic response; in the present instance, this was verified by experiment and it was found that KD = 6 MN m−1 The energy stored in the loading device is (FδD/2) or(K DδD 2/2) or(F 2/2K D).
Cantilever loading device aplying a load F as a result of movement from A to B

As regards the ice sheet, this is 7 m wide; the length is 16 m at maximum, decreasing as the indenter moves through the ice. The edge of the ice sheet is frozen into retaining walls along the sides of the test basin and at the end remote from the indenter. For finite-element modelling purposes, these edges were taken as fixed (Tomin and others, unpublished). For the present purposes, the semi-infinite elastic-plate solution with uniformly distributed edge load is used; various results and the rationale for this choice are given in the Appendix, presented therein as “case C”. The stiffness of the ice sheet is then given by

where K I = 24.0 MNm−1, based on E = 10 000 MPa, for rapid changes in load.
The total variation in load in the complete 0.5 s period (Fig. 3) was aggregated into increases and decreases, giving an average of 5 kN variation (up and down), for a 0.05 s movement period (3 mm average distance). Typically, decreases in load included several quite large decreases and many smaller decreases. We shall investigate the drop of 3.7 kN over a period of time equal to 0.006 s, identified in Figure 3. Given the values of K D and K I noted above, the indenter face and the pulverization front would experience the following relative movement (on the assumption of no pulverization event in the period considered).
Movement of indenter (rigid body) = 0.36 mm
Elastic rebound (indenter, from Equation (2)) = 0.62 mm
Elastic rebound (ice, from Equation (3)) = 0.15 mm
Total = 1.13 mm
It is seen that there is a considerably enhanced relative movement, above the regular advance of the indenter; during increases in load, the reverse would be the case since the elastic movement of the indenter and the ice sheet would tend to reduce the relative movement of the indenter face and the pulverization front. It should be noted that a very rigid indenter (or structure) would result in a negligible elastic rebound (second item in the set of three above).
The value of K may now be determined by considering a mechanical model such as that in Figure 5. Remembering that F is the force per unit width, the total strain energy stored is

substituting Equations (2) and (3), this becomes

Mechanical model for pulverized ice layer, indenter, and ice

and it is seen that

A representative value in our case, substituting
K D = 6 MN m−1, K I, = 24 MN m−1, w = 0.0635 m, is K = 76 MN m−2
5. The Energy Of The Process
To understand further the crushing process, it is instructive to look at the energy involved in the whole process. Using the time series, it is possible to calculate the total energy involved in one cycle of the crushing/clearing process. To do this, it is necessary to make use of the fact that time is equivalent to distance, so that integration under the force—time curve directly gives a quantitative measure of this energy. The total energy (E T) for crushing and clearing one length of the crushed zone is

where v 0 is the indenter speed, F̄ is the mean force, f l is the frequency corresponding to the lowest significant peak in the spectrum, and T s is the time-series record length. In the present case, F̄ = 2660 N, v 0 = 6 cms−1, and f l = 20 Hz, and so Ε τ = 8 J. This energy can be compared to the individual energies of the crushing and clearing processes.
Since the size of both the crushed zone and the ice pieces in the zone are known, it is possible to get a rough estimate of the energy involved in crushing this ice. This can be done by determining the total energy required to create the free surface of the crushed particles. Since there was a range of particle sizes, it is necessary to take this into account in the calculation. The energy for crushing (E Cr) can be estimated by multiplying the surface energy with the total surface area created. This would not include energy dissipated in friction. As previously mentioned (and discussed in detail in Reference Timco and JordaanTimco and Jordaan (1987)), the crushed ice pieces were caught and sieved through screens with openings of 4, 2, 1.2, and 0.71 mm. For this interaction speed, there were more or less equal amounts of crushed ice in each sieve range. Assuming spherical shaped particles, it is possible to predict the crushing energy (E Cr) as

where G c is the energy required to create a new crack surface of unit area, d ¡ is the diameter of the individual ice pieces, p ¡ is the relative amount of crushed ice of size i, the summation over iis taken over each of the five sieve ranges. Since the percentage of the total ice pieces is known in each sieve range (i.e. p ¡) the total crushing energy can be determined. Using an average piece size of 5, 3, 1.6, 0.95, and 0.6 mm in each of the sieve ranges, and energy G C measured on this ice of 0.8 J/m2 (Reference Timco, and, Frederking, Lunardini, Wang, Ayorinde and SodhiTimco and Frederking, 1986), the total crushing energy for one cycle is calculated to be E = 0.006 J. This crushing energy is certainly very small when compared to the total energy for one cycle, E Tof 8 J.
Why should this be? At first glance, this large discrepancy is very unsettling. It would have been thought that the crushing energy (defined as the energy required to create the new surfaces) would be a substantial part of the total energy. Apparently this is not so. When considering the magnitude of the loads in the indentation interaction, however, it becomes clear that this crushing energy must be small. For example, it is relatively easy to fragment a piece of ice corresponding to the size of the crushed zone (63.5 mm ×9 mm × 3 mm) by simply hitting it a few times with a soup spoon. In this case, the forces and energies involved are relatively low. In the indentation tests, however, an average force of 2660 N (or about one-quarter of a ton) was required to break and clear this amount of ice.
The difference between these cases is related to the confinement of the crushed ice. In indentation, the crushed ice is confined by the parent ice sheet, and high energies are required to clear the ice pieces. The analysis clearly shows the great importance of the crushed zone of ice in the whole crushing process. In the following sections, this region is examined in detail.
6. The Crushed Ice Layer
6.1. Ejection and Flow of Pulverized Ice
The geometry of the crushed zone is shown in Figure 6, and a cross-sectional view from the side is shown in Figure 7. The idealized crushed ice is of thickness l, which is regarded as being constant across the width and through the thickness of the ice sheet at any point in time. The ice is ejected from the top and the bottom of the sheet. Various assumptions can be made regarding the thickness variation with time. For example, the modelling of the crushed layer can be done so as to maintain the layer l constant. Ejection of crushed ice and the crushing of solid ice are in perfect balance: the newly crushed ice constitutes a continual inflow into the region designated zone 1. A process of this kind will be termed continuous crushing. This represents an idealized way of modelling the process which is not in accord with observation. Because of heterogeneities in the ice, and the basic instability of the fracture process with the stored elastic energy being released suddenly, the process will not actually be constant; each pulverization “event” will correspond to the pulverization of a finite volume of ice. Therefore, the concept of periodic crushing is introduced: the pulverized zone ahead of the indenter fluctuates continually in size. This represents a realistic physical process. Moreover, it fits in with the observed force-time curve in all indentation tests other than those at slow rates where creep processes predominate. If the fluctuation is regular, a periodic (cyclic) loading on the structure results.
Schematic illustration of pulverized ice layer in continuous indentation experiment

Cross-section through ice and indenler (side view)

For periodic crushing, the indenter is assumed to move with a velocity v0 (Fig. 7), with the pulverization front at the edge of the ice sheet fixed in space. This choice is arbitrary; the analysis could equally well be carried out relative to the indenter, i.e. with the pulverization front moving at velocity v0 to the left. The analysis to follow is therefore intended to apply between the periodic crushing events discussed. During this time interval, ldecreases as the indenter bar approaches the edge of the pulverization front. A symmetrical ejection of crushed ice from the top and bottom of the sheet is assumed, with no flow laterally (out of the plane of Figure 7). Since the indenter is rigid, the only inertial effects are in the crushed ice particles. Values of Reynolds number in the order of 10−5 or less are found, indicating that viscous forces dominate with inertia terms being negligible. The latter are therefore not included in the analysis.
The flow of the crushed ice will now be modelled as that of a Newtonian fluid in which the shear stress is given by  where μ = coefficient of viscosity, and
 = rate of shear strain. Analysis of crushed ice in a single impact (constant layer thickness) treating the crushed material as a viscous fluid has been carried out by Reference Kurdyumov and KheysinKurdyumov and Kheisin (1976) and used in analysis of iceberg impact forces by Reference NevelNevel (1986). An extension to the case of spherical indenters with continuous indentation is given in Reference Jordaan, Maes and NadreauJordaan and others, 1988). In the following, the geometry corresponds to that of a flat indenter moving against a level ice sheet, with extrusion at the top and bottom (Fig. 6). This is different from the spherical geometry used in the references noted. A further difference in the following is that a very thin layer is not initially assumed, and as a consequence continuity at each point (rather than for flow through the layer) is satisfied. Also, the variation of force with time is studied, and not only the conditions at peak force.
We denote the components of velocity of the crushed ice particles with respect to the indenter bar as uin the x (vertical) direction and as ν in the у(horizontal) direction. In general, uis a function of xand yi.e. u = u(x,y). In the case of v, this will be assumed to be a function of у only; this will certainly be true at у= 0 and у = l.
The equation of continuity is: ∂u/∂x = -∂v/∂уusing the coordinate directions as indicated in Figure 7. This suggests the following equation and solution (personal communication from M. Maes, 1987): u(x,y) = v'(y).x + g(.y), on the assumption that ν is a function of уonly. The symbol v' (y) denotes the derivative of ν with respect to y The equations of equilibrium are as follows: ∂p/∂x = μ∇2 u, ∂p/∂y = μ∇2 c, where p= pressure, and ∇2 = (∂ 2/∂x 2 + ∂ 2/∂y 2), the Laplacian.
The following solutions can be obtained:


where p 0 is the mean pressure at x= 0, i.e. the location of maximum mean pressure, and his the ice thickness. In deriving these equations, it has been assumed that the particle velocity in the direction of motion of the indenter, v (y) is equal to the indenter velocity v0 at the indenter face (y = 0) and equal to zero at the solid ice surface (y = l). The value of u (x,y) was also assumed to be 0 at y= 0, and at y = l, i.e. this component of velocity is zero at the solid surfaces due to frictional effects. Other boundary conditions should be considered and explored; for instance, a frictionless surface may be appropriate between crushed ice and certain surfaces. There is a need for research in this general area.
With regard to boundary conditions, the mean pressure at the top and bottom of the sheet can be set to zero. Small self-equilibrating pressures and shear stresses are given by the solution along these two surfaces; the values are small and are negligible for a narrow crushed layer, as in the present case. The mean pressure is denoted p x and is given by

At x = ±(h/2), px = 0 and therefore p 0 = 3 μv 0 h 2/2O 3); using Equations (10) and (11):

and it is seen that p x is a quadratic function of x A more strict analysis would couple the pressure in the crushed ice and the damage process in the neighbouring solid ice. Taking a zero pressure in the crushed ice at the edges of the contact zone can only be a first approximation, since this would not lead to failure of the adjacent solid ice, unless the layer thickness vanishes. More work on the failure process and the relation to the crushed layer is needed.
In a similar manner, it can be shown that this is the same pressure distribution that is obtained for the case of continuous crushing and expulsion, with v (y = l) = 0, and u (x,y) is also the same as the expression above, Equation (9). The force on the indenter per unit width can be found by integrating the pressure of Equation (12) for either periodic or continuous crushing as:

where α = h/l is the ratio of ice thickness to layer thickness. Thus, the force is proportional to (1/l)3, so that as the ice is ejected and the layer thickness decreases
(l → 0) the force increases rapidly until the next pulverization event. Generally α > 1; in the present case for the laboratory tests, α ≃ 3. In full-scale tests, the indications are that α is larger. The main activity in the crushing process is in a narrow layer of crushed ice adjacent to the indenter surface.
Pursuing the observation that the crushed ice layer is narrow, a useful simplification can be obtained by the use of lubrication theory. In this, the approximation is made that the flow parallel to the face of the indenter and to the pulverization front (direction xin Figure 7) greatly exceeds that in the direction of movement of the indenter (y- direction). Thus, ∂p/∂x ≫ ∂p/∂y, u ≫ v ∂ 2 u/∂y 2 ≫ ∂ 2 u/∂x 2, and consequently ∂p/∂x ≃ μ∂ 2 u/∂y 2, with

Since the value of ∂v/∂y is neglected, the condition of continuity at a point cannot be obtained. Instead, continuity along the narrow channel is preserved by noting that

for all x 1,x 2In Equation (15), ū(·) represents the mean value of the parabolic variation of velocity noted above in Equation (14). The value of ί has been taken as a variable in Equation (15) to emphasize that this is permissible in lubrication theory. An attractive possibility for future work is to treat the layer thickness as random, abandoning also the symmetry about the y-axis adopted in the present paper. In the remainder of the paper, Equation (13) will be used in the analysis of the indentation process.
6.2. Layer Thickness: Equilibrium and Variation
Given “average” conditions, we can calculate an equilibrium-layer thickness l on the following basis. Perturbate the layer thickness by the amount δl; for example, let us increase it slightly. The load changes by an amount

the negative sign indicating a decrease in load. As a result, strain energy is released from the ice and the indenter, equal to

using Equations (13) and (16), the positive sign in Equation (17) indicating a release of energy.
To obtain the equilibrium-layer thickness l, we suppose that the energy released by the elastic movement, Equation (17), is just sufficient to pulverize an additional thickness δl of ice; any further increase in l would cause the load to drop to a level where the strain energy released is not sufficient to pulverize the ice any further. Given an energy of pulverization equal to γ per unit volume, the pulverization energy for the perturbation of the layer is (γhδl) per unit width; equating this value to that given in Equation (17) and solving for l = l m, we have

his may also be expressed in dimensionless form as

In the present case, the following values are taken as representive: γ = 0.05 MJ/m3 (this value is likely to be greater for more highly confined ice), K= 76 MN m−2 , h = 0.009 m, μ = 0.1 MPa s, ν 0 = 0.06m/s. The suggested value for viscosity (μ = 0.1 MPa s) has been found to be reasonable in other investigations (e.g. Reference Jordaan, Maes and NadreauJordaan and others, 1988), and is also in the range suggested by Reference Kurdyumov and KheysinKurdyumov and Kheisin (1976). This is an area where further experimental work is urgently needed. Substituting, we find αm = 1.2. For a lower viscosity, say μ = 0.01 MPa s, and a value of γ = 0.5 J/m3 this increases to 3.1. The value of αm is rather insensitive to the value of γ; a reduction by a factor of 10 results in a 30% reduction only in αm. The calculated values of α show reasonable general agreement with the observed αm of the order of 3. Reference Sodhi and MorrisSodhi and Morris (1986) measured values of α in crushing tests at constant velocity against cylindrical indenters, and obtained values of α between 2 and 10*.
It is important to note that it takes time to clear the ice by extrusion. In the present experiment, the elastic movement of the ice is relatively small, as noted earlier. For rigid indenters, the decreases in load would be rapid, since there would be little effort required to clear the crushed ice to accommodate the rebound movement of the indenter and ice (Fig. 8). Under these circumstances, most of the clearing would occur during the increases in load. The rate of decline in load is likely to be governed by the time required to rebound by clearing the (presumably newly created) layer of crushed ice. This becomes significant for flexible indenters. Clearing can occur during increases and decreases in load.
For flexible indenters, energy is stored on load increases. The strain energy is released as work of clearing on the load decreases (schematic)

7. Energy Exchanges During Indentation
The energy corresponding to several processes will now be considered. For this purpose, a characteristic movement of the indenter of 3 mm will again be used. Some of the estimates that follow can be converted to power if one uses the rate of movement of 6 cms−1, but since the load is fluctuating, the power input is not constant. The average load is 2660 N, giving the total work as 8 J (a rate of 160 W) for the 3 mm movement. This work will be largely dissipated, if one assumes that the elastic strain energy (or alternatively, load) is similar at the beginning and the end of the 3 mm cycle. The average energy stored in the indenter device is about 0.6 J, and in the ice, 0.1 J, giving a total of 0.7 J. These numbers are based on the stiffnesses given after Equations (2) and (3).
Taking the same example as before of the 3.7 kN decline in load, from 4.5 to 0.8 kN (Fig. 3), the stored energy varied from 2.1 to 0.1 J, so that the stored elastic strain energy varies from over 2 J to a negligible quantity. This energy causes a fluctuation in the rate of dissipation.
* It is interesting to speculate on the effect of changes in scale, in particular of thickness h. The main effect would be to increase K, and of course h in Equation (19). If the indenter or structure is very rigid, then the main stiffness variation of K is the ice itself and then K would increase in direct proportion to h (i.e. directly with area). As a result, αm α h 3/7 If scale were increased from the present case (approximately I cm thickness) to say 1 m, then αm, would increase (on the above assumptions) by a factor of (100)3/7 or approximately 7. Presumably, scaling of crushed layers is an area that deserves attention in model tests of structures and vessels in ice.
Where is the seat of the dissipation? There are several possibilities which will be examined in turn. It was shown earlier that the work required to create the fracture surfaces in the pulverized zone was 0.006 J. The pulverization of the ice does not provide the explanation, based on the value of 0.05 MJ/m3; this gives a value of 0.1 J for the characteristic zone considered here. The value of 0.05 MJ/m3 is justified as follows. The area under a typical uniaxial stress-strain curve, with a fast-loading rate appropriate to the present tests, is of the order of 0.01–0.02 MJ/m3. For the biaxial conditions in the ice sheet, this value would be somewhat higher and the 0.05 figure is an upper value used for comparative purposes. In some areas of the literature, rather high specific crushing energies are proposed, of the order of 5–20 MPa. These values are not realistic for pulverization and are based on the fact that strength (MPa) and energy per unit volume (MJ/m3) have the same unit. In other cases, the energy of pulverization is based on dropped ball tests, with an arbitrary amount of energy of ejection (flow of pulverized ice) included. It is important in future research to separate the work and energy in terms of the actual process involved. In the present instance, the work in creating enough fracture surfaces to have pulverized ice, and the work in the frictional movement of the separate particles, especially when confined, need to be separated. More information on specific energies in the literature and their interpretation is given in Jordaan and McKenna (unpublished).
Cracks in compression can be associated with dissipation of quite large amounts of energy through frictional dissipation associated with relative movements of opposite crack faces with the frictional forces resisting movement. Also, the highly stressed zones near crack tips can dissipate energy in further distortion (even without extension). These modes are typical of strain-rates in the range 10−4 to 10−5 s−1. The material under consideration here is being stressed at a much higher rate; the power of dissipation in the modes just discussed would be far too small to make a contribution of any significance.
Let us now turn attention to the dissipation in the frictional clearing process. The power of dissipation per unit width is given by Equation (16) multiplied by the velocity. The result of this calculation, when multiplied by the crushed volume in our 0.05 s period of time gives the energy dissipated. Taking α = 2, μ = 0.1 MPa s, and v0= 0.06 m s−1 we find F T = F w = 3000 kN, quite close to the measured average. The energy dissipated in the 3 mm distance is 9.1 J.
The results are summarized in Table 1.
8. Discussion And Conclusions
A mechanism for the clearing of crushed ice by a viscous extrusion process has been presented. It is contended that this is the main process whereby energy is dissipated in indentation by flat indenters with ice crushing. Plausible results were obtained on the assumption of a Newtonian fluid and no slippage at the boundaries. An analysis has also been given of the variation of elastic strain energy stored in the ice and in the indenter; these quantities and associated movements were quite significant in the test series discussed. The interaction must then be analysed taking into account movements of the indenter and ice; it must be emphasized that elastic movements of the ice were much smaller than the layer thickness and may often be negligible. This may be true for field ice-structure interaction as well; more experience is needed to verify it as a general conclusion.
Energy corresponding to various processes for 3 mm movement of indenter

*Measured.
†Calculated, based on assumptions given in text.
The assumptions made regarding linear viscous flow, as well as the boundary conditions, need to be further investigated. The material could extrude as a “plug” and other material models (e.g. the Bingham body) may be more appropriate.
An attractive extension of the model presented here is one based on a thin layer (lubrication theory). This permits the variation of layer thickness and possibly a stochastic treatment. In the work by Reference Kheysin and LikhomanovKheisin and Likhomanov (1973) and by Reference Kurdyumov and KheysinKurdyumov and Kheisin (1976), a lubricating layer was used but not in the context of a dynamic variation. Indeed, peak pressures were deduced and the variation of force with layer thickness was not specifically addressed. It is contended in the present work that the peak load has more to do with the damage and pulverization process in the solid ice; the crushed layer transmits the load in a characteristic way but has nothing directly to do with the peak load itself, at least as a criterion for peak pressure.
Acknowledgements
This work is the result of collaboration between the National Research Council of Canada and Memorial University of Newfoundland. Financial support for this research from the Natural Sciences and Engineering Research Council of Canada and from Mobil Oil (Canada) Ltd is gratefully acknowledged.
Appendix
Elastic Solutions For Edge Deflection Of Semi-Infinite Plate
Referring to Figure 9, thefollowing linear elastic
Plan view of ice sheet in region of the indenter

solutions (Table II) can be derived for the deflection 6, of the edge of a semi-infinite plate of thickness hrelative to point P, based on plane-stress conditions (see Reference Timoshenko and GoodierTimoshenko and Goodier (1951) for basic formulation). The symbol Edenotes the elastic modulus, and υ is Poisson’s ratio.
The three equations for deflection (Table II) are quite similar; taking typical values of d = 10 m, r= 0.0635 m (width of indenter), ν = 0.33:
Cases A and B: 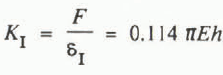 , Case C: K
I = 0.085 πEh

These values are reasonably close; because of the transfer of load from the indenter to the ice through a crushed layer, case C will be used. In other words, it is contended that a uniform pressure is closer to reality at the solid ice surface, rather than constant displacement given the presence of the crushed ice layer. If E = 10 GPa (near-instantaneous change in load), then

It is also interesting to compare this result with that obtained using the finite-element method (FEM) with fixed boundaries at the junction of the ice sheet and the test basin walls (Tomin and others, unpublished); the result obtained by FEM indicated a slightly higher stiffness but the results were within 20% of each other.



