Under what conditions do the policy positions of vote-maximizing political parties converge to that of the median voter, and under what conditions do they diverge from this position? This question has intrigued political scientists since Anthony Downs introduced his spatial model of party competition.Footnote 1 According to the standard Downsian model, if only two political parties exist and all voters vote and vote sincerely, these two parties will converge to the position of the median voter.Footnote 2 As Downs observes, entirely different results pertain when the number of parties exceeds two. In a multi-party context, he hypothesizes that parties will ‘try to remain as ideologically distinct from each other as possible.’Footnote 3
Using the Comparative Manifesto Project data for twenty established parliamentary democracies starting with the first election after the Second World War and ending with the last election in the 1990s, we study the relationship between number of parties in a party system and party dispersion.Footnote 4 We find that as the number of parties in the system increases so too does the dispersion of parties, but only up to a point. The boundaries of a finite policy space appear to expand up to five parties. Furthermore, once we control for the number of parties in the system, we find that electoral rules have no effect on party dispersion. Thus, our findings provide empirical validity to the basic theoretical predictions of spatial theory. At the same time, our empirical findings show us some of the ways in which the policy space is constrained, and so point the way to future research.
Predictions of spatial theory
A great deal of attention has been paid to Downs’s model of two-party systems and the effects of various factors on party positioning in one dimension, factors such as entry, location of third parties, activists and valence.Footnote 5 Less attention has been devoted to Downs’s discussion of convergence and divergence in multi-party systems, most likely because Downs’s discussion is incomplete and the mathematics of multi-party competition is complex. Formal scholars have studied how dispersion in multi-dimensional multi-party settings is affected by uncertainty, valence and voters’ behavioural characteristics.Footnote 6 Given the vast size of the spatial literature and the centrality of the theoretical distinction between two-party and multi-party competition, remarkably little theoretical work has addressed the direct impact of the number of political parties on the convergence or divergence of parties in the system.Footnote 7 Indeed, to the best of our knowledge, there are no studies that test empirically the direct effect of number of parties on dispersion, the primary focus of this article.
Gary Cox was the first theorist to explore formally the relationship between number of parties and dispersion.Footnote 8 He frames the question in terms of electoral rules, even though Downs suggests that electoral rules ought only to affect the dispersion of parties indirectly.Footnote 9 Cox analyses the relationship between electoral rules, number of candidates (or parties) and party positions in one dimension. While his model encompasses all possible permutations of electoral formula, ballot structure and district magnitude, Cox draws particular attention to dispersion in the two most common electoral systems (ones that Downs also mentions): the single member district plurality (SMDP) system and proportional representation (PR).
In discussing the implications of electoral rules on party positioning, Cox emphasizes the number of candidates (or parties). For example, his model predicts different party locations for a two-party SMDP system versus a multi-party SMDP system. Likewise, his model predicts different party locations for a multi-party proportional system versus a two-party proportional system. In fact, a careful examination of Theorems 1a, 1b and 4a, 4b reveals that the model predicts convergence (or ‘central clustering’) for two-party SMDP systems as well as two-party proportional systems.Footnote 10 This model also predicts dispersion for multi-party SMDP and multi-party proportional systems.Footnote 11 Thus, Cox shows that for the two most common electoral systems, it is the number of political parties, two or more than two, which determines whether or not parties will converge or disperse along the policy dimension. Despite his focus on electoral rules, his formal conclusions resonate with Downs’s insight: electoral rules affect party location only in so far as they affect the number of parties in the system. Further, in multi-party proportional systems in which voters cast only one vote, Cox’s model predicts that parties will be dispersed ‘fairly widely over the ideological spectrum’.Footnote 12
More recently, in two studies Samuel Merrill and James Adams and Anthony McGann tackle the relationship between the spatial location of parties and the number of parties in the party system.Footnote 13 Merrill and Adams derive results for a one-dimensional spatial model with probabilistic voting (as opposed to the deterministic model developed by Cox) in which voters have partisan biases. With these assumptions, they find that vote-maximizing parties take more extreme positions relative to the mean voter position as the number of competitors increases. McGann reports equilibrium results for a one-dimensional model in which parties locate at the median position of their supporters, and he finds that the distance between the left-most and right-most parties increases with the number of parties. Thus, Merrill and Adams as well as McGann generate complementary predictions that centrifugal incentives increase with the size of the candidate field.
If two-party systems create incentives for parties to locate near the centre of the policy space, and multi-party systems create incentives for parties to disperse in the policy space, then we should observe differences in the degree of dispersion across two-party and multi-party systems. Furthermore, the formal work reviewed above predicts that dispersion increases with the number of contenders.
Although the theoretical picture is relatively straightforward, it remains undocumented. Virtually no one has looked for empirical verification of the impact of number of parties on party position. Using data from four countries, Jay Dow examines the relationship between majoritarian versus proportional voting systems and party dispersion in a two-dimensional policy space and finds that parties are more dispersed in proportional than in majoritarian systems.Footnote 14 Given that proportional electoral rules typically lead to party systems with more than two parties, Dow’s findings provide indirect empirical support for the proposition that dispersion increases with the number of parties.Footnote 15 By contrast, Lawrence Ezrow explores the relationship between vote share and proximity to the centre of the voter distribution and finds that regardless of the number of parties in the party system, all parties increase their vote share the closer they locate to the median voter.Footnote 16 Ezrow’s finding implies that dispersion may not increase with the number of parties. Thus, if we look at the empirical evidence, we do not yet know how the number of parties in a party system affects party dispersion.
In this article, we investigate this empirical puzzle. Using competing measures and modes of analysis, we provide conclusive evidence that parties are more dispersed in multi-party systems than in two-party systems but that electoral rules affect party positioning only indirectly. Our analysis shows that dispersion increases with the number of parties but only up to five parties; parties in systems with five or more parties are similarly dispersed. While our findings confirm the basic predictions of formal theory, our empirical analysis presents a more complex picture. Our most important finding is that the dispersion of parties is limited. If the policy space is determined by the parties that occupy that space, our findings suggest that the policy space is not infinite; indeed, it is fairly severely constrained.
This article proceeds as follows. In the first half, we discuss the issues we confront in measuring our independent and dependent variables. We first discuss the two measures we use to determine the number of parties in a party system, our key explanatory variable. We then discuss in detail the procedure we followed to measure party dispersion. In the second half, we present our empirical findings, and we conclude with a discussion of the implications of these findings.
Definitional and measurement issues
Number of Parties in the Party System
Central to our inquiry is an understanding of what constitutes the party system. According to our understanding of the literature on parties and party systems, there is no definitive way to measure the number of parties in a party system; however, two approaches to this issue stand out. One, epitomized by the work of both Sartori and Strøm, considers all parties that have an impact on policy making to be part of the party system, whether or not they are members of the governing coalition.Footnote 17 Another, epitomized by the work of Laakso and Taagepera, weights parties by seat share, and so derives a measure of the size of the party system.Footnote 18 Each conceptualization has merit; thus, we measure our key explanatory variable, the number of parties in the party system, in two ways. We discuss each in turn.
Giovanni Sartori provides one of the earliest and most influential discussions of how to classify party systems.Footnote 19 According to Sartori, a party is part of a party system only if it is ‘relevant’ to policy making; that is, it must have the potential to be a member of a coalition government, or it must be able to affect the policy making of some plausible coalition(s) even if it is not a member of government – a so-called ‘blackmail party’. Sartori’s definition distinguishes the assortment of parties that may compete in a given country’s elections from the smaller subset of such parties that actually influence policy making. Kaare Strøm concurs with Sartori’s basic framework, but emphasizes the importance of small parties to policy making.Footnote 20 Indeed, in a country such as Sweden, where single-party minority governments have been the norm throughout the period following the Second World War, small parties are critical to the survival of the government as well as to policy making.
Ideally, in deciding which parties to consider as members of the party system, one would analyse each country year in detail, but that is not practicable. For the sake of consistency across all twenty country cases, we must devise a decision rule for inclusion. Although there is no agreed-upon definition of how to determine the number of parties in a party system, there clearly exists consensus in the literature that the number includes some subset of the parties in parliament.
Empirical as well as formal work on cabinet formation shows that the seat share and ideological position of all parties in parliament must be taken into account in order to understand the possible coalitions that may form.Footnote 21 For example, in their empirical investigation of cabinet formation, Martin and Stevenson consider ‘all the governments that formed as well as all the potential governments that could have formed in these democracies during the periods indicated .’Footnote 22 Likewise, in their recent book on legislative politics in multi-party parliamentary democracies, Schofield and Sened take into account all parliamentary parties (except the smallest, most short-lived parties) in their complex, multi-stage bargaining model.Footnote 23 The authors of these two influential studies make no distinction between parties in government or out of government when analysing formally which governments are more or less likely to form. Thus, the subset of electoral parties that has the potential to influence policy includes all but the smallest and most short-lived of the parties in parliament. Our first measure, therefore, is highly inclusive.
To be included in our measure, a party must have gained at least 1 per cent of the seats in parliament in at least two consecutive elections. If a party fails to gain 1 per cent of the seats in three subsequent (and consecutive) elections, we drop it from our measure. According to this criterion, the number of parties in a party system is assessed on an election by election basis, and it can, in theory, change with each election. Why do we adopt a 1 per cent threshold? The lower the threshold, the more parties will be counted. Upon inspection of the parties in each of our country cases, we found that a higher threshold (such as 5 per cent of the seats) eliminated certain parties that country specialists would be puzzled to see excluded, such as the National Front in France or the Liberal party in Britain. Furthermore, a threshold higher than 1 per cent eliminates many parties that gain representation in their respective parliaments over much of the period, such as Sweden’s Communist party, Norway’s Left Socialist party, Denmark’s Radical, Christian People’s and Justice parties, Italy’s Social Democrats and Republicans (both of which participated in government), and many others. Obviously no cut-off point is entirely satisfactory, but we have chosen to err on the side of inclusion. Because exclusion of relevant parties ought to bias our results towards finding less dispersion than actually exists and so could create an artificial upper boundary on the size of the issue space (our key finding), we believe that for purposes of our study, it is worse to exclude a clearly relevant party than it is to include a possibly irrelevant one.
Our first measure, the count of parties in the system, is an integer ranging from 2 to 13, with mean 5.4 (the average number of parties in the systems included in our dataset) and standard deviation 3.5. The median number of parties is 5. Distinguishing two-party systems from multi-party systems (three or more parties) is straightforward with this measure.
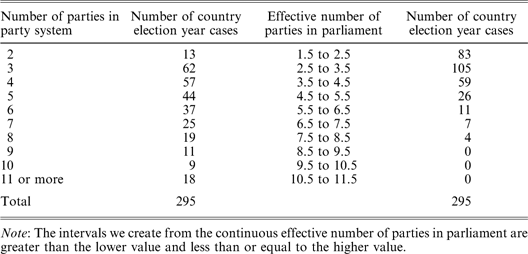
For our second measure, we use Laakso and Taagepera’s formula for the effective number of parties in parliament.Footnote 24 This measure weights parties according to their seat shares and so provides a consistent measure that captures an important aspect of the number of parties in the party system. We calculated the effective number of parties in parliament for each election in each country. This measure varies continuously from 1.5 to 8.4, with mean 3.4 and standard deviation 1.3. The median value is 3.1. Because the ‘effective number of parties’ measure is not an integer, we adapt it to fit our interest in two-party and multi-party systems. Hence, we characterize all systems with an effective number of parties in parliament between 1.5 and 2.5 as being two-party systems, and all others as multi-party systems. For the purpose of direct comparison to the count of parties in the system, we divided the measure of effective number of parties into distinct increments that range over 1.5 – 2.5, 2.5 – 3.5, 3.5 – 4.5, and so on.Footnote 25
Although these two measures are highly correlated (the correlation coefficient is 0.84), the first measure generally categorizes more parties as being in the system than does the second. In Table 1, we compare party systems across each of our two measures. Note that each observation in the table corresponds to a country election. A comparison of the two measures shows that our method of counting parties in the system categorizes fewer systems as having only two parties and more systems as having a high number of parties (five or more) than does the effective number of parties measure, which categorizes most systems as being two-party and three-party systems.
Party Systems by Number of Parties

Note: The intervals we create from the continuous effective number of parties in parliament are greater than the lower value and less than or equal to the higher value.
The Dimensionality of the Policy Space
When examining the location of parties in a policy space, we employ a two-dimensional policy space and so distinguish ourselves from most of the empirical studies that look only at one dimension. Schofield, in particular, argues that a two-dimensional policy space is a more realistic and appropriate conceptualization for multi-party contests than is a one-dimensional framework, especially given that spatial theorists have now developed equilibrium predictions for models in two or more dimensions.Footnote 26 Most recently, Benoit and Laver argue that international comparisons of the kind we make in this article require more than a single left–right dimension.Footnote 27 As they observe, it is not that the left–right dimension lacks validity in any given country, it is simply that the way in which multiple dimensions map onto the single dimension varies greatly from country to country. By using two distinct dimensions in our analysis, we capture the international variation in the policy positions of parties better. Just as Benoit and Laver suggest, we find a great deal of variation between the two-dimensional representations from country to country – variation that would be obscured if we used only a one-dimensional space.
In a survey of country experts (from a set of country cases similar to our own) designed both to uncover essential policy dimensions as well as to locate parties along those dimensions, Laver and Hunt conclude that ‘two particular dimensions . . . tended to be among the most salient in most countries’. These were the ‘tax cuts versus public spending’ dimension and the ‘social policy’ dimension.Footnote 28 Party system expert Adam Ware also focuses on an economic policy and a social policy dimension. In Budge et al., the only dimensions discussed are economic and social.Footnote 29 We also characterize party systems in terms of economic and social policy dimensions.
Benoit and Laver extend the earlier expert study by Laver and Hunt and examine the relevance of many dimensions, including those of economic and social policy. For example, they consider the correlation between these two dimensions across their country cases, and they find that while the two dimensions are highly correlated in some countries (thus obviating the need for two dimensions in those cases), they are not highly correlated in others. These empirical findings lead Benoit and Laver to conclude that, although a single dimension may capture political reality in some countries, it fails to do so in others, and the policy content of that single dimension also varies from country to country. They therefore recommend that international empirical investigations of party positions should employ more than one left–right dimension. They also suggest that, where possible, researchers ought to investigate relationships involving estimated policy positions country by country, the better to capture the specific dimensional characteristics of the policy space. We take all of these suggestions seriously; however, for the purposes of this study we are able to follow some of Benoit and Laver’s guidelines, but not all.Footnote 30
We include twenty country cases in our analysis, all of which are parliamentary democracies: Australia, Austria, Belgium, Canada, Denmark, France, Germany, Greece, Iceland, Ireland, Italy, Luxembourg, Netherlands, Norway, New Zealand, Portugal, Spain, Sweden, Switzerland and the United Kingdom. We pool data from these country cases, creating a measure of party dispersion based on a common policy space and a common metric. We do so because no single country case provides sufficient variation on either our dependent or independent variables. In the first place, variation on number of parties in the party system is limited within a single country. Although the number of parties in the party system varies over time in each country, in general countries with fewer parties, such as New Zealand, always have fewer parties (the range is two to five), and countries with more parties, such as Denmark, always have more parties (the range is five to eleven).Footnote 31 Thus, no country represents the full range of possibilities for number of parties in parliament. Secondly, variation on type of party is quite limited in many of the cases. For example, throughout most of the period Denmark’s party system includes one party from each of eight distinct party families whereas Great Britain’s party system includes one party from each of only three party families.Footnote 32 Thirdly, the number of elections held in any one country is limited. Although we include data for the entire period following the Second World War, most countries held between fifteen and twenty elections, with Denmark and Australia holding twenty-two, and Greece, Spain and Portugal holding nine or fewer. Finally and not surprisingly, countries with fewer parties tend to have single member district electoral systems, and countries with more parties tend to have permissive forms of proportional representation. Because electoral rules do not vary much over time, it is impossible to study the effect of number of parties on dispersion, controlling for electoral rules, within a single country case. For these reasons, analysing dispersion within each country separately is not possible.
For data on the policy positions of parties we employ the Comparative Manifesto Project (CMP), which provides comprehensive information on the content of party manifestos for over twenty country cases for the entire period following the Second World War. CMP coders applied a consistent coding methodology across country cases and over the time period so that it is possible to compare the content of party manifestos across time and space. Recently, project leaders have invested enormous time into improving inter-coder reliability and the consistency of the data as a whole.Footnote 33
In our use of the CMP data, we use a distinct subset of the CMP issue categories to create each dimension. Further, the same set of categories is applied to each country case at each point in time. Differences in the policy content for each dimension across our country cases are thus minimized. All our analyses are based on party locations along a primary dimension that corresponds to economic policy and a secondary dimension that corresponds to social policy. We discuss the details of this process in the next section.
Identifying the Policy Positions of Parties
There is considerable debate about the appropriate use of the Manifesto data. The CMP data were designed to register differences in the saliency of various policies; they were not originally conceived as a way to measure policy position. However, many scholars have used these data to estimate the policy positions of political parties.Footnote 34 In the book that accompanies the latest version of the CMP data, Ian Budge and his coauthors spend considerable energy demonstrating that estimates of policy positions based on the CMP data are reliable and highly correlated with other measures of policy positions, including expert opinions as well as different measures constructed from the CMP data.Footnote 35 Many other studies using CMP data demonstrate that positional predictions from the data are highly correlated with all other measures and are intuitively reasonable. No other data on party policy positions have been as widely used, as widely tested, or as thoroughly validated.Footnote 36
Our numerical estimates of party positions along each of our two dimensions correspond to the scores of the first component of a principal components analysis on each set of coding categories for the twenty countries included in our study.Footnote 37 The end result of our analysis is an estimated policy position on the economic and social dimensions for each party in each election year from 1945 to 1999.
There is considerable agreement among scholars who have used the CMP data on the categories to include in an economic dimension. Our economic policy dimension is correlated at the level of 0.96 with that derived by Laver and Garry, and our selected categories correspond closely to categories chosen by Bartolini and Mair.Footnote 38 Thus, the validity of our measure of the economic dimension should be comparable to that of the Bartolini and Mair estimates discussed in Budge et al.Footnote 39
There is much less agreement on how to create a specifically social dimension using the CMP data. Following the recommendations of Laver and Garry, we chose coding categories in an effort to construct as positional a measure as possible.39 For example, four of the nine categories specifically measure a positive or negative stand on an issue (for example, positive national way of life versus negative national way of life). In addition, few liberal or leftist parties emphasize a position in favour of law and order; and few conservative or rightist parties emphasize social justice. Thus, these additional two categories seem to have a strong positional component. Three additional categories of environmental protection, culture and social harmony are also associated, to a greater or lesser degree, with specific parties (environmental protection with more leftist parties, culture and social harmony with more rightist parties), and so we incorporated them into our measure. Our estimates of social policy positions should reflect the positional implications of the included categories; however, care should be used in interpreting the meaning of this dimension.
By using principal components analysis on the combined data from these twenty country cases, we construct a policy space that corresponds in its scope to the entire policy space captured in the platforms of all parties across all countries for our two dimensions. By differentiating policy (as well as the policy space) into two discrete dimensions, we can more legitimately compare the parties’ policy positions across countries and years than if we had used a single ‘left–right’ dimension created from all possible issues, the so-called ‘vanilla’ approach.Footnote 40 While appropriate for many studies, such an approach is not appropriate for studying dispersion. We are interested in substantive and sustained dispersion, and so do not want to allow minor or short-lived issues, on which some party may take a temporarily extreme position, to bias our results.
How to Conceptualize Party Dispersion
What does it mean for parties to be dispersed in the policy space? Consider the logic of the spatial model. In the words of Downs, a party’s location ‘is as dependent upon where other parties are as it is upon where the voters are’.Footnote 41 He predicts that in multiparty systems, ‘parties will strive to distinguish themselves ideologically from each other’, giving voters ‘a wide range of ideological choice’.Footnote 42 In Downs’s view, parties in multi-party systems will be dispersed fairly evenly throughout the policy space, giving voters choices among centrist and increasingly more extreme alternatives. Cox also presents a Downsian view by tying the issue of party dispersion to the strategic behaviour of vote-maximizing parties as they search out locations where other parties are not. Elaborating his definition of convergence versus dispersion, Cox writes that ‘the particular feature of equilibrium configurations to be studied here is the degree to which competitors are either bunched together at the center of the ideological spectrum, revealing the dominance of centripetal forces, or dispersed across it, revealing the importance of centrifugal forces.’Footnote 43
To illustrate party dispersion, we draw from four countries included in our study, New Zealand, a system with relatively few parties, Iceland and Sweden, systems with relatively many parties, and Germany, an intermediate system. According to our count measure, the number of parties in New Zealand’s party system ranges from two to five whereas the number ranges from four to seven in Iceland’s party system and five to eight in Sweden’s party system. The number of parties in the German system ranges from three to seven.
In Figure 1, we use the results of our principal components analysis to locate members of six distinct party systems, ranging from New Zealand’s 1975 two-party system to Sweden’s 1988 six-party system, in the two-dimensional space created by economic and social policy. The images of each party system represent typical maps of party dispersion for a system of that size. Notice that although parties are certainly widely dispersed in six-party systems, they are no more dispersed than are parties in Iceland’s 1991 five-party system. Notice also that it is possible for parties to be more dispersed along one dimension than along the other. We find that, in general, the distance between extreme parties is greater along the economic policy dimension than along the social policy dimension.
Party dispersion and number of parties Note: Each image shows the location of parties as estimated by the principal components technique described in the text.

To measure party dispersion, we calculate the distance between the policy positions of the two most extreme parties in the party system along both the economic and social policy dimensions, which results in a measure of dispersion for economic and social policy. We record dispersion for each party system depicted in Figure 1. The units of dispersion are determined by the principal components analysis and are comparable across party systems.Footnote 44
Because we determine the number of parties in the party system in two ways, the identity of the most extreme parties may differ according to which measure we use. For example, according to our count of parties, Sweden had six parties in its party system in 1988. However, the effective number of parties in parliament was only 3.67, a substantial difference. For obvious reasons, a measure that includes all parties that routinely obtain over 1 per cent of the seats will include more parties on average than a measure that weights parties based on seat share. To determine the two most extreme parties as identified by our effective number of parties measure, we first use this measure to identify parties in the party system. Using the cut-off values discussed earlier in the article (1.5–2.5 equates to a two-party system, 2.5–3.5 equates to a three-party system, and so on), we categorized Sweden in 1988 as having a four-party system, and so we identify the four largest parties in that system according to seat share (seat shares can be found in parentheses next to party names in each image depicted in Figure 1). We then measure the distance between the two most extreme parties along each dimension, in this case the Conservatives and Social Democrats along both the economic and social dimensions. Among the five party systems depicted in Figure 1, only in New Zealand 1975 will our measure of dispersion be the same whether we count parties or determine the number of parties in the system based on the effective number of parties.
Dispersion in systems classified by the effective number of parties can be the same but never greater than dispersion in systems classified by our count measure. For party systems classified by our count measure, dispersion along the economic dimension ranges from 0.125 to 11.475, with mean 3.1, and along the social dimension from 0.05 to 7.625, with mean 1.4. For party systems classified by the effective number of parties measure, dispersion along the economic dimension ranges from 0.025 to 8.3, with mean 2.45, and along the social dimension from 0.025 to 6.25, with mean 1.45. The correlation between these two measures of dispersion is 0.71 on the economic dimension and 0.8 on the social dimension.
Given the differences in our two measures, it is surprising and important that whichever of the two rules we use to characterize the size of the party system, our findings are identical.
Results of empirical analysis
We seek to gauge whether parties are more dispersed in multi-party than in two-party systems. Further, do centrifugal incentives increase with the number of parties in the system? Then we look for a relationship between the restrictiveness of the electoral system (whether it is a single member district system or a proportional system) and party dispersion. Finally, we compare the relationship between number of parties in the party system and two measures of dispersion, overall expanse of the policy space and distance from the centre.
Difference of Means
We begin with a simple comparison of mean party dispersion in two-party versus multi-party systems. In addition, we compare mean party dispersion in single member district electoral systems versus proportional electoral systems (Table 2).
Comparison of Mean Distances between Extreme Parties in Two-Party v. Multi-Party Systems and Single Member District Systems v. Proportional Systems

Note: We classify Australia, Canada, France (except for 1986), Great Britain and New Zealand (until 1996) as single member district systems, recognizing that France is a single member district two ballot system, while the others are ‘first past the post’ systems.
We find consistent evidence that party dispersion is greater in multi-party than in two-party systems. Using a two-sample t test and assuming unequal variance across the samples included in each of our categories of comparison, we find that the difference in means for two-party and multi-party systems is highly statistically significant for each method of classifying the number of parties in the party system, along both the economic and social policy dimensions. As can be seen from the comparison of means in party systems classified according to our 1 per cent seat share criterion, there are few party systems in which only two parties gain essentially all of the parliamentary seats. However, once we weight parties by seat share, the sample of two-party systems increases. The differences in means for two-party and multi-party systems as classified by the effective number of parties measure is also highly significant and confirms the robustness of our findings.
Simple comparisons of mean dispersion in single member district systems and proportional systems presents mixed evidence that party dispersion is greater in proportional than in single member district systems. For systems classified by a count of parties, our first measure, we find that mean dispersion is greater in proportional than in single member systems along either dimension. However, for systems classified by effective number of parties, we find no difference in the mean dispersion of parties along the economic dimension, although the mean distance between extreme parties along the social dimension is highly significant. Based on this simple comparison of means, we cannot dismiss the possibility that parties are more highly dispersed in proportional than in single member district systems. However, as we show in the next section, once we control for number of parties, the direct effect of electoral rules on dispersion disappears.
Although the significance of the differences in means for two-party versus multi-party systems is consistent with Downs’s original ideas about the relationship between number of parties and party dispersion, a simple comparison of two-party and multi-party systems does not truly test Cox’s more precise formulation. Hence, in Table 3 we present differences in mean distances between parties for systems with increasing numbers of political parties (according to our first measure) and increasing numbers of effective parties in parliament.
Comparison of Mean Distances between Extreme Parties as the Count of Parties in the System Increases and as the Effective Number of Parties in the System Increases

Note: We report the actual difference and estimated t-statistic of the relevant differences in means.
As predicted by Cox, the mean dispersion of parties in a party system increases as the number of parties in the system increases, and this is true for both economic and social policy dimensions and for both methods of measuring number of parties in the system. However, using the same difference in means test discussed above, we find important differences in the magnitude and statistical significance of these differences depending on the dimension under analysis (economic versus social) and on the measure of number of parties in the party system.
Using our first measure, a count of parties in the system, we find that the mean dispersion of parties increases as the number of parties in the system increases, but only up to five parties. From Table 3 we see that mean dispersion along the economic dimension is 1.72 in two-party systems, increases to 2.19 in three-party systems and 2.78 in four-party systems, and levels off at 3.92 in five-party systems. Dispersion is about the same or less, on average, in party systems with six or more parties. An examination of columns two and three in Table 3 shows that dispersion is greater on average along the economic dimension than along the social dimension; however, we see the same pattern of steadily increasing dispersion up to five parties. Mean dispersion is 0.58 in two-party systems, increases to 1.41 in three-party systems and 1.81 in four-party systems, and levels off at 2.26 in five-party systems. Along with the raw values, we also report tests for the significance of the differences in mean dispersion between two-party and three-party systems, three-party and four-party systems, four-party and five-party systems, five-party and six-party systems and so on. We report the difference and t statistic for each pair. Not surprisingly, we find a significant difference in mean dispersion between two-party and three-party systems, three-party and four-party systems, and four-party and five-party systems. However, differences between systems with six or more parties are not significant.
Using the effective number of parties as a measure of number of parties in the party system, we find that mean dispersion increases along the economic dimension from 1.67 in two-party systems to 2.49 in three-party systems to 2.74 in four-party systems and levels off to 3.49 in systems with five or more parties. Along the economic dimension, differences in mean dispersion between two-party and three-party systems and four-party and five-party systems are statistically significant. Oddly, the difference in mean dispersion between systems with three versus four parties is not significant. However, as with our count measure, we find that mean dispersion does not increase in systems with over five parties. The magnitude of mean party dispersion in systems with more than five parties, regardless of the method of classification, is the same as it is in five-party systems, indicating that the policy space expands only up to five parties. Along the social dimension, although dispersion increases with the number of parties, only the difference between two-party and three-party systems is statistically significant.
We conclude, therefore, that there is an increasing and significant difference in the dispersion of parties along both the economic and social dimensions in systems with up to five parties; however, there is no statistically significant difference between mean distances along either dimension for party systems with more than five parties. Because the economic dimension of competition is the most important in most of the countries and years in our study, it is not surprising that differences in dispersion are more sharply defined along this dimension than along the social policy dimension. It is important to note, however, that the patterns we observe are consistent along both dimensions.
Regression Analysis
Having found strong evidence that party dispersion increases as the number of parties increases, we use regression analysis to ascertain the respective contribution of number of parties versus electoral rules. Our two variables of interest – dispersion and number of parties in the party system – are both skewed. Therefore, we take the natural log of each variable and use these transformed variables in our regression analysis.
For each policy dimension, we report two regressions, one for each of our methods of classifying party systems. Because past dispersion is likely to affect current dispersion, we include the lagged dependent variable in each regression. In addition, to account for country-specific variance, we cluster our observations by country, as suggested by Beck and Katz.Footnote 45 In Models 1 (a & b) and 2 (a & b), we evaluate the effect of number of parties in the system, as measured by count of parties and by effective number of parties, and electoral rules, as measured by a dummy variable coded 1 if the country has a single member district electoral system, on dispersion. Our results are straightforward. We find that regardless of how we classify party systems, as the number of parties in the system increases, party dispersion increases and the effect is statistically significant for both policy dimensions. However, type of electoral system, single member district versus proportional, has no independent effect on dispersion along either policy dimension.
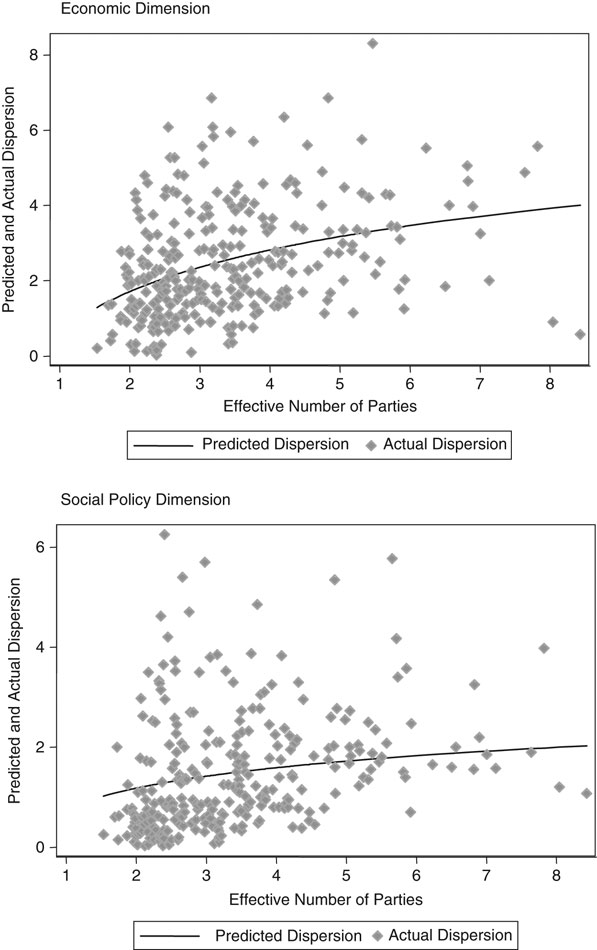
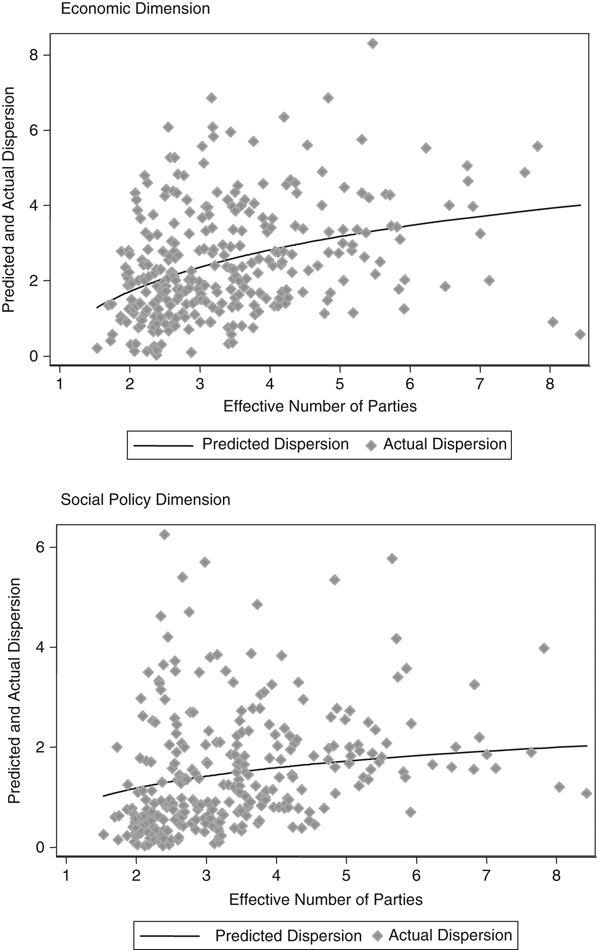
To see the relationship between number of parties and dispersion, in Figure 2 we plot the predicted and actual values of dispersion as effective number of parties increases for both economic and social policy. Notice that the predicted values of dispersion begin to level off when the effective number of parties reaches five.
Predicted values of dispersion increase as effective number of parties increases; actual values of dispersion are also shown
To check the robustness of our conclusions regarding the insignificant effect of electoral rules on dispersion, we also ran the analysis using median district magnitude.Footnote 46 The results are equivalent to those reported in Table 4; the effect of number of parties in the system on dispersion remains significant with comparable coefficient estimates, whereas electoral rules, as measured by district magnitude, have no significant effect on dispersion.
OLS Regression of (Natural Log of) Number of Parties in Party System v. Electoral Rules on (Natural Log of) Distance between Extreme Parties (Dispersion) along Economic and Social Policy Dimensions

Note: Robust standard errors, clustered by country, reported in parentheses.
* Coefficients that fall within a 95% confidence interval.
Conclusion
In this article, we provide strong evidence that the number of parties in a system affects the location of those parties, whereas electoral rules do so only indirectly, that is, only in so far as they affect the size of the party system. First of all, our analysis shows that parties in multi-party systems are more dispersed than parties in two-party systems and dispersion increases as the number of parties increases. Our evidence suggests that the scope of the policy alternatives is greater in multi-party systems than in two-party systems. This finding has important implications for politics in two-party versus multi-party systems. It confirms the accepted wisdom that voters in multi-party systems have not only more choices (more parties) but a greater range of policy alternatives than do voters in two-party systems.
However, it is important to note that, according to the mean dispersion of parties reported in Table 3, parties in two-party systems are dispersed and that the dispersion is large. Average mean dispersion of parties in two-party systems as categorized by the effective number of parties measure is 1.65. Even in the very few systems in which only two parties gain over 1 per cent of the seats, mean dispersion is 1.71. While the distance between extreme parties increases as the number of parties increases, the average distance between all of the parties in the party system is greater in two-party systems than in multi-party systems. We join most other empirical studies in concluding that even in two-party systems, parties do not converge on the centre of the policy space.
Our work does more than confirm the received wisdom, demonstrating the value of empirically investigating the implications of formal theory. The spatial predictions from Cox’s model (along with work by Merrill and Adams and that by McGann) suggest that the policy space expands indefinitely to include additional parties. However, we find evidence that the dispersion of parties increases only up to a point, at most until the number of parties reaches five. The policy space appears to be bounded, and this is true for positions along both economic and social policy dimensions. This finding holds whether we include almost every party in parliament in our count of parties or whether we use the effective number of parties in parliament to determine the number of parties in the party system, which suggests that in any given party system there is a core of parties that defines the policy space. In our sample of country cases, all of which are established parliamentary democracies, the number of core parties that defines the policy space includes no more than five parties. It would seem that not only do additional parties not add to the scope of choices available to voters, each additional party over five has a harder time establishing a distinctive ideology within the policy space.
Our findings provide strong empirical evidence that parties are concerned with differentiating themselves from contiguous parties, just as Downs and Cox theorized. Even in the two-party systems included in our data, there is a substantial distance between the parties. Thus, we believe that our results underscore an understanding of party systems in which the ideological location and mobility of parties is not only dependent on the location of the voters but also on the number and location of competing parties. In other words, as the number of parties increases, the ideological space between proximate parties diminishes.
The findings reported in this article lead us to ask: why is the policy space bounded? One possibility is that the parties themselves are limited in where they can locate by the need to differentiate themselves sufficiently from competing parties. In addition, when it comes to the economic dimension of competition, it may simply be that there are only so many variations on economic policy in our intellectual lexicon. We think that this is, indeed, part of the story. Another possibility is, of course, that the policy preferences of voters limit just how extreme parties can become. If many voters are moderate and few are extreme, extreme parties will rarely be successful, and so dispersion will be limited. To the extent that parties reflect the preferences of voters in their policy choices, we can say that voters limit the policy space. But, to the extent that parties shape voter preferences, it is the parties themselves that may be the limiting factor. In future work, we plan to investigate the reciprocal relationship between dispersion of voter preferences and party platforms.