





Introduction
Italian ryegrass is a vigorous, highly prolific cool-season grass that is generally managed as an annual or winter annual weed in Pacific Northwest cropping systems; however, its life cycle can vary with genotype and environment, and plants may persist as biennials or short-lived perennials under favorable conditions (Beckie and Jasieniuk Reference Beckie and Jasieniuk2021; Beddows Reference Beddows1973). Its widespread occurrence is supported by a protracted germination period, high fecundity, obligate outcrossing, and high genetic diversity, characteristics that facilitate rapid evolution of adaptive traits, such as herbicide resistance (Matzrafi et al. Reference Matzrafi, Preston and Brunharo2021). In 2026, 78 unique cases of Italian ryegrass resistance to herbicides representing nine distinct modes of action, had been reported worldwide. These cases include resistance to inhibitors of acetyl-CoA carboxylase, acetolactate synthase, photosynthesis at photosystem II, 5-enolpyruvylshikimate-3-phosphate synthase, glutamine synthetase, protoporphyrinogen oxidase, very-long-chain fatty acid synthesis, and lycopene cyclase, as well as electron diversion at photosystem I (Heap Reference Heap2026). In the Pacific Northwest of the United States, particularly in Oregon’s Willamette Valley, Italian ryegrass is a dominant weed in cereal grains, grass seed crops, and perennial horticultural systems, such as hazelnuts. The region’s mild, wet winters and moderate summer temperatures favor prolonged germination and establishment, while extended soil moisture availability and limited soil disturbance in orchards promote persistence of dense populations. Cases of resistance to these modes of action, including multiple resistance, are widespread, limiting effective chemical control options and increasing management complexity (Bobadilla et al. Reference Bobadilla, Hulting, Berry, Moretti and Mallory-Smith2021; Moretti Reference Moretti2021). Herbicide mixtures of postemergence and preemergence herbicides are often the only management options available to farmers (Moretti Reference Moretti2021), but use of herbicides may affect grower profitability and increase the environmental impact of cropping systems. The continued spread and evolution of herbicide resistance of Italian ryegrass reinforce the need to integrate nonchemical methods into resistance management programs.
Nonchemical management options for Italian ryegrass have been widely explored in annual cropping systems, including crop rotation, increased seeding density, tillage, cover cropping, and harvest weed seed control (de Sanctis et al. Reference de Sanctis, Cahoon, Everman, Gannon, Jennings, Taylor, Dean, Forehand and Lee2025; Lyon et al. Reference Lyon, Huggins and Spring2016; Maity et al. Reference Maity, Singh, Jessup and Bagavathiannan2021; Sønderskov et al. Reference Sønderskov, Somerville, Lacoste, Jensen and Holst2020), with effective results when integrated with chemical controls. In orchard systems, however, nonchemical options are more limited. Tillage is not suitable in conventional hazelnut orchards because it can degrade soil health (Granatstein and Sáchez Reference Granatstein and Sáchez2009), damage root tissues, and increase suckering. Mowing can suppress Italian ryegrass growth and seed production, but it requires repeated operations and does not provide adequate stand-alone control, thereby increasing labor requirements and production costs (Donald Reference Donald, Singh, Batish and Kohli2006; Ollerenshaw and Hodgson Reference Ollerenshaw and Hodgson1977). Similarly, a study comparing cover crops combined with either mowing or herbicides for hazelnut orchard-floor management concluded that mowing alone was insufficient to adequately control the weed population (Mennan et al. Reference Mennan, Ngouajio, Isık and Kaya2006). Therefore, additional nonchemical weed control tools are needed to reduce herbicide reliance and support management of herbicide-resistant Italian ryegrass in orchard systems. Electrical weed control (EWC) is a nonchemical option that may be suitable for orchard crop production.
EWC applies high-voltage current to the aboveground plant tissues. The energy is transmitted through the plant toward the root system. As electrical current moves through plant tissues, electrical resistance generates heat, damaging membranes and desiccating tissues, leading to plant death (Bauer et al. Reference Bauer, Marx, Bauer, Flury, Ripken and Streit2020; Mizuno et al. Reference Mizuno, Tenma and Yamano1990). Mizuno et al. (Reference Mizuno, Tenma and Yamano1990) observed damage to stem and root cells after electrical exposure, describing the destructive effect as a thermal expansion of intracellular fluids into vapor, leading to the rupture of cell walls and membranes. Once these structural components are compromised, the vascular system collapses, disrupting water and nutrient transport, halting further current transmission, and effectively terminating the weed’s ability to recover. Commercial EWC systems use alternating current (AC) or direct current (DC), and a wide range of energy outputs (Slaven and Borger Reference Slaven and Borger2022).
Efficacy of EWC is strongly influenced by the interaction among applied voltage, exposure time (i.e., contact duration), and electrode configuration (Bauer et al. Reference Bauer, Marx, Bauer, Flury, Ripken and Streit2020; Vigneault and Benoît Reference Vigneault, Benoît, Vicent, Panneton and Fleurat-Lessard2001). Greater voltage can increase the electric field strength and current flow through plant tissues, resulting in greater energy dissipation and more extensive cellular injury (Mizuno et al. Reference Mizuno, Tenma and Yamano1990). However, the total energy delivered to the plant is also a function of exposure time, which is inversely related to travel speed; slower operation speeds increase contact time between the electrode and plant canopy, allowing greater energy transfer and typically improving control. Plant and soil water status may also influence EWC efficacy because current flow through plant tissues and the soil-return pathway depends on electrical conductivity. Greater plant water content may facilitate current movement through stems, leaves, and basal tissues, whereas drier tissues may increase resistance and reduce injury (Vigneault and Benoît Reference Vigneault, Benoît, Vicent, Panneton and Fleurat-Lessard2001). Soil moisture can similarly affect grounding, system load, and electrical circuit continuity. Electrode contact position and configuration further determine the current pathway through the plant. Greater contact with aboveground biomass promotes current movement toward basal meristems and root tissues, making it more likely to achieve complete plant kill, whereas insufficient contact or partial current pathways may result in only localized injury and subsequent regrowth. Optimization of voltage, travel speed, and electrode configuration is therefore important for improving EWC efficacy.
Few studies have evaluated using EWC for Italian ryegrass control. Container-grown seedlings of Italian ryegrass experience up to 75% mortality when treated with 5 or 7 J plant−1 and when EWC was applied with a tabletop DC system (Bloomer et al. Reference Bloomer, Harrington, Ghanizadeh and James2024). Similar efficacy (85%) was reported with rigid ryegrass (Lolium rigidum Gaudin) exposed to 9 J plant−1 (Lati et al. Reference Lati, Rosenfeld, David and Bechar2021). In field testing, EWC was shown to reduce seed germination of giant foxtail (Setaria faberi Hermm.) by 54% compared to a nontreated control using a tractor-mounted AC system on a soybean [Glycine max (L.) Merr.] crop (Schreier et al. Reference Schreier, Bish and Bradley2022). No published studies have evaluated EWC use in orchard settings as a way to control Italian ryegrass. Therefore, the objective of this study was to characterize the effects of EWC operating parameters, including energy rate, voltage, and electrode contact position, on Italian ryegrass control, biomass, and seed production.
Materials and Methods
Electrical Weed Control Equipment
EWC was applied using a tractor-mounted EH-30 Thor system (Zasso, Zug, Switzerland) powered by a 77-kW tractor (5100GN; John Deere, Moline, IL) via the power take-off (Figure 1). The unit included a 30-kW generator producing AC, coupled to a three-phase step-up transformer. Output voltage was adjusted using the transformer voltage selector settings to obtain the target voltage treatment while maintaining stable operation under field conditions. These settings were adjusted when necessary because soil moisture, weed biomass, and electrode contact with the plant canopy and soil surface affected system load (Baccin and Moretti Reference Baccin and Moretti2026). Energy delivered per unit area was determined by generator power, travel speed, treatment width, and a manufacturer-supplied correction factor used to account for energy losses in the AC system. High-voltage current was delivered to two front-mounted applicators, with each applicator consisting of two parallel rows of metal electrodes (0.6 m each; total width of 1.2 m). Electrical current passed through plant tissue and soil as the circuit closed between electrode rows.
Electrical weed control with the Thor EH30 system (Zasso, Zug, Switzerland) showing that applicators are placed on the soil surface, ensuring good contact with the weed foliage (A). As the electrical current flows to the weed foliage, plants are heated, as indicated in the thermal image (B). Plant wilting begins immediately after application, and necrosis becomes apparent within days (C). Plant death is pronounced around 5 to 7 d after treatment (D).

Nominal energy delivered per unit area was calculated from generator power, travel speed, treated width, and a manufacturer-supplied correction factor of 0.6 for the AC system. The correction factor accounted for losses associated with reactive power and electrical transmission. Nominal energy delivered per unit area was determined by travel speed and calculated using Equation 1:
 $${\rm{E}}\left( {{\rm{kJ\;}}{{\rm{m}}^{{\rm{ - 2}}}}} \right){\rm{\; = \;power\;}}\left( {{{{\rm{kJ}}}}\over{{\rm{s}}}} \right){\rm{ \times \;PF\; \times \;}}{{{\rm{1}}}\over{{{\rm{speed\;(}}}{{{\rm{m}}}\over{{\rm{s}}}}{\rm{)}}}}{\rm{\; \times }}{{{\rm{1}}}\over{{{\rm{width\;(m)}}}}}$$
where E is nominal energy (in kilojoules per square meter, kJ m−2), power is the generator output (in kilojoules per second, kJ s−1), PF is the manufacturer-supplied power factor (0.6), speed is travel speed (in meters per second, m s−1), and width is the treated width (in meters, m).
Site Description and Experimental Conditions
Three field studies were conducted to evaluate Italian ryegrass response to EWC in Oregon’s Willamette Valley (Table 1) between April and June of 2021 and 2022. Experimental sites were selected based on high infestations of Italian ryegrass (>10 plants m−2) at the time of the experiment. Studies 1 and 2 were conducted in commercial hazelnut orchards, whereas Study 3 was conducted at the Oregon State University Lewis Brown Research Farm. All studies used the same treatment structure and evaluation protocols to characterize the response of Italian ryegrass to electrical weed control under representative field conditions.
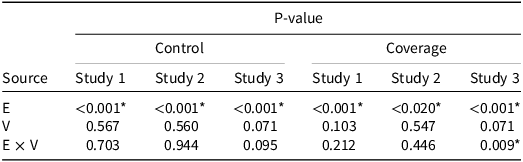
Summary of analysis of variance for control and coverage of voltage and energy studies at 42 d after treatment, in Studies 1, 2, and 3.a–c

Table 1. Long description
A table comparing P-values for control and coverage in three studies. The table has 4 rows and 8 columns. The columns are labeled Source, P-value, Control Study 1, Control Study 2, Control Study 3, Coverage Study 1, Coverage Study 2, and Coverage Study 3. The rows are labeled E, V, and E x V. Row 1: E, <0.001*, <0.001*, <0.001*, <0.001*, <0.020*, <0.001*. Row 2: V, 0.567, 0.560, 0.071, 0.103, 0.547, 0.071. Row 3: E x V, 0.703, 0.944, 0.095, 0.212, 0.446, 0.009*.
a Abbreviations: E, energy; V, voltage; E × V, interaction of energy and voltage.
b Studies were carried out at three locations in Oregon in 2021 and 2022: in Canby (Study 1), Salem (Study 2), and Corvallis (Study 3). All study sites had naturally occurring Italian ryegrass infestations exceeding 10 plants m−2 at the time of treatment. Growth stage was recorded as a descriptive characteristic of the infestations: Study 1 (stages 22–25 on the BBCH scale) and Study 2 (stages 30–32 on the BBCH scale) were conducted in commercial hazelnut orchards, whereas Study 3 (stages 51–53 on the BBCH scale) was conducted at the Oregon State University Lewis Brown Research Farm.
c An asterisk (*) indicates significance at P < 0.05.
Effect of Voltage and Energy
Plants received a single EWC application. Energy rates differed among studies because generator output and operable voltage settings varied with field conditions. The experimental design included energy rates of 0, 8.4, 16.9, 33.8, 67.5, and 168.8 kJ m−2, generated by varying tractor speed from 6.4 to 0.32 km h−1. The 0 kJ m−2 treatment represented the nontreated control, and the nonzero energy rates corresponded to travel speeds of 6.4, 3.2, 1.6, 0.8, and 0.32 km h−1, respectively. Study 1 included energy rates up to 67.5 kJ m−2, whereas Studies 2 and 3 included the additional 168.8 kJ m−2 rate. EWC was performed at two voltage ranges, high voltage (5.0 to 7.6 kV) or low voltage (3.9 to 4.5 kV). Voltage-selector settings were adjusted during operation based on generator readings and system stability. The target operating conditions were to maintain the generator voltage near 220 V, the generator current between 20 and 40 A, and the generator temperature at a constant operating condition to avoid transformer overheating. When preliminary operation indicated excessive system load due to soil moisture, weed biomass, or electrode contact with the soil surface, the voltage selector setting was reduced to maintain stable operation and avoid overloading or overheating the generator. Once selected, voltage settings were maintained during treatment application within each study. The electrodes were positioned in direct contact with the plant base and soil surface.
Experimental plots measured 3.6 m by 9 m, and the electricity was applied to two 0.6-m strips. The experimental design consisted of two factors with four replicates. The first factor was the two voltage ranges, and the second factor was the six energy rates.
Effect of Electrode Contact Position
In continuous-contact EWC, electrode position affects both contact with the target weed and system load. Lowering the electrodes increases contact with the weed canopy, plant base, and soil surface, but it can also increase electrical load and reduce stable operation. Raising the electrodes can reduce contact with the soil surface and lower canopy but it may also reduce current flow through the plant base and crown region of Italian ryegrass. The fourth study evaluated the response of Italian ryegrass to two electrode contact positions, hereafter referred to as full contact and partial contact.
In the full-contact treatment, electrodes contacted the soil surface, lower canopy, and plant base near the crown region. In the partial-contact treatment, electrodes contacted the upper canopy primarily, with limited contact with the lower canopy, plant base, and soil surface. Because Italian ryegrass plants varied in height, tiller angle, and canopy architecture, the exact distance between the primary electrode contact point and the crown region varied among plants and was not measured. The study was conducted at the Lewis Brown Research Farm in Corvallis during the summer of 2022 when Italian ryegrass was flowering. Plants were treated with a single application of electricity at rates ranging from 8.4 (6.4 km h−1) to 67.5 kJ m−2 (0.8 km h−1). Treatments were applied at 4.7 kV. The experiment was a strip-block design with six replications. The first factor was electrode contact position (two levels), and the second factor was energy rate (six levels). The experimental unit measured 3.6 m by 6 m.
Data Collection
Assessments included visible estimates of Italian ryegrass control using a scale ranging from 0% to 100%, with 0% indicating no control and 100% representing complete control (Canadian Weed Science Society 2018). Italian ryegrass growth stage at the time of application was recorded using the BBCH scale and is reported as a descriptive characteristic of the infestations (Meier Reference Meier2001). Italian ryegrass coverage was assessed using digital images each covering approximately 6 m2. Images were analyzed with Canopeo software (Patrignani and Ochsner Reference Patrignani and Ochsner2015). The green area was estimated using the thresholds red-to-green ratio ≤1.00, blue-to-green ratio ≤0.80, and excess green index ≥20. The first two values are dimensionless color ratios, whereas the excess green threshold is an RGB-based greenness index used to exclude soil, shadows, and nonvegetative background pixels. Visual validation was conducted on a subset of the images. Assessments were made at 3, 7, 14, 21, 28, 35, and 42 d after treatment (DAT). Visible estimates of weed control and weed cover were assessed independently and were not derived from plant density measurements. At 42 DAT, surviving Italian ryegrass plants were counted to estimate plant density, and the number of inflorescences per quadrat was recorded before aboveground biomass was harvested. Aboveground biomass was collected only from living plants within two 0.25-m2 quadrats per plot, and shoot and inflorescence tissues were separated, dried, and weighed.
In the electrode contact-position study, selected inflorescences were bagged after pollination and harvested at maturity. Seeds were dried, counted, and weighed. When available, a subsample of 100 seeds was surface sterilized in 70% ethanol for 3 min, rinsed, and placed in clear acrylic germination boxes on moistened filter paper. Boxes were sealed with Parafilm and rewetted as needed. Boxes were maintained at 21 C for 14 d under a 12-h light:dark cycle with supplemental light at 300 μmol m−2 s−1 photosynthetic photon flux density. Seeds were incubated for 14 d following the standard germination protocol used by the Oregon State University Seed Laboratory for ryegrass. Germination was evaluated at 3, 7, 10, and 14 d. At 14 d, seedling linear length from the tip of the shoot to the tip of the root (in centimeters, cm) and seedling dry weight (in grams, g) were recorded.
Statistical Analysis
Statistical analyses were conducted in R software (v. 4.5.3) (R Core Team 2026). Data were subjected to ANOVA with a significance level set at α = 0.05. Experimental location, evaluation time, treatments, and their interactions were considered fixed factors, while experimental blocks were random factors. When significance of effect for experimental site or its interactions was detected, data were analyzed by the experimental site.
Italian ryegrass control and ground cover were expressed as proportions and analyzed using generalized linear mixed models with a beta distribution in the glmmTMB package. Observed values of 0 and 1 were rescaled to 0.001 and 0.999, respectively, to allow fitting of the beta distribution. Energy, voltage, study, and their interactions were included as fixed effects, and block was included as a random effect.
Plant and inflorescence counts were analyzed using generalized linear mixed models with a negative binomial distribution. Shoot and inflorescence biomass were analyzed using linear mixed-effects models, and data were log-transformed as needed to meet model assumptions. Model fit and assumptions were evaluated using residual diagnostics, including simulated residuals generated with the dharma package (Hartig and Hartig Reference Hartig and Hartig2017).
Dose-response relationships for variables were additionally described using a three-parameter log-logistic regression model, which was selected as the best fit based on the lowest Akaike information criterion and lack-of-fit tests. Data were fitted using Equation 2:
 $${\rm{Y}}\;{\rm{ = }}\;{{\rm{D}} \over {{\rm{1 + }}{{({{\rm{X}} \over {{\rm{E}}{{\rm{D}}_{{\rm{50}}}}}})}^{\rm{b}}}}}$$
where Y was the response measured, D references the upper limit, X refers to the energy rate (kJ m−2), ED 50 denotes the energy rate causing 50% reduction in the response measured, and b is the relative slope of the curve around the ED 50 . The statistical code was edited using artificial intelligence (ChatGPT; OpenAI, San Francisco, CA).
Results and Discussion
Effect of Voltage and Energy
EWC consistently suppressed Italian ryegrass in all studies following a single application. Treatment efficacy was most strongly influenced by energy rates, evaluation timing, and experimental site (Supplementary Table S1). Energy rate and days after treatment significantly affected visible control in all three studies (P ≤ 0.001). Voltage affected control in Study 1 (P = 0.007) but not in Studies 2 or 3 (P ≥ 0.132). The energy × voltage interaction was not significant in any study (P ≥ 0.644). However, energy × DAT and voltage × DAT were significant in Studies 1 and 3, and the energy × voltage × DAT interaction was significant in Studies 2 and 3, indicating that treatment responses varied over time and among sites. Although a significant interaction between energy, DAT, and voltage was sometimes observed, this was not consistent across studies, likely reflecting differences in field conditions such as soil moisture, conductivity, weed density, and biomass.
At 42 DAT, the energy rate was the primary factor affecting Italian ryegrass control and green cover in both Study 1 and Study 2 (P ≤ 0.003; Table 1). Within each study, increasing energy by reducing travel speed increased visible control (Figure 2A). Growth stage at treatment varied among the study sites: Study 1 was treated at the tillering stage (stages 22–25 on the BBCH scale), Study 2 at the stem elongation stage (stages 30 to 32 on the BBCH scale), and Study 3 at the early reproductive stage (stages 51 to 53 on the BBCH scale). At the lowest energy rate (8.4 kJ m−2; 6.4 km h−1), control remained below 60%. At 67.5 kJ m−2, the highest common energy rate, control averaged 78.8% in Study 1, 71.3% in Study 2, and 41.9% in Study 3. Increasing the amount of energy to 168.8 kJ m−2 improved control to 78.8% in Study 2 and to 55% in Study 3, representing additional increases of 7.5 and 13.1 percentage points, respectively. Green cover also generally declined with higher energy, though this response was more variable and did not always follow a clear dose-response pattern. Therefore, green cover is reported as observed means ± SE without fitted response curves (Figure 2B).
Italian ryegrass visible control (%) (A) and green cover (%) (B) in response to electrical weed control applied at two voltage rates (>5 and 3.9 kV) across a range of energy rates (kJ m−2). Data were collected 42 d after treatment in three field studies conducted in Willamette Valley, Oregon, in 2021 and 2022. The 0 kJ m−2 treatment represents the nontreated control. Points represent means ± SE (n = 4). Lines represent fitted dose-response models, where applicable, and are shown only over the observed energy range for each Study × Voltage combination. Effective dose causing 50% reduction (ED50) values are shown where applicable; n.c. indicates not calculated.”

The lower efficacy observed in Study 3 was likely associated with the more advanced growth stage of Italian ryegrass at the time of treatment. In our study, plants treated at more advanced developmental stages retained greater biomass and showed reduced overall control relative to Studies 1 and 2, when plants were less mature at the time of treatment. Growth stage effects have also been reported in soybean electrocution studies, although responses differ by species and treatment context. Schreier et al. (Reference Schreier, Bish and Bradley2022) found that control and seed germination effects were strongly related to plant height and moisture status at treatment, and that electrocution of reproductive-stage plants could substantially reduce seed germination in several broadleaf species. In contrast, the broader multistate soybean assessment found mixed efficacy across species and environments, underscoring that electrocution performance is highly dependent on plant stature, species, and field conditions (Singh et al. Reference Singh, Noguera, Jhala, Lancaster, Gage, Young, Johnson, Jha and Bradley2026). For Italian ryegrass, the reduced efficacy on larger plants likely reflects greater biomass and more protected basal meristems, which may limit lethal current flow to critical tissues.
Italian ryegrass growth was suppressed by EWC, with energy rate emerging as the primary driver of efficacy. This response is consistent with recent field studies showing that slower travel speeds, which result in greater energy delivery, improve weed control. In organic blueberry, operation speeds (0.5 to 1 km h−1) provided the highest control, and sequential applications were necessary to sustain suppression over time (Baccin and Moretti Reference Baccin and Moretti2025a). Similarly, yellow nutsedge (Cyperus esculentus L.) control improved with sequential applications or when EWC was combined with mowing, whereas single applications often resulted in regrowth (Baccin and Moretti Reference Baccin and Moretti2025b; Baccin and Moretti Reference Baccin and Moretti2026). When used to control Canada thistle (Cirsium arvensis L), one or two EWC applications provided only transient or site-dependent suppression, and when combined with clopyralid long-term control improved, particularly for a perennial species with strong belowground reserves (Baccin and Moretti Reference Baccin and Moretti2026). Together, these studies indicate that EWC can provide meaningful suppression, but the degree of control depends on weed species, energy delivery, and whether treatments are repeated or integrated with other tactics.
Interactions between energy and voltage were not significant for Italian ryegrass control and green cover, except for cover in Study 3 (P = 0.009) (Table 1). The inconsistent interactions suggest that voltage response was influenced by site-specific conditions rather than by voltage alone. Differences in environmental conditions among studies, including year, location, and naturally occurring variation in Italian ryegrass density and growth stage, may have affected electrical current transfer and treatment efficacy. The interaction between energy and DAT was significant in most cases (Supplementary Table S1), indicating that EWC injury developed over time rather than occurring only as an immediate response after treatment. Visible control generally increased during the first 14 to 21 DAT and remained evident through 42 DAT evaluation (Supplementary Figure S1), indicating persistent suppression following a single EWC application. No consistent voltage × DAT or three-way interactions were detected.
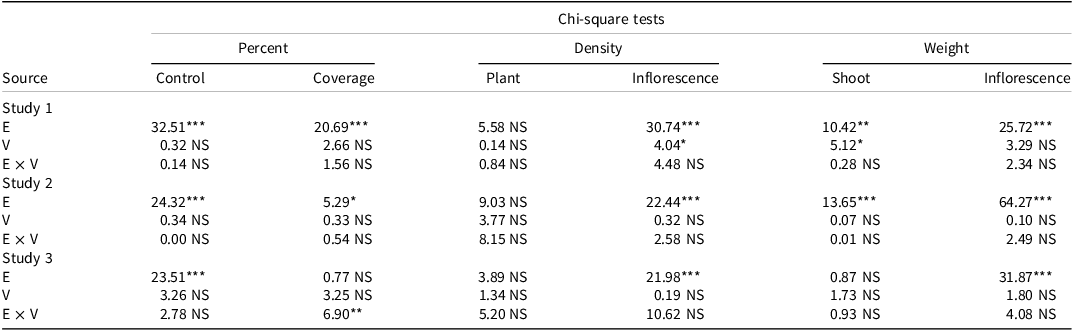
At 42 DAT, when energy was increased, Italian ryegrass shoot and inflorescence dry weight were significantly reduced across studies (P ≤ 0.001; Table 2), with biomass reductions of up to 93% (Figure 3). Voltage effects were limited and inconsistent, and the interaction between energy and voltage was rarely significant, further indicating that energy was the primary driver of treatment response. Shoot dry weights declined progressively with increasing energy in Studies 1 and 2 (Figure 3A). Substantial biomass reductions were observed at intermediate energy rates (20 to 35 kJ m−2; 1.6 to 0.8 km h−1), whereas the highest energy rates (168 kJ m−2; 0.32 km h−1) resulted in near-complete suppression. In Study 3, shoot dry weight reduction was more gradual, and substantial aboveground biomass remained even at the highest energy rate (Figure 3A). A similar pattern was observed for reproductive biomass, for which increasing the energy rate resulted in reduced inflorescence dry weight across studies (Figure 3). In Studies 1 and 2, inflorescence biomass was substantially reduced at higher energy rates, whereas in Study 3 reductions were more limited, which is consistent with the lower overall control observed (Figure 3B). Inflorescence dry weight in Study 3 was low across all energy rates, including the nontreated control (Figure 3B), likely because this study was conducted later in the season and plants were past peak flowering by the 42 DAT harvest. Plant density was not significantly reduced by EWC at 42 DAT (Figure 4A), indicating that a single application primarily suppressed Italian ryegrass growth rather than reducing plant survival. In contrast, inflorescence number declined with increasing energy in all studies (Figure 4B), indicating reduced reproductive output among surviving plants. These results indicate that energy suppressed vegetative growth and reduced reproductive output, although the magnitude of these responses varied among studies.
Summary of analysis of variance for voltage and energy studies collected 42 d after treatment. a – c

Table 2. Long description
A table summarizing analysis of variance for voltage and energy studies. The table has 3 rows and 12 columns. The columns are labeled as Source, Chi-square tests, Percent, Control, Coverage, Density, Plant, Inflorescence, Weight, Shoot, and Inflorescence. The rows are labeled as Study 1, Study 2, and Study 3. Each study has values for E, V, and E x V under the respective columns. The values include statistical significance indicators such as NS, *, **, and ***. Row 1: Study 1, E, 32.51***, 20.69***, 5.58 NS, 30.74***, 10.42**, 25.72***. Row 1: Study 1, V, 0.32 NS, 2.66 NS, 0.14 NS, 4.04*, 5.12*, 3.29 NS. Row 1: Study 1, E x V, 0.14 NS, 1.56 NS, 0.84 NS, 4.48 NS, 0.28 NS, 2.34 NS. Row 2: Study 2, E, 24.32***, 5.29*, 9.03 NS, 22.44***, 13.65***, 64.27***. Row 2: Study 2, V, 0.34 NS, 0.33 NS, 3.77 NS, 0.32 NS, 0.07 NS, 0.10 NS. Row 2: Study 2, E x V, 0.00 NS, 0.54 NS, 8.15 NS, 2.58 NS, 0.01 NS, 2.49 NS. Row 3: Study 3, E, 23.51***, 0.77 NS, 3.89 NS, 21.98***, 0.87 NS, 31.87***. Row 3: Study 3, V, 3.26 NS, 3.25 NS, 1.34 NS, 0.19 NS, 1.73 NS, 1.80 NS. Row 3: Study 3, E x V, 2.78 NS, 6.90**, 5.20 NS, 10.62 NS, 0.93 NS, 4.08 NS.
a Abbreviations: E, energy; V, voltage; E × V, interaction of energy and voltage.
b Studies were carried out at three locations in Oregon, in 2021 and 2022: in Canby (Study 1), Salem (Study 2), and Corvallis (Study 3).
c Asterisks represent significance as follows: ***P < 0.001; **P < 0.01; *P < 0.05; NS, P > 0.05.
Italian ryegrass shoot dry weight (A) and inflorescence dry weight (B) in response to electrical weed control applied at two voltage ranges (>5 and 3.9 kV) across a range of energy rates (kJ m−2). Data were collected 42 d after treatment in three field studies conducted in Willamette Valley, Oregon, in 2021 and 2022. The 0 kJ m−2 treatment represents the nontreated control. Points represent means ± SE (n = 4). Lines represent fitted dose-response models where applicable and are shown only across the observed energy range for each Study × Voltage combination. Effective dose causing 50% reduction (ED50) values are shown where applicable; n.c. indicates not calculated.

Italian ryegrass plant density (plants m−2) (A) and inflorescence number (number m−2) (B) in response to electrical weed control applied at two voltage ranges (>5 and 3.9 kV) across a range of energy rates (kJ m−2). Data were collected 42 d after treatment in three field studies conducted in Willamette Valley, Oregon, in 2021 and 2022. The 0 kJ m−2 treatment represents the nontreated control. Points represent means ± SE (n = 4). Lines represent fitted dose-response models where applicable and are shown only across the observed energy range for each Study × Voltage combination. Effective dose causing 50% reduction (ED50) values are shown where applicable; n.c. indicates not calculated.

Differences between the EWC voltage ranges tested were limited in all studies, with overlapping confidence intervals indicating similar responses at 3.9 and >5 kV for both shoot and inflorescence biomass (Figures 2 and 3). Previous electrothermal research showed that voltage can influence treatment speed; Diprose et al. (Reference Diprose, Benson and Hackam1980) reported that effective weed beet control required voltages greater than 5 kV to avoid excessively long treatment times. The lack of effect between voltage treatments likely reflects the relatively narrow voltage range evaluated, which was constrained by field and equipment operating conditions and may not have been sufficient to produce distinct biological responses. In addition, the inherent spatial variability of natural Italian ryegrass infestations may have limited our ability to detect subtle differences between voltage ranges, particularly given the strong effect of energy. While energy was the primary factor driving Italian ryegrass response, treatment efficacy is also influenced by how electrical current is transferred to the plant. Electrode contact position determines the extent of contact with plant tissues and the continuity of the electrical circuit, which can directly affect the amount of energy delivered to individual plants.
Effect of Electrode Contact Position
The effect of electrode contact position was evaluated to determine how plant-electrode contact influences treatment efficacy. In addition to its biological importance, electrode contact position is an operational consideration because under conditions of high soil conductivity and large weed biomass, reducing contact between the electrodes, weed foliage, and the soil surface may be necessary to maintain stable system operation. Electrode contact position significantly affected Italian ryegrass response to electrical weed control (Table 3), with consistent differences between full and partial contact treatments (Figure 5).
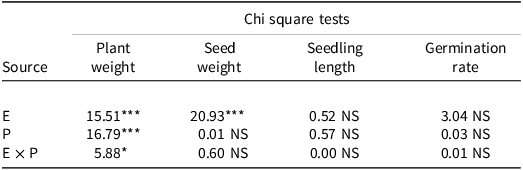
Summary of analysis of variance for the electrode contact position and energy study in 2022. a, b

Table 3. Long description
A table summarizing chi-square tests for plant weight, seed weight, seedling length, and germination rate. The table has four columns: Source, Plant weight, Seed weight, Seedling length, and Germination rate. The rows are labeled E, P, and E x P. Row 1: Source, E, P, E x P. Row 2: Plant weight, 15.51***, 16.79***, 5.88*. Row 3: Seed weight, 20.93***, 0.01 NS, 0.60 NS. Row 4: Seedling length, 0.52 NS, 0.57 NS, 0.00 NS. Row 5: Germination rate, 3.04 NS, 0.03 NS, 0.01 NS. The table shows the chi-square values and their significance levels for different sources and their interactions.
a Abbreviations: E, energy; P, electrode contact position; E × P, interaction of energy and contact position.
b Asterisks represent significance as follows: ***P < 0.001; **P < 0.01; *P < 0.05; NS, P > 0.05.
Italian ryegrass response to electrode contact position during electrical weed control, comparing full contact with the plant base and soil and partial contact with the upper canopy only at 4.7 kV across a range of energy rates. The 0 kJ m−2 treatment represents the nontreated control. Responses include shoot dry weight (A), seed weight (B), seedling length (C), and seed germination at 14 d (D). Points represent means ± SE (n = 6). Lines represent fitted response models where applicable.

Across energy rates, full contact resulted in substantially greater biomass reduction compared to partial contact (Figure 5). At intermediate energy rates (approximately 15 to 35 kJ m−2), plant biomass under partial contact was 2-fold to 3-fold greater than under full contact, indicating reduced efficacy when electrodes contacted only the upper canopy. For example, at approximately 20 kJ m−2, biomass under partial contact remained similar to that of the nontreated control, whereas full contact reduced biomass to less than 20% of the nontreated (Figure 5). At higher energy rates (>50 kJ m−2), differences between contact position treatments were reduced, with both approaches achieving substantial biomass suppression, although full contact consistently resulted in lower biomass. Energy significantly reduced plant biomass and seed weight (P ≤ 0.001), whereas electrode contact position significantly affected plant biomass but not seed weight (Table 3). The interaction between energy and contact position was significant for plant biomass, indicating that the magnitude of the contact position effect depended on the energy rate applied. These results suggest that reducing electrode contact to maintain operability under highly conductive field conditions may decrease treatment efficacy, particularly at intermediate energy rates when the current pathway through the lower canopy and soil appears to be important.
The electrode contact position results further support the importance of contact quality in EWC performance. Full contact reduced Italian ryegrass biomass more than partial contact, particularly at intermediate energy rates, indicating that current pathway through basal tissues and the soil return path is critical for effective injury. This agrees with prior studies that emphasized that plant contact time, morphology, and current transfer strongly influence EWC performance in field systems. When used on a blueberry crop, slower speeds and repeated applications improved efficacy, consistent with greater cumulative energy deposition (Baccin and Moretti Reference Baccin and Moretti2025a). In soybean and pastures, sequential passes also tended to improve outcomes, particularly where a single application left surviving tissues capable of regrowth. For Italian ryegrass, the lack of seed germination effects together with strong biomass reduction suggests that incomplete contact, rather than sublethal effects on contacted tissues, was likely the main cause of plant survival (Coe et al. Reference Coe, Bunton, Lee, Tate, Wesslak and Bradley2026). Full contact, which included the lower canopy, plant base, and soil surface, reduced biomass more than partial contact, especially at intermediate energy rates. These findings suggest that applicator design should focus on improving contact with basal tissues, but this may involve more than simply lowering the electrode height. Electrode length, flexibility, orientation, contact surface, and ground-following ability may all influence contact duration and current transfer. Designs that improve contact with the lower canopy and crown region while avoiding excessive circuit load may improve EWC consistency in orchard systems.
Electrical weed control reduced seed production potential through significant reductions in inflorescence biomass; however, seed germination was not affected. Seed weight decreased with increasing energy, with reductions occurring at lower to intermediate energy rates and reaching a plateau at approximately 17 kJ m−2, beyond which no additional decreases were observed (Table 3). In contrast, final germination at 14 d, seedling length, and seedling biomass were not influenced by energy rate or electrode contact position (P ≥ 0.05). These results indicate that while electrical treatments reduced seed production, the germination and early vigor of seeds produced by surviving Italian ryegrass plants were not affected.
Although EWC did not eliminate Italian ryegrass or reduce final seed germination, it substantially reduced inflorescence biomass, indicating the potential to suppress seed return to the soil seedbank. This is a relevant outcome because previous soybean studies showed that electrocution can reduce weed seed germination when reproductive structures are directly exposed to the treatment. Schreier et al. (Reference Schreier, Bish and Bradley2022) reported reductions in seed germination ranging from 54% to 80% among species when seeds were present at the time of electrocution. In the present study, seeds collected from all treatments, including the nontreated control represented by the 0 kJ m⁻2 treatment, were included in the germination assay. Final germination, seedling length, and seedling biomass were unaffected, suggesting that seeds collected from surviving Italian ryegrass plants were likely produced on tillers or inflorescences that escaped full electrical contact. Similar to tall fescue pasture systems, electrical treatments primarily reduced reproductive biomass rather than consistently affecting seed germination, indicating that incomplete electrical contact with reproductive tissues limits direct impacts on germination (Coe et al. Reference Coe, Bunton, Lee, Tate, Wesslak and Bradley2026). Thus, for Italian ryegrass, the principal reproductive effect of a single EWC treatment appears to be reduced inflorescence production rather than direct damage to seed germination.
Practical Implications
Electrical weed control can be integrated into hazelnut orchard floor management as a nonchemical tactic to suppress herbicide-resistant Italian ryegrass and reduce reproductive output. However, EWC should not be viewed as a single-pass, stand-alone treatment for complete grass control. A single application reduced shoot biomass, inflorescence biomass, and inflorescence number, but it did not consistently reduce plant density. Therefore, surviving plants may continue to compete with the crop and may still contribute viable seed to the soil seedbank. The practical value of EWC in orchard systems is likely greatest as a suppression and fecundity-reduction tool, particularly when applied before seed maturation. More complete management of herbicide-resistant Italian ryegrass will likely require repeated EWC passes or integration with mowing, herbicides, cover crops, or other orchard floor management tactics. This interpretation is consistent with studies in blueberry, yellow nutsedge, Canada thistle, pasture, and soybean, for which single applications often provided incomplete or transient control, whereas repeated or integrated treatments improved consistency and long-term suppression. Economic performance will be important for determining the practical adoption of EWC in hazelnut orchards. The present study did not include a formal economic analysis or direct comparison with other weed management methods; therefore, EWC efficacy should be interpreted relative to the nontreated control and the operational energy rates evaluated. From a sustainability perspective, EWC may provide a nonchemical tactic that reduces reliance on herbicides and contributes to herbicide-resistance management while avoiding soil disturbance associated with cultivation. However, commercial feasibility will depend on equipment cost, operating speed, number of passes required, energy use, labor requirements, crop safety, and consistency of control under commercial orchard conditions. Future studies should compare repeated EWC applications with standard herbicide programs, mowing, and integrated orchard floor management practices, and should include economic analyses and environmental assessments to estimate cost per treated area and overall sustainability.
Supplementary material
To view supplementary material for this article, please visit https://doi.org/10.1017/wet.2026.10147
Acknowledgments
We thank the hazelnut growers in Canby, Salem, and Corvallis, Oregon, for generously allowing access to their orchards to conduct this research.
Funding
This study received financial support through project awards 2020-70006-32982 and 2023-70006-40609 from the U.S. Department of Agriculture–National Institute of Food and Agriculture’s Crop Protection and Pest Management Program, and from the Oregon Hazelnut Commission and the Ferrero Hazelnut Company.
Competing Interests
The authors declare they have no competing interests.






 Open access

