

Highlights
-
Existing literature suggests that kinesiophobia could negatively impact the quality of life of individuals living with Parkinson’s disease (PD).
-
Prior to this study, no scale existed to measure kinesiophobia in French-speaking PD patients.
-
The French-Canadian Tampa Scale of Kinesiophobia for Parkinson’s disease has adequate psychometric properties.
Introduction
Kori et al. originally defined kinesiophobia as “an excessive, irrational, and debilitating fear of physical movement and activity resulting from a feeling of vulnerability to painful injury or reinjury.” Reference Kori, Miller and Todd1 However, subsequent research has suggested that this phobia may develop in response to factors beyond painful injuries, including symptoms associated with heart disease, fibromyalgia, chronic fatigue syndrome, multiple sclerosis and strokes. Reference Bäck, Jansson, Cider, Herlitz and Lundberg2–Reference Wasiuk-Zowada, Knapik, Szefler-Derela, Brzęk and Krzystanek5 Accordingly, kinesiophobia can be described as an excessive and irrational fear of movement and physical activity, regardless of its origin. Importantly, while someone can have a rational and protective fear of movement, such as fearing heavy lifting after a back operation in accordance with medical advice, kinesiophobia is inherently irrational and maladaptive, as the resulting physical inactivity may contribute to the worsening of an individual’s health condition. Reference Vlaeyen, Kole-Snijders, Boeren and van Eek6
Individuals living with Parkinson’s disease (PD) can be at risk of developing kinesiophobia, particularly due to the debilitating nature of the disease’s motor symptoms such as impaired balance, bradykinesia, rigidity and tremor. However, research on this topic in PD remains rare. The few studies conducted recently suggest that higher kinesiophobia in PD is associated with poorer quality of life, Reference Monticone, Ferrante, Ambrosini, Rocca, Secci and Foti7,Reference Sütçü, Ayvat and Kilinç8 higher levels of anxiety and depression, Reference Monticone, Ferrante, Ambrosini, Rocca, Secci and Foti7 more severe motor symptoms, Reference Monticone, Ferrante, Ambrosini, Rocca, Secci and Foti7,Reference Oğuz, Ertürk, Polat and Apaydın9,Reference Simone Vullo, Monticone, Arippa, Cossu and Pau10 greater balance impairment, Reference Oğuz, Ertürk, Polat and Apaydın9 lower confidence to move without falling, Reference Monticone, Ferrante, Ambrosini, Rocca, Secci and Foti7,Reference Oğuz, Ertürk, Polat and Apaydın9 lower levels of physical activity Reference Oğuz, Ertürk, Polat and Apaydın9 and lower total energy expenditure. Reference Sütçü, Ayvat and Kilinç8 Notably, the last two findings are supported by a recent literature review, which identified kinesiophobia as a significant factor limiting physical activity among individuals with chronic diseases. Reference Wlazło, Szlacheta and Grajek11
This is particularly problematic, as exercise is crucial for people with PD, especially considering its potential to slow down disease progression. Reference Mak, Wong-Yu, Shen and Chung12 Furthermore, meta-analyses found that exercise in PD has a positive effect on depression and anxiety, Reference Costa, Prati, de Oliveira Barreto Suassuna, Souza Silva Brito, Frigo da Rocha and Gianlorenço13 cognitive function, Reference da Silva, Iop and de Oliveira14 sleep quality Reference Cristini, Weiss and De Las Heras15 and balance. Reference Fan, Yuan and Bai16,Reference Zhen, Zhang, Tao, Li, Lv and Yu17 Despite these benefits, a study showed that those with PD were 29% less active than controls. Reference van Nimwegen, Speelman and Hofman-van Rossum18 Whether kinesiophobia plays a role in the physical inactivity of this population remains unknown.
To explore kinesiophobia among PD patients and its potential effects on their exercise levels, it is crucial to have a measurement tool that is valid and appropriate for this population. The Tampa Scale of Kinesiophobia (TSK) Reference Miller, Kori and Todd19 is a reliable and valid instrument used in research and clinical settings to measure kinesiophobia related to painful medical conditions and injuries. Reference Dupuis, Cherif, Batcho, Massé-Alarie and Roy20 However, it is not appropriate for PD, as it cannot capture fear of movement related to the symptoms of the disease. To address this limitation, Monticone et al. modified the TSK, resulting in the TSK-PD. Reference Monticone, Ferrante, Ambrosini, Rocca, Secci and Foti7 In this version, items originally referring to pain were reworded to focus on movement impairment. While Italian and English versions of the TSK-PD are available, no French translation existed prior to this study.
Therefore, the purposes of the current study were (1) to translate and cross-culturally adapt the English version of the TSK-PD into Canadian French (F-TSK-PD), and (2) to carry out a psychometric validation of the F-TSK-PD with a French-speaking Canadian population with PD.
Methods
Study design
The present study was conducted in two stages. First, the English TSK-PD was translated, cross-culturally adapted for Canadian French and pretested. Second, data were collected to assess the psychometric properties of the scale, including a retest 14 days following the baseline test.
Procedure
In stage one, translation and cross-cultural adaptation followed established recommendations. Reference Beaton, Bombardier, Guillemin and Ferraz21,Reference Wild, Grove and Martin22 The research team included a PD-specialized neuroscientist (APD), a doctor in psychology (GC), a movement disorder neurologist (JS), a rehabilitation specialist experienced in kinesiophobia (GL) and a research assistant (NM). The study procedure is described in Figure 1. First, GL and a professional translator produced two independent French translations of the English TSK-PD. The translations were then compared by the research team and the professional translator to create one synthesized version. Second, two independent back translations into English were carried out from this adopted version by JS and a different professional translator. Third, all translations were compared by the research team and the professional translators to create a prefinal version, ensuring that it was comprehensible to individuals with a reading level equivalent to that of a 12-year-old. Fourth, the prefinal version was administered to seven participants with a LimeSurvey online questionnaire. Participants were asked to propose modifications for items they considered to be unclear. Comments were then reviewed, and a final version was adopted. The F-TSK-PD is available in Supplementary Table 1.
Study procedure. F-TSK-PD = French-Canadian Tampa Scale of Kinesiophobia for Parkinson’s disease; HADS = Hospital Anxiety and Depression Scale; MFES = Modified Falls Efficacy Scale; MDS-UPDRS Part II = Movement Disorder Society-sponsored revision of the Unified Parkinson’s Disease Rating Scale Part II; SF-36 = 36-Item Short Form Survey.

Fifth, to test the F-TSK-PD during stage two, data were collected with an online questionnaire hosted on LimeSurvey. The following sociodemographic and health information was collected in the test questionnaire: age, sex, gender, marital status, education level, smoking or use of other tobacco products, presence of another health condition, self-reported Hoehn and Yahr stage, cause of PD (idiopathic or genetic) and number of years since diagnosis and first symptoms. Since data were not collected in person, the acquisition of the Hoehn and Yahr stage was modified as an in-person physical assessment was not possible. Specifically, answers to two questions (unilateral or bilateral symptoms and severity of balance impairment) were used to estimate the Hoehn and Yahr stage for each participant. To assess construct validity, the following scales were administered: Hospital Anxiety and Depression Scale (HADS), Modified Falls Efficacy Scale (MFES), Movement Disorder Society-sponsored revision of the Unified Parkinson’s Disease Rating Scale Part II (MDS-UPDRS Part II) and 36-Item Short Form Survey (SF-36). Reference Monticone, Ferrante, Ambrosini, Rocca, Secci and Foti7 Sixth, to assess reliability, participants who provided consent were emailed a follow-up questionnaire containing only the F-TSK-PD, 14 days after the test. A retest interval of 14 days is likely long enough to prevent participants from recalling their initial answers and remains sufficiently short to minimize the likelihood that real change occurred in the participants’ health conditions between test and retest. Reference Terwee, Bot and de Boer23
Participants
Participants were recruited through the Quebec Parkinson Network Reference Gan-Or, Rao and Leveille24 and Canadian Open Parkinson Network; Reference Cressatti, Pinilla-Monsalve and Blais25 through Parkinson Québec and Parkinson Canada; at healthcare facilities within the CISSS de l’Outaouais; and with an in-lab list of participants willing to take part in research. To compensate participants for their time, gift cards (total worth of 260$) were raffled after the pretest, test and retest.
Inclusion criteria were a self-reported (1) clinical diagnosis of PD, (2) ability to walk without the assistance of another person, (3) identification as French-speaking and (4) Canadian residence. Exclusion criteria were (1) an inability to identify animals from a list of words and to indicate the current season and year as an indication of cognitive limitations that may interfere with the ability to complete the questionnaire, (2) having, in the past year, a stroke, myocardial infarction, bone fracture or joint replacement and (3) living with a muscular disease, neurological disease other than PD or lung disease. Reference Monticone, Ferrante, Ambrosini, Rocca, Secci and Foti7
The pretest was conducted first with a separate group of seven individuals Reference Wild, Grove and Martin22 during February 2025. A different sample was then selected for the test. After excluding one person for missing data, the final sample size was 102 for the test, which corresponds to the recommendation of at least seven times the number of items and a minimum of 100 participants. Reference Terwee, Bot and de Boer23 Out of the 101 participants who consented to receiving the retest 14 days after the test, 73 completed it. Those with a long retest interval (more than 18 days) were excluded from the test-retest reliability analysis to minimize the likelihood that real change occurred between test and retest. The final sample size for the retest was 64, meeting the guideline of at least 50, Reference Terwee, Bot and de Boer23 with an average test-retest interval of 15 days (SD = 1, range = 14–18). Data collection for the test and retest took place from February 2025 to August 2025.
Ethical approval was granted by the Research Ethics Committee of the CISSS de l’Outaouais (Numbers 2025–207, 2024–429) and the Université du Québec en Outaouais (Number 2025–3647). Implicit consent to participate in this study was obtained from all participants.
Measures
F-TSK-PD. The TSK-PD Reference Monticone, Ferrante, Ambrosini, Rocca, Secci and Foti7 includes 13 items rated on a four-point Likert scale ranging from “strongly disagree” (1) to “strongly agree” (4), with higher scores indicating higher kinesiophobia. The scale comprises two subscales: “Activity Avoidance,” reflecting the belief that physical activity is unsafe for people with PD, and “Harm,” reflecting the belief that one’s body is dangerously compromised. The TSK-PD has demonstrated reliability (ICC = 0.90; α = 0.94) and validity in an Italian PD population. Only our French-Canadian translation was administered.
HADS. Reference Zigmond and Snaith26 This scale comprises seven items measuring anxiety (HADS-A) and seven items measuring depression (HADS-D). To calculate a total score for each subscale, all the items of that subscale are summed up. Higher scores indicate higher levels of anxiety and depression. The validated French-Canadian HADS, which was found to have two factors (anxiety and depression), was used. Reference Roberge, Doré and Menear27 Both subscales also demonstrated validity and adequate internal consistency (HADS-A: α = 0.82; HADS-D: α = 0.83). Reference Roberge, Doré and Menear27
MFES. Reference Hill, Schwarz, Kalogeropoulos and Gibson28 This questionnaire measures the level of confidence to execute daily tasks without falling. Items are scored on a scale ranging from 0 (not confident at all) to 10 (completely confident). A total score was obtained by adding up all the items. The French version has demonstrated validity and reliability (ICC = 0.96; α = 0.96). Reference Perrot, Castanier, Maillot and Zitari29
MDS-UPDRS Part II. Reference Goetz, Tilley and Shaftman30 This 13-item self-report questionnaire quantifies the severity of PD motor symptoms. A higher score, calculated by adding up all the items, indicates a greater severity of motor symptoms. This study incorporates the Official French Translation of the MDS-UPDRS, which is owned and licensed by the International Parkinson and MDS. Use of the scale in this research was made under license and with permission from MDS, the copyright holder. Although, to the authors’ knowledge, the French version of the scale has not been psychometrically validated, the part II of the English version has demonstrated validity and internal consistency (α = 0.90). Reference Goetz, Tilley and Shaftman30
SF-36. Reference Ware and Sherbourne31 This scale assesses quality of life using 36 items. Scoring for the eight subscales followed Ware et al., Reference Ware, Snow, Kosinski and Gandek32 while the Physical Component Summary (PCS) and Mental Component Summary (MCS) were scored using Ware et al. Reference Ware, Kosinski and Keller33 Higher scores indicate better quality of life. The French version has shown validity and reliability (α = 0.85–0.94 for the eight subscales). Reference Leplège, Ecosse, Verdier and Perneger34
Statistical analyses for psychometric validation
Statistical analyses were conducted using IBM SPSS v30 (IBM Corporation, Armonk, New York) as described below. A p-value <0.05 was considered statistically significant.
The factor structure of the F-TSK-PD was first examined using exploratory factor analysis (EFA), as only confirmatory factor analysis (CFA) had been performed on the TSK-PD. Reference Monticone, Ferrante, Ambrosini, Rocca, Secci and Foti7 Bartlett’s test of sphericity and the Kaiser-Meyer-Olkin (KMO) test were conducted: a statistically significant Bartlett test and a KMO value ≥ 0.50 indicate that the data are suitable for EFA. Reference Watkins35 Principal axis factoring was chosen, as it does not assume normality, and because of inter-factor correlation, direct oblimin was used. Reference Costello and Osborne36
CFA was also performed using Stata v19.5 (StataCorp LLC, College Station, Texas). Four models were tested: Monticone et al.’s two-factor model (Model 1), Reference Monticone, Ferrante, Ambrosini, Rocca, Secci and Foti7 Clark et al.’s two-factor model (Model 2), Reference Clark, Kori and Brockel37 a one-factor model (Model 3), due to the strong inter-factor correlation, and the model obtained in the EFA (Model 4). Multiple indices were used to assess model fit: the root mean square error of approximation (RMSEA), comparative fit index (CFI), Tucker-Lewis index (TLI) and standardized root mean square residual (SRMR). RMSEA values <0.08 suggest acceptable fit, and <0.05 indicate good fit. CFI and TLI values between 0.90 and 0.94 are acceptable, while ≥0.95 are good. SRMR values <0.08 are acceptable. Reference Brown38
To our knowledge, no other scale measures kinesiophobia related to PD. Therefore, evaluating criterion validity was not possible. Instead, construct validity was assessed using the strength of correlations between the F-TSK-PD and related measures. Moderate positive correlations were expected with the HADS-A, HADS-D and MDS-UPDRS Part II. In contrast, we hypothesized that the F-TSK-PD would correlate moderately and negatively with the MFES, SF-36 PCS and SF-36 MCS. Our hypotheses were based on the correlations found in previous literature on kinesiophobia in PD. Reference Monticone, Ferrante, Ambrosini, Rocca, Secci and Foti7–Reference Simone Vullo, Monticone, Arippa, Cossu and Pau10 Correlations between 0.10 and 0.39 were considered weak, 0.40–0.69, moderate and 0.70–0.99, strong. Reference Dancey and Reidy39 To confirm construct validity, at least 75% of our hypotheses must be supported by the results. Reference Terwee, Bot and de Boer23 Pearson’s correlation coefficient was used, even if the Shapiro-Wilk test revealed non-normal distributions for all measures, except the SF-36 PCS. This choice was made for comparability, as it appears to be the most used coefficient in psychometric validation studies, and because it remains very robust even if its basic assumption of normality is violated. Reference Streiner, Norman and Cairney40 Nevertheless, Spearman correlations are reported in Supplementary Table 2.
Internal consistency was assessed with Cronbach’s alpha (α), for which a value between 0.70 and 0.95 was considered acceptable. Reference Terwee, Bot and de Boer23 In addition, the effect of removing an item from the scale was evaluated using Cronbach’s alpha if an item were deleted. Finally, corrected item-total correlations were computed. A Pearson correlation coefficient <0.20 likely indicates that the item measures a construct different from the overall scale. Reference Streiner, Norman and Cairney40
Test-retest reliability was assessed by a two-way mixed, absolute agreement, single-measure intraclass correlation coefficient (ICC). Reference Koo and Li41 ICC values were interpreted as follows: <0.50, poor; 0.50–0.74, moderate; 0.75–0.89, good and ≥0.90, excellent. Reference Koo and Li41
Lastly, the minimal detectable change (MDC) was calculated with the following formula:
 ${\rm MDC}_{95} = {\rm SEM} \times 1.96 \times \sqrt{2}$
,
Reference Terwee, Bot and de Boer23
and the standard error of measurement (SEM) using:
 ${\rm SEM} = {\rm SD} \times \sqrt{(1 - {\rm ICC})}$
.
Reference Streiner, Norman and Cairney40
The higher standard deviation (SD) of the F-TSK-PD test was used to help avoid underestimating the MDC.
Reference Hollman, Beckman, Brandt, Merriwether, Williams and Nordrum42
To investigate the presence of floor and ceiling effects, the proportion of participants scoring the minimum and maximum F-TSK-PD score was calculated. More than 15% of participants need to score at those extremes for these effects to be considered present. Reference Terwee, Bot and de Boer23
Results
Translation and cross-cultural adaptation
During the pretest, all items were generally well accepted, except for the term “movement impairment,” which was translated to “difficultés de mouvement” (movement difficulties) to avoid technical terms such as “trouble moteur” (motor disorder) or “symptômes moteurs” (motor symptoms). Based on participant feedback, this was revised to “difficultés de mouvement liées à la maladie de Parkinson” (movement difficulties related to PD) to clarify that it referred to the motor symptoms of PD and not to general movement difficulties (e.g. running and walking).
There are slight differences between the English and Italian versions of the TSK-PD. Item 6 of the English scale is worded as “My injury has put my body at risk for the rest of my life,” whereas the Italian version referred to “Il mio problema” (my problem), implying PD. We deemed “my injury” to be imprecise and revised it to “Ma maladie de Parkinson” (my Parkinson’s disease). Furthermore, item 7 of the English version refers to an injury, while the Italian version is more broadly about bodily damage (“danneggiato il mio corpo”). The term “injury” was retained in the French translation for consistency with the English text.
Participants
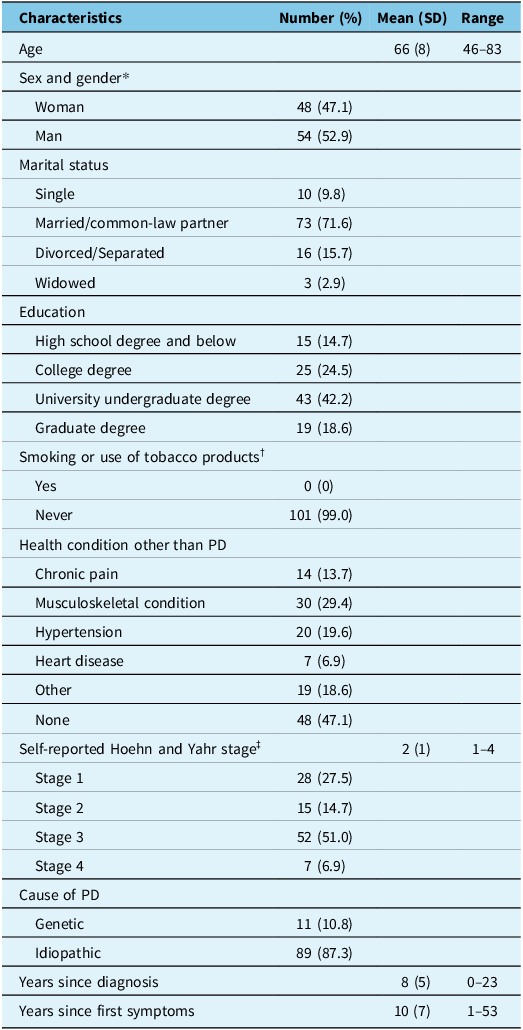
Of the 102 participants, 47.1% were women and 52.9% were men. The mean age was 66 years (SD = 8, range = 46–83). In total, 87.3% of individuals in our sample have idiopathic PD. The mean number of years since the diagnosis of PD was 8 (SD = 5, range = 0–23) and the mean Hoehn and Yahr stage was 2 (SD = 1, range = 1–4). Additional characteristics are presented in Table 1, while sample characteristics for the pretest and retest can be found in Supplementary Tables 3 and 4.
Characteristics of the test sample (n = 102)

Note : *Every participant’s gender matched their sex at birth.
†A total count that does not equal 102 indicates that some participants chose not to answer the question.
‡Because of the online nature of this study, the Hoehn and Yahr stage was not acquired through a physical assessment, but instead based on answers to two questions (uni- vs. bi-laterality of symptoms and severity of balance impairment).
SD = standard deviation.
Factor structure
Bartlett’s test of sphericity was statistically significant, χ 2(78) = 612.57, p < 0.001, and the KMO statistic was 0.91. Based on Kaiser’s criterion, Reference Costello and Osborne36 two factors were retained, explaining 43.5% and 5.4% of the variance, respectively. Despite items 1, 9 and 15 showing crossloading (see Supplementary Table 5), the two-factor solution was preferred over the one-factor model for several reasons. Inter-factor correlation was 0.58, not strong enough to justify a one-factor solution; Reference Shao, Elahi Shirvan and Alamer43 all items had acceptable loadings exceeding 0.32; Reference Costello and Osborne36 and the two factors measured two conceptually different phenomena, activity avoidance and harm. Reference Monticone, Ferrante, Ambrosini, Rocca, Secci and Foti7
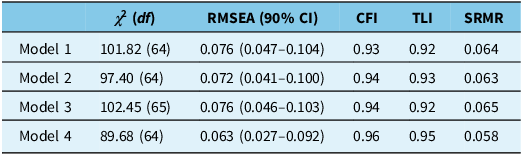
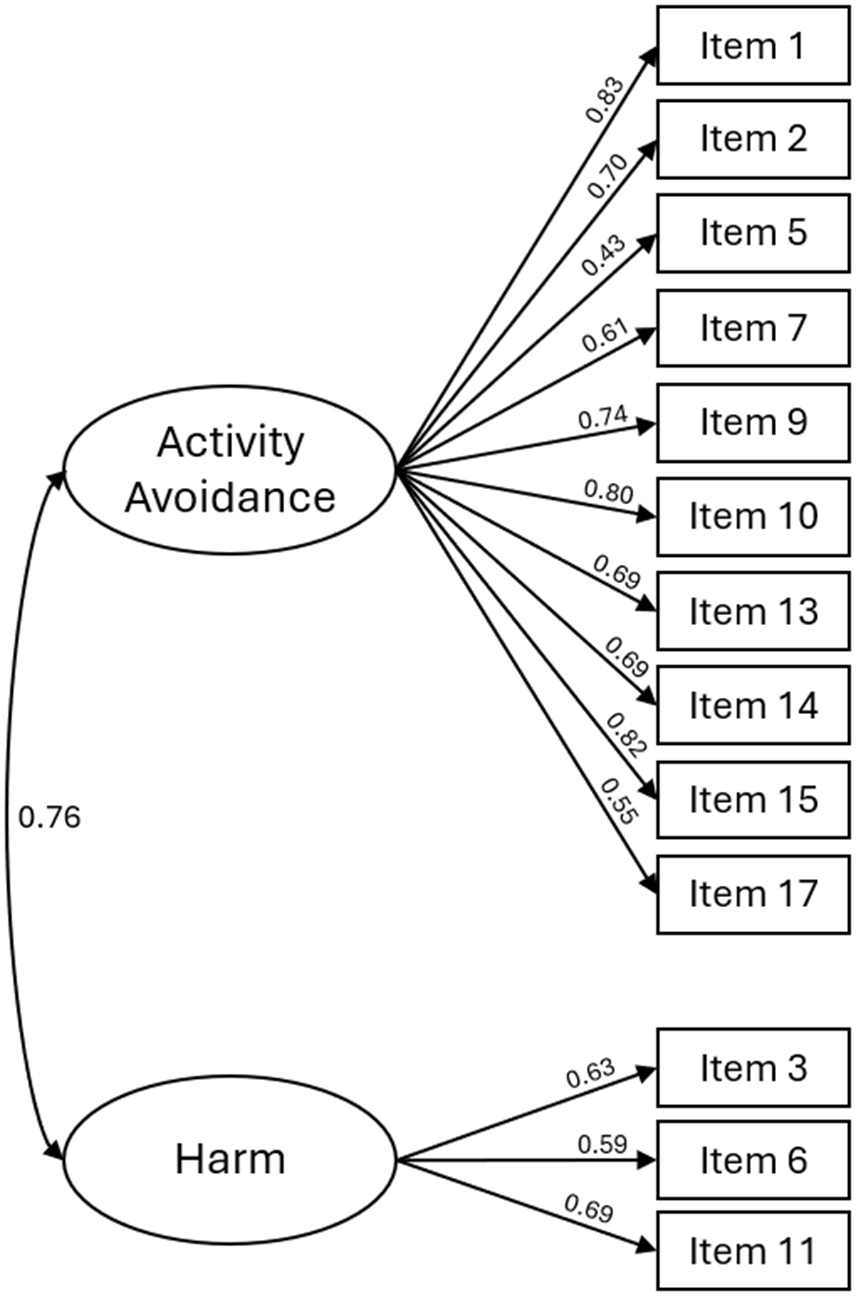
CFA revealed an adequate fit for Models 1–3 and a better fit for Model 4 (see Table 2). Model 1 showed an inter-factor correlation of 0.98, largely exceeding the 0.85 threshold for problematic discriminant validity. Reference Brown38 In contrast, Models 2 and 4 showed lower inter-factor correlations of 0.89 and 0.76, respectively. Standardized factor loadings are presented in Figure 2 and Supplementary Figures 1–3. Model 4 was retained for subsequent analyses (see Discussion for rationale).
Goodness-of-fit indices for four models as obtained with CFA

Note: Model 1: two-factor model by Monticone et al.; Reference Monticone, Ferrante, Ambrosini, Rocca, Secci and Foti7 Model 2: two-factor model by Clark et al.; Reference Clark, Kori and Brockel37 Model 3: one-factor model; Model 4: model identified in the EFA.
χ 2 = Chi-square; df = Degrees of freedom; RMSEA = Root mean square error of approximation; CFI = Comparative fit index; TLI = Tucker-Lewis index; SRMR = Standardized root mean square residual.
Standardized factor loadings for Model 4 as obtained with confirmatory factor analysis.

Construct validity
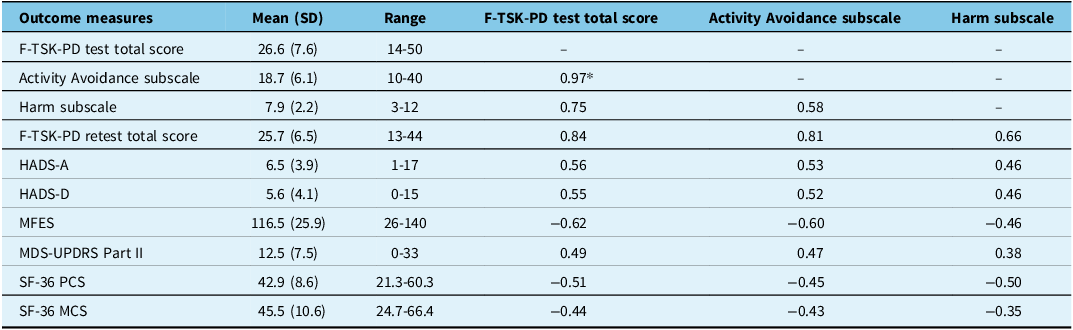
Table 3 shows positive moderate correlations between the F-TSK-PD and the HADS-A, HADS-D and MDS-UPDRS Part II, and negative moderate correlations with the MFES, SF-36 PCS and SF-36 MCS. The correlations between the F-TSK-PD and the eight SF-36 subscales are presented in Supplementary Table 6, as our hypotheses only concerned the SF-36 PCS and MCS.
Descriptive statistics of the outcome measures and Pearson correlations for the construct validity of the F-TSK-PD

Note: *For all correlations, p < 0.001.
SD = standard deviation; F-TSK-PD = French-Canadian Tampa Scale of Kinesiophobia for Parkinson’s disease; HADS-A = Hospital Anxiety and Depression Scale-Anxiety Subscale; HADS-D = Hospital Anxiety and Depression Scale-Depression Subscale; MFES = Modified Falls Efficacy Scale; MDS-UPDRS Part II = Movement Disorder Society-sponsored revision of the Unified Parkinson’s Disease Rating Scale Part II; SF-36 PCS = 36-Item Short Form Survey – Physical Component Summary; SF-36 MCS = 36-Item Short Form Survey – Mental Component Summary.
Reliability
As shown in Table 4, Cronbach’s alpha was 0.90. Corrected item-total correlations ranged from 0.42 to 0.77, and Cronbach’s alpha if the item were deleted ranged from 0.89 to 0.90 (see Supplementary Table 7). The F-TSK-PD had an ICC of 0.84 (95% CI [0.75, 0.90]) and the ICC for individual items ranged from 0.33 to 0.67 (see Supplementary Table 8). SEM and MDC95 were 3.04 and 8.43, respectively.
Cronbach’s alpha, ICC, SEM, MDC and floor/ceiling effects

Note: ICC = Intraclass correlation coefficient; CI = Confidence interval; SEM = Standard error of measurement; MDC = Minimal detectable change.
Floor and ceiling effects
No participant achieved the minimum or maximum score on the F-TSK-PD (see Table 4).
Discussion
The objectives of this study were to translate and cross-culturally adapt the English version of the TSK-PD into Canadian French, and to conduct a psychometric validation. Results support the use of the F-TSK-PD in a French-speaking Canadian population with PD.
Numerous studies support a two-factor structure consisting of “Activity Avoidance” and “Harm” (also called “Somatic Focus”). Reference Dupuis, Cherif, Batcho, Massé-Alarie and Roy20,Reference Clark, Kori and Brockel37,Reference Goubert, Crombez, Van Damme, Vlaeyen, Bijttebier and Roelofs44,Reference Roelofs, Goubert, Peters, Vlaeyen and Crombez45 Similarly, the EFA conducted in this study identified these factors. Our subsequent CFA rejected the one-factor solution (Model 3) due to its comparable fit to Models 1 and 2 and lack of evidence for a unidimensional model in the literature. Reference Dupuis, Cherif, Batcho, Massé-Alarie and Roy20 While Model 1 demonstrated acceptable fit and was confirmed with the TSK-PD, Reference Monticone, Ferrante, Ambrosini, Rocca, Secci and Foti7 it was rejected due to its near-perfect inter-factor correlation. Model 2, supported in pain populations, Reference Clark, Kori and Brockel37,Reference Goubert, Crombez, Van Damme, Vlaeyen, Bijttebier and Roelofs44,Reference Roelofs, Goubert, Peters, Vlaeyen and Crombez45 demonstrated strong inter-factor correlation and lacks validation in PD populations. It was therefore rejected. Model 4 was considered the most robust solution: its fit was superior compared to other models (although expected, as EFA and CFA were conducted on the same sample), it remains grounded in existing literature, retaining the two most reported factors (despite items 5 and 7 missing on the Harm factor), and it had an acceptable inter-factor correlation below 0.85. Reference Brown38
Pearson and Spearman correlations supported the hypotheses formulated to evaluate construct validity. Consistent with Monticone et al., similar correlations were observed between kinesiophobia and anxiety, depression, fear of falling, severity of motor symptoms and the mental components of the SF-36. Reference Monticone, Ferrante, Ambrosini, Rocca, Secci and Foti7 However, unlike Monticone et al. who reported weak correlations between the TSK-PD and the physical components of the SF-36, the present study found moderate correlations. While they argue that the TSK-PD focuses more on the cognitive dimensions of movement, our findings suggest that the scale could also relate to physical function. This may be because the TSK-PD appears to capture cognitive and emotional phenomena in the context of movement-related fear, which is impacted by the motor symptoms of PD. Our results are also in line with other studies on kinesiophobia in PD that showed a significant relationship between the TSK and fear of falling, severity of motor symptoms and quality of life. Reference Sütçü, Ayvat and Kilinç8–Reference Simone Vullo, Monticone, Arippa, Cossu and Pau10
Cronbach’s alpha was adequate, suggesting that all the items measure the same construct. It was lower than the TSK-PD (α = 0.94), Reference Monticone, Ferrante, Ambrosini, Rocca, Secci and Foti7 but higher than the validated TSK for heart disease (α = 0.78), Reference Bäck, Jansson, Cider, Herlitz and Lundberg2 TSK for chronic fatigue syndrome (α = 0.68) Reference Silver, Haeney, Vijayadurai, Wilks, Pattrick and Main4 and TSK-13 for pain (α = 0.70–0.82). Reference Dupuis, Cherif, Batcho, Massé-Alarie and Roy20 Moreover, none of the items were problematic, as corrected item-total correlations were higher than 0.20 and removing items did not improve internal consistency.
The F-TSK-PD demonstrated good test-retest reliability. This indicates that scores are highly consistent across repeated measurements, suggesting that observed scores constitute a close approximation of individuals’ true scores. Test-rest reliability was weaker than the TSK-PD (ICC = 0.90), Reference Monticone, Ferrante, Ambrosini, Rocca, Secci and Foti7 TSK for chronic fatigue syndrome (r = 0.89) Reference Silver, Haeney, Vijayadurai, Wilks, Pattrick and Main4 and TSK-13 for pain (ICC = 0.96–0.99), Reference Dupuis, Cherif, Batcho, Massé-Alarie and Roy20 but similar to the TSK for heart disease (ICC = 0.83). Reference Bäck, Jansson, Cider, Herlitz and Lundberg2 Individual items should not be used in isolation to measure kinesiophobia, as many demonstrated poor test-retest reliability. The MDC has also been calculated to determine whether an intervention has a real impact on kinesiophobia, beyond measurement error. MDC95 was 8.43, indicating that a change equal to 8.43 or greater is likely, with 95% confidence, due to real change and not measurement error. Reference Terwee, Bot and de Boer23
Consistent with the TSK-PD, Reference Monticone, Ferrante, Ambrosini, Rocca, Secci and Foti7 the F-TSK-PD shows no floor or ceiling effects. These effects may be problematic, as they make it impossible to differentiate between individuals who truly belong at either extreme and individuals whose true score lies outside of the minimum or maximum, thus affecting reliability. Reference Terwee, Bot and de Boer23 The absence of such effects supports the reliability of the F-TSK-PD. Our results also align with a systematic review reporting no such effects in studies assessing the TSK for pain. Reference Dupuis, Cherif, Batcho, Massé-Alarie and Roy20
This study has some limitations. First, as in most psychometric validation studies, random sampling was not utilized, limiting generalizability. Indeed, descriptive statistics seemed to indicate that our sample had notably high education levels and low tobacco use compared to national averages. 46,47 Second, data were self-reported using online questionnaires, potentially excluding individuals who are less familiar with technologies, and making it impossible to conduct an in-person cognitive impairment screening and clinical assessment. Third, content validity was not assessed in this study because a qualitative approach would be needed to evaluate whether the TSK-PD accurately reflects the different dimensions of kinesiophobia in PD. Finally, the fact that exploratory and confirmatory factor analyses were conducted on the same sample may explain the better fit of Model 4. Further research is necessary to confirm the performance of this model.
Conclusion
This study showed that the F-TSK-PD is a reliable and valid instrument to measure kinesiophobia in a French-speaking Canadian population with PD, with psychometric properties comparable to the Italian TSK-PD. Reference Monticone, Ferrante, Ambrosini, Rocca, Secci and Foti7 The F-TSK-PD can be recommended for use in research and in clinical settings to better identify kinesiophobia and promote physical activity.
Supplementary material
The supplementary material for this article can be found at https://doi.org/10.1017/cjn.2025.10509
Author contributions
GC and APD: funding acquisition. NM, GC and APD: study preparation. GL: forward translation. JS: back translation. NM, GC, JS, GL and APD: translation and cross-cultural adaptation. NM, JS, and APD: data collection. NM and JD: data analysis. NM and APD: writing the manuscript. NM, JD, GC, JS, GL and APD: reviewing and editing the manuscript.
Funding statement
This study was funded by the Fondation Santé Outaouais.
Competing interests
NM received payments from the TechCare Research Lab during this research. Funds for the payments came from the Fondation Santé Outaouais (start-up fund for the TechCare Research Lab). JD received payments from the MITACS internship scholarship during this research. GC has no known financial or non-financial conflict of interest to disclose. JS has no known financial or non-financial conflict of interest to disclose. GL has no known financial or non-financial conflict of interest to disclose. APD’s institution, TechCare Research Lab (CISSS de l’Outaouais), received payments from the Fondation Santé Outaouais (start-up fund for the lab).
Statement regarding the use of AI
During the preparation of the manuscript, DeepL and ChatGPT were used to proofread the text. After the use of these tools, the text was reviewed and edited as needed.
Ethical standard
Ethical approval was granted by the Research Ethics Committee of the CISSS de l’Outaouais (Numbers 2025–207, 2024–429) and the Université du Québec en Outaouais (Number 2025–3647).
Consent to participate
Informed consent was obtained from all participants.