


1 Introduction
The fragmentation of particulate suspensions, i.e. the separation of liquids containing particles into disjoined droplets, is a generic phenomenon which is encountered in nature, e.g. vegetal spore dissemination (Ingold & Hadland Reference Ingold and Hadland1959), as well as in engineering applications, e.g. ink-jet printing (Hoath et al. Reference Hoath, Hsiao, Hutchings and Tuladhar2014), electro-hydrodynamic printing (Korkut, Saville & Aksay Reference Korkut, Saville and Aksay2008) and particle encapsulation (He Reference He2008). As for any regular liquid, drop separation ultimately proceeds through the pinch-off of a thread of material. A physical description of complex fragmentation processes of suspensions (as, e.g. exhibited in figure 1) thus requires the understanding of the dynamics of a single pinch-off event. This is precisely the motivation for the present work.
For a single-phase Newtonian liquid, while gravity may initiate the motion, the pinch-off is ultimately controlled by the liquid surface tension
 $\unicode[STIX]{x1D70E}$
. Close to the break-up singularity, the initial and boundary conditions become inconsequential and the only length scale is the thinning neck diameter of the thread,
 $h_{\mathit{min}}$
. The dynamics is then self-similar with respect to the time remaining until break-up,
 $t_{0}-t$
. Depending on the values of the Ohnesorge number that compares the viscous and inertial break-up time scales,
 $\mathit{Oh}=\unicode[STIX]{x1D702}_{0}/\sqrt{\unicode[STIX]{x1D70C}\unicode[STIX]{x1D70E}h_{0}}$
(where
 $\unicode[STIX]{x1D702}_{0}$
,
 $\unicode[STIX]{x1D70C}$
and
 $h_{0}$
are respectively the viscosity and density of the liquid and the initial diameter of the thread), different self-similar regimes emerge. For low
 $\mathit{Oh}$
, the dynamics is governed by inertia and continuously accelerates, according to
 $h_{\mathit{min}}\propto [\unicode[STIX]{x1D70E}(t_{0}-t)^{2}/\unicode[STIX]{x1D70C}]^{1/3}$
(Day, Hinch & Lister Reference Day, Hinch and Lister1998), until viscosity eventually regularises the velocity (Eggers Reference Eggers1993). For large
 $\mathit{Oh}$
, the dynamics is limited by viscosity. The minimum diameter,
 $h_{\mathit{min}}\propto \unicode[STIX]{x1D70E}(t_{0}-t)/\unicode[STIX]{x1D702}_{0}$
, thins at a constant rate typically equal to the capillary velocity (Papageorgiou Reference Papageorgiou1995). This self-similar dynamics proceeds until inertia eventually comes into play. This latter stage, which has been referred to as the inertial–viscous regime, also exhibits a constant-rate thinning, typically twice as slow as that of the viscous regime, and is expected to occur at a typical neck diameter
 $h_{\mathit{min}}\propto h_{0}\mathit{Oh}^{-3}$
(Eggers & Villermaux Reference Eggers and Villermaux2008). For practical purposes, a millimetre-sized thread with
 $\mathit{Oh}\gtrsim 10$
thus remains in the viscous regime over the whole observable range.
(a) An elongated thread of a viscous suspension of beads corrugates before it eventually fragments in disjoined drops. (b) Each break-up proceeds through the localised thinning of a neck connecting bulkier portions of the thread. The beads affect the flow in the pinching neck and distort the thread interface at their own scale
 $d$
.
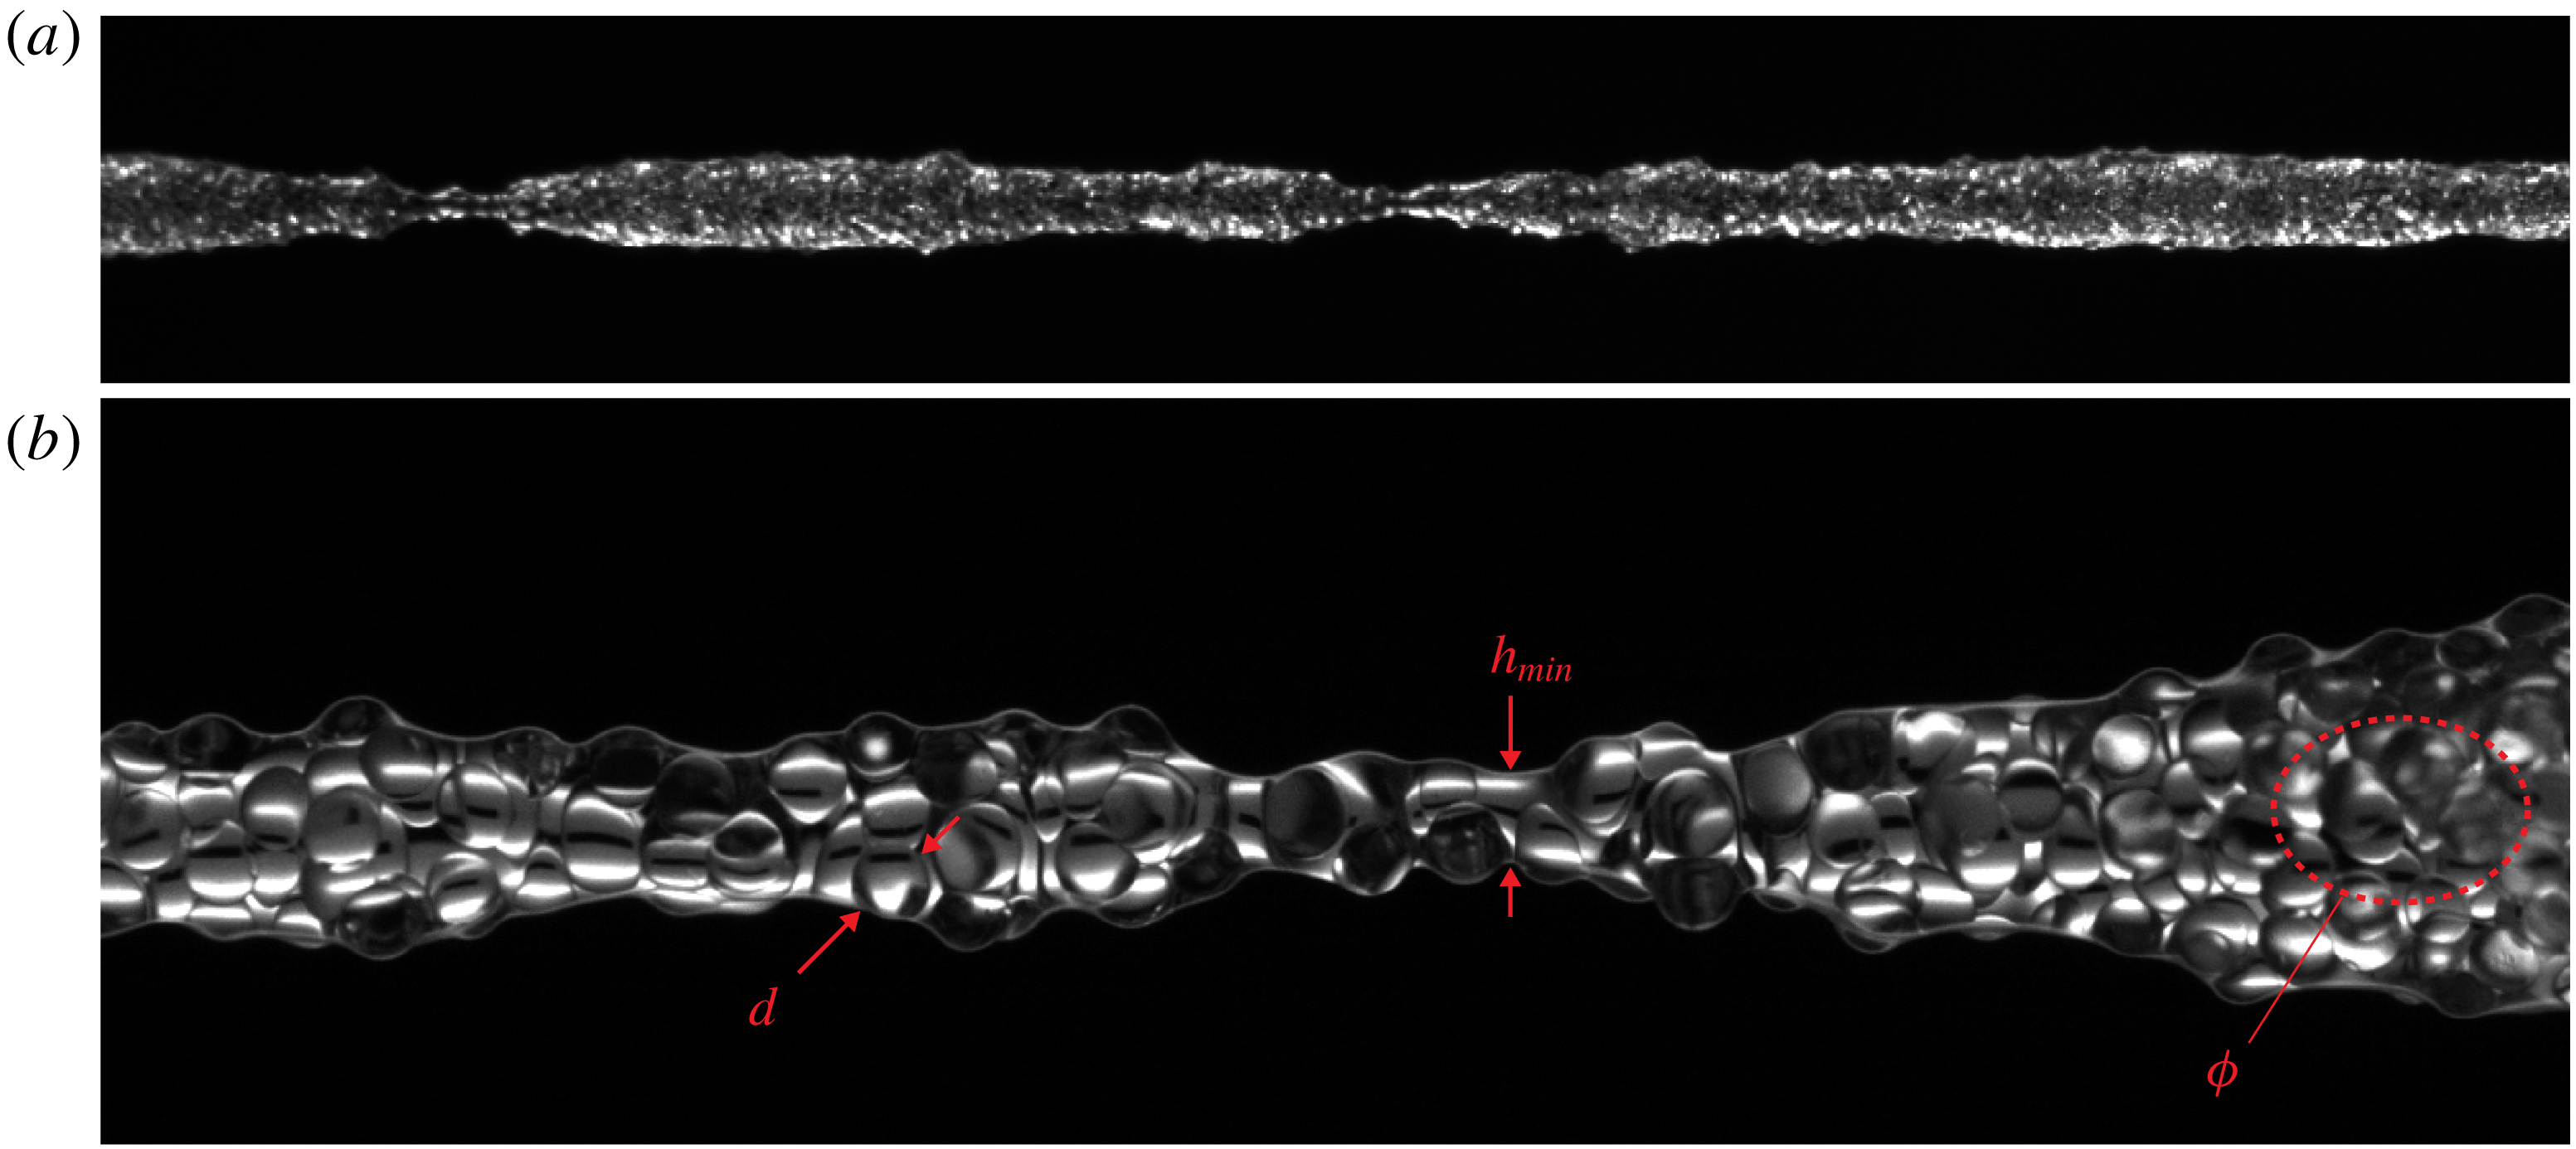
The situation is profoundly altered when particles are suspended in a liquid, i.e. in the case of a two-phase particulate suspension. As figure 1 illustrates, the solid particles introduce a new length scale, their diameter
 $d$
. They are also expected to affect the rheological properties such as the viscosity as well as the capillary pressure through respectively two new parameters, the particle volume fraction of the suspension,
 $\unicode[STIX]{x1D719}$
, and the wetting angle between the particles and the suspending fluid,
 $\unicode[STIX]{x1D703}$
. The pinch-off problem has been first addressed by Furbank & Morris (Reference Furbank and Morris2004, Reference Furbank and Morris2007) who examined the detachment of a drop of density-matched non-Brownian suspensions from a nozzle up to moderate concentrations (
 $0\leqslant \unicode[STIX]{x1D719}\leqslant 40\,\%$
). They identified an early stage ‘effective-fluid’ regime, where the suspension behaves as an effective Newtonian fluid, followed by an acceleration of the detachment dominated by discrete particle effects when the pinching localises. Bonnoit et al. (Reference Bonnoit, Bertrand, Clément and Lindner2012) continued with this approach by studying drop detachment at the transition between the viscous and inertial–viscous regimes. They recovered the initial ‘effective-fluid’ regime but found that it was followed by an intermediate ‘interstitial-fluid’ regime where the pinch-off dynamics became independent of
 $\unicode[STIX]{x1D719}$
(
 $0\leqslant \unicode[STIX]{x1D719}\leqslant 55\,\%$
) and was similar to that of the pure suspending liquid even though particles were present in the neck. Closer to the pinch-off, they reported a subsequent ‘accelerated’ regime where the thinning was faster than that of the pure interstitial fluid. Attention has also been drawn to the opposite limits of extremely dilute and extremely concentrated suspensions. van Deen et al. (Reference van Deen, Bertrand, Vu, Quéré, Clément and Lindner2013) documented dilute suspensions (
 $\unicode[STIX]{x1D719}\lesssim 5\,\%$
) where isolated particles hastened the detachment. Conversely, Miskin & Jaeger (Reference Miskin and Jaeger2012) reported the continuously accelerated pinch-off of an initially jammed suspension (
 $\unicode[STIX]{x1D719}\approx 60\,\%$
) which was attributed to an inertial effect despite the fact that
 $\mathit{Oh}$
could reach values larger than 10.
Besides pendant drops, the capillary break-up of an unstable liquid bridge has been considered by Mathues et al. (Reference Mathues, McIlroy, Harlen and Clasen2015) as more amenable to detailed experimental investigations. The underlying assumption was that the final stage of break-up would not significantly differ from that of a pendant drop. Mathues et al. (Reference Mathues, McIlroy, Harlen and Clasen2015) systematically studied the transition from the ‘effective-fluid’ to the ‘discrete-accelerated’ regimes (
 $2\,\%\leqslant \unicode[STIX]{x1D719}\leqslant 40\,\%$
) and did not observe the ‘interstitial-fluid regime’ reported by Bonnoit et al. (Reference Bonnoit, Bertrand, Clément and Lindner2012) for pendant drops. They attributed the acceleration of the thinning to an average decrease in the viscosity owing to the stochastic fluctuations of the actual particle volume fraction in the small neck volume (McIlroy & Harlen Reference McIlroy and Harlen2014). Their mechanism relies on the relative dependence of the bulk viscosity to small changes in
 $\unicode[STIX]{x1D719}$
, which is known to diverge at the maximum volume fraction of a flowing suspension,
 $\unicode[STIX]{x1D719}_{c}({\approx}0.58)$
. Interestingly, it suggests that discrete effects would dominate the whole pinch-off dynamics at large
 $\unicode[STIX]{x1D719}$
. However the stochastic fluctuations in
 $\unicode[STIX]{x1D719}$
invoked by McIlroy & Harlen (Reference McIlroy and Harlen2014) neglected particle interactions. They are therefore irrelevant to most suspensions (
 $\unicode[STIX]{x1D719}\gtrsim 10\,\%$
), where these interactions dominate the flow. More than anything else, the fate of large concentration suspensions is thus unclear.
It is also interesting to note the striking similarities of the accelerated and localised thinning of filaments of solid particulate suspensions with that of other non-Newtonian fluids. The pinching of shear-thinning liquids continuously accelerates and converges toward a double-cone shape at detachment (Doshi et al. Reference Doshi, Suryo, Yildirim, McKinley and Basaran2003). A similar behaviour is also observed for emulsions and foams (Huisman, Friedman & Taborek Reference Huisman, Friedman and Taborek2012). This localisation of the stretching has the dramatic consequence that the global tension in the thread (e.g. the weight of the pendant drop) eventually overcomes capillary stresses and prescribes the last instants of the pinch-off, as realised by Coussot & Gaulard (Reference Coussot and Gaulard2005) using yield-stress liquids. Such effects might also be significant for solid particulate suspensions.
To conclude on the existing literature regarding the pinch-off of suspension threads, while there is some evidence of an initial regime that can be described solely by effective-fluid arguments, the later stages of thinning and break-up are still elusive. The aim of the present work is to carry out extensive experiments to investigate the entire dynamics of the capillary thinning of non-Brownian suspensions consisting of neutrally buoyant and mono-disperse spherical particles suspended in a Newtonian liquid. We give special attention to the transition between the initial ‘effective-fluid regime’ and the final thinning regime. We also focus on the viscosity-controlled regime of break-up, i.e. the case of large
 $\mathit{Oh}$
. This viscous limit is practically relevant not only to viscous suspending fluids but also to most concentrated suspension threads owing to the significant increase in viscosity with increasing particle volume fraction. Indeed, at
 $\unicode[STIX]{x1D719}\simeq 50\,\%$
, even such a low viscosity suspending liquid as water yields
 $\mathit{Oh}\approx 1$
.
From dimensional analysis, the evolution of the neck diameter (normalised by the initial diameter
 $h_{0}$
) at given boundary conditions is found to be a function
 ${\mathcal{H}}$
of the dimensionless time and of four extra dimensionless parameters
 $$\begin{eqnarray}\frac{h_{\mathit{min}}}{h_{0}}={\mathcal{H}}\left(\frac{\unicode[STIX]{x1D70E}(t_{0}-t)}{\unicode[STIX]{x1D702}_{0}h_{0}},\mathit{Bo},\unicode[STIX]{x1D719},\frac{d}{h_{0}},\unicode[STIX]{x1D703}\right),\end{eqnarray}$$
where the Bond number,
 $\mathit{Bo}=\unicode[STIX]{x1D70C}gh_{0}^{2}/\unicode[STIX]{x1D70E}$
(where
 $g$
is the gravity), that measures the relative importance of surface tension and gravity forces, is the only relevant parameter for a single-phase viscous liquid. Our present goal is to determine the time scale of the pinch-off, the onset of its acceleration (relative to the effective-viscous-fluid regime), and its dependence on the suspension parameters
 $d$
,
 $\unicode[STIX]{x1D719}$
and
 $\unicode[STIX]{x1D703}$
(i.e. to determine the function
 ${\mathcal{H}}$
). We thus conduct experiments on an isolated pinch-off event while maintaining a fixed Bond number to observe the sole influence of
 $\unicode[STIX]{x1D719}$
,
 $d$
and
 $\unicode[STIX]{x1D703}$
. To that extent, we choose the configuration of an unstable capillary bridge formed by letting a pendant drop coalesce with a bath. This configuration which is detailed in § 2.2 is particularly interesting owing to its experimental amenability but also because it does not introduce any additional velocity in the problem unlike the pendant drop configuration. Together with choosing a sufficiently viscous suspending liquid, this ensures that, besides its time scale
 ${\sim}\unicode[STIX]{x1D702}_{0}h_{0}/\unicode[STIX]{x1D70E}$
, the overall dynamics does not depend upon the liquid viscosity. We also conduct additional investigations using a pendant drop in order to examine the influence of initial and boundary conditions on the pinch-off event. We focus on the semi-dilute to concentrated suspension range (
 $10\,\%\leqslant \unicode[STIX]{x1D719}\leqslant 52\,\%$
) for which particles are significantly interacting with each other but the suspension still flows.
The presentation of the study is as follows. Details of the experimental apparatus and procedure are given in § 2. The experimental results are presented in § 3. General observations and the two pinch-off regimes are first introduced in § 3.1. The detailed analysis of these successive regimes is then provided in §§ 3.2 and 3.3. Conclusions are drawn in § 4.
2 Experimental set-up
2.1 Particles and fluids
Different batches of smooth, mono-disperse, spherical, polystyrene particles (Dynoseeds TS manufactured by Microbeads) with density
 $\unicode[STIX]{x1D70C}=1050~\text{kg}~\text{m}^{-3}$
and diameters,
 $d$
, ranging from 10 to
 $550~\unicode[STIX]{x03BC}\text{m}$
were used in the experiments (the relative standard deviation in
 $d$
ranged from
 $1$
to 8 % (see table 1) and visual analysis of the particle surface indicated that the roughness was much smaller than the particle size).
The suspending fluids were chosen (i) to be sufficiently viscous to ensure a large
 $\mathit{Oh}$
over the whole range of
 $\unicode[STIX]{x1D719}$
and (ii) to match the density of the polystyrene spheres to avoid the sedimentation effect and to maintain a fixed
 $\mathit{Bo}$
, see table 2. In order to vary the wetting contact angle
 $\unicode[STIX]{x1D703}$
, two different Newtonian fluids were used (i) poly(ethylene glycol-ran-propylene glycol)-monobutyl-ether (PEG), a polymer melt with an average molecular weight of
 $3900~\text{g}~\text{mol}^{-1}$
, with surface tension
 $\unicode[STIX]{x1D70E}=36~\text{mN}~\text{m}^{-1}$
and viscosity
 $\unicode[STIX]{x1D702}_{0}=2.4~\text{Pa}~\text{s}$
and (ii) a 30.5 wt. % aqueous solution of Ucon oil, a commercial lubricant (Ucon 75-H, 90 000) composed of Polyalkylene glycol, with surface tension
 $\unicode[STIX]{x1D70E}=50.5~\text{mN}~\text{m}^{-1}$
and viscosity
 $\unicode[STIX]{x1D702}_{0}=130~\text{mPa}~\text{s}$
. The surface tensions and viscosities were measured by fitting the shape of static pendant drops and by using a rheometer (Anton Paar MCR 501) with a cone–plate geometry at the temperature of the experiments (
 $23\,^{\circ }\text{C}$
), respectively. The fluid viscosities were found to be constant over the whole range of applied shear rates (
 $10^{-2}$
–
 $10^{2}~\text{s}^{-1}$
) which covered the typical macroscopic shear rates
 $-{\dot{h}}_{\mathit{min}}/h_{\mathit{min}}$
of the pinch-offs with two additional higher decades. This insured that the suspending liquid could be considered as Newtonian, even in the case of concentrated suspensions where the local shear rate between the particle largely exceeds the applied macroscopic shear rate (Souzy et al.
Reference Souzy, Lhuissier, Villermaux and Metzger2017).
Most of the experiments were conducted with wetted particles, i.e. typically
 $\unicode[STIX]{x1D703}\lesssim 20^{\circ }$
as can be seen in table 1, using bare (i.e. as delivered) polystyrene beads suspended in PEG. Note that contact-angle measurements were not possible for particles smaller than
 $d=80~\unicode[STIX]{x03BC}\text{m}$
and the values of
 $\unicode[STIX]{x1D703}$
were assumed to be similar to those found for larger sizes since the beads are made with the same polystyrene material. It should be stressed that the addition of particles did not affect the surface tension as checked by measuring the shape of pendant suspension drops. Suspensions of partially non-wetting particles were also obtained by using polystyrene beads of size
 $d=80~\unicode[STIX]{x03BC}\text{m}$
coated with a silicon-based commercial waterproof spray (Trigano ‘imperméabilisant incolore’) suspended in the Ucon solution. This resulted in an averaged contact angle
 $\unicode[STIX]{x1D703}=82^{\circ }$
as measured at the meniscus of a single bead successively submersed and withdrawn from a pool of Ucon solution (the advancing and receding contact angles were
 $100^{\circ }$
and
 $64^{\circ }$
, respectively).
Particle characteristics.

Fluid characteristics.

A great care was taken in preparing the suspensions to avoid air entrapment in the highly viscous suspending fluids. For
 $d\leqslant 40~\unicode[STIX]{x03BC}\text{m}$
, the desired quantity of spheres were first mixed to the suspending fluid with a spatula in a beaker. The suspensions were then centrifuged at
 $2000g$
for one to two minutes to remove air bubbles without any detection of significant particle sedimentation or creaming. For
 $d>40~\unicode[STIX]{x03BC}\text{m}$
, the particles were gently deposited on the fluid interface and let there until they were completely soaked by the liquid. They were further mixed by slowly rotating the beaker at an angle. To immerse the partially non-wetting (coated) spheres in the Ucon solution, a more stringent protocol was designed. The spheres were first immersed in ethanol which completely wetted them before replacing the ethanol by the Ucon solution. To avoid any air trapping during the process, the beads together with a magnet were positioned in a syringe body the two openings of which were obstructed by grids to retain the particles within the syringe tube. Ethanol was first injected to immerse the spheres and a large quantity of Ucon solution was subsequently and slowly pushed through the syringe until all the ethanol was washed. The suspension was finally mixed with the help of the embedded magnet.
The two studied pinch-off configurations. (a,b) Pinch-off of an unstable capillary bridge formed by letting a pendant drop coalesce with a bath. (c,d) Pinch-off of a thread that is stretched behind a pending drop. The nozzle outer diameter is
 $h_{0}=4.39~\text{mm}$
in both cases and the suspensions consist of polystyrene spheres having a diameter
 $d=80~\unicode[STIX]{x03BC}\text{m}$
suspended in PEG at
 $\unicode[STIX]{x1D719}\approx 50\,\%$
).

The particle concentration was varied with
 $\unicode[STIX]{x1D719}$
ranging between
 $0$
and
 $52\,\%$
. For each
 $\unicode[STIX]{x1D719}$
, the suspension shear viscosity was measured with a rheometer (Anton Paar MCR 501) in the range of deformation rates
 $-{\dot{h}}_{\mathit{min}}/h_{\mathit{min}}$
imposed by the pinch-off dynamics. To avoid shear-induced migration during the measurements (Morris & Boulay Reference Morris and Boulay1999), a plate–plate configuration was chosen with wall roughness of the order of
 $d$
and gap size larger than
 $20\,d$
. For
 $0\leqslant \unicode[STIX]{x1D719}\leqslant 40\,\%$
, the shear viscosity was found to be shear rate independent. For
 $\unicode[STIX]{x1D719}\geqslant 45\,\%$
, a small, systematic, shear thinning was observed and was found to be independent of the shear history, of the cell geometry (plate–plate or cone–plate), of the particle size, of the wall roughness, and of whether a curved meniscus of suspension was let at the plate periphery or not. The magnitude of this shear thinning was found to increase with increasing
 $\unicode[STIX]{x1D719}$
and to reach a typical twofold decrease in viscosity over two decades of shear rate at
 $\unicode[STIX]{x1D719}=52\,\%$
. Similar shear-thinning behaviour has been previously reported for concentrated non-colloidal suspensions (Zarraga, Hill & Leighton Reference Zarraga, Hill and Leighton2000) and is not well understood.
2.2 Apparatus and procedure
Most of the pinch-off experiments were performed with an unstable capillary bridge configuration as shown in figure 2(a,b). They consisted in letting a pendant drop having a controlled size coalesce with a bath of the same suspension positioned below. The coalescence stretched the bridge which eventually pinched-off in a reproducible manner. This bridge configuration was selected because it confines the whole dynamics to the same region of space, thus facilitating the high-resolution observation of the late instants of the pinch-off. The coalescence-induced initiation of the dynamics was chosen because it naturally preserves the axial symmetry and does not introduce any additional velocity in the problem (for a viscous Newtonian liquid, the time scale of the coalescence evolves together with that of the pinch-off). The drop was slowly extruded with a syringe through a stainless steel nozzle with an outer diameter
 $h_{0}$
until it reached a static shape with a controlled height. Two different nozzles with
 $h_{0}=4.39~\text{mm}$
and
 $h_{0}=1~\text{mm}$
(and inner diameters of respectively 3.95 mm and 0.8 mm) were used. We checked that the volume fraction
 $\unicode[STIX]{x1D719}$
of the drop was identical to that of the initially mixed suspension within an accuracy of
 $1\,\%$
by weighting 10 test drops as well as the particles they contained. The flat horizontal surface of the suspension bath was subsequently approached with a precision translation stage until it touched the drop tip. To avoid Marangoni flows, both the bath and the drop were maintained at a constant temperature of
 $23\,^{\circ }\text{C}$
by air conditioning the laboratory room. This protocol ensured that the initial and boundary conditions were strictly identical between different realisations of the pinch-off and independent of
 $\unicode[STIX]{x1D719}$
.
(a) Snapshot of a pinching suspension capillary bridge (
 $h_{0}=4.39~$
mm,
 $\unicode[STIX]{x1D719}=48\,\%$
and
 $d=10~\unicode[STIX]{x03BC}\text{m}$
), see also the online supplementary movies available at https://doi.org/10.1017/jfm.2018.530. The bridge appears as black on the bright background. A red line highlights its contour. (b) Typical time evolution of the minimal diameter,
 $h_{\mathit{min}}$
, in which the break-up time,
 $t_{0}$
, is used as a temporal reference. The filled circles correspond to three realisations of the same experiment. The open circles represent the average over these three realisations. (c) Dimensionless evolution of
 $h_{\mathit{min}}$
for pure liquids (with viscosities
 $\unicode[STIX]{x1D702}_{0}$
ranging from 0.010 to 40 Pa s) showing the reference viscous dynamics reached in the limit of large Ohnesorge numbers (U
 $x$
stands for a
 $x\,\%$
wt aqueous solution of Ucon oil).

The pinch-off dynamics was imaged by a high-speed camera coupled to a macroscopic lens resulting in a spatial resolution up to
 $3~\unicode[STIX]{x03BC}\text{m}$
per pixel and a temporal resolution up to
 $330~\unicode[STIX]{x03BC}\text{s}$
. Illumination was provided by a bright background which shone only during the exposure time of the camera to avoid any heating of the threads. A typical shadowgraph produced by this imaging system is shown in figure 3(a). The successive images were analysed by standard image processing functions (thresholding of the grey level image and contour detection) in order to determine the contour as well as the minimal apparent diameter of the thread
 $h_{\mathit{min}}$
. For each suspension, experiments were repeated three times. Figure 3(b) shows typical evolutions of
 $h_{\mathit{min}}$
obtained from three realisations of the pinch-off for bare polystyrene particles of size
 $d=10~\unicode[STIX]{x03BC}\text{m}$
suspended in PEG at
 $\unicode[STIX]{x1D719}=48\,\%$
. The break-up time
 $t_{0}$
is used as a temporal reference. While the relative variations in
 $h_{\mathit{min}}$
for the three realisations are negligible for pure liquids, they were found to increase slightly for suspensions with increasing
 $\unicode[STIX]{x1D719}$
but always remained below 10 % for all the particle sizes that were used. In the following, we only report the value of
 $h_{\text{min}}$
obtained by averaging over three realisations.
In order to determine the influence of the suspension parameters on the dynamics, a viscous case of reference was needed. This was obtained by a calibration with pure liquids. Figure 3(c) shows the dimensionless time evolution of
 $h_{\mathit{min}}$
using the viscous scaling
 $\unicode[STIX]{x1D702}_{0}h_{0}/\unicode[STIX]{x1D70E}$
, for different liquids (PEG and from 10 to 100 %wt aqueous solutions of Ucon oil) with viscosity
 $\unicode[STIX]{x1D702}_{0}$
ranging from 0.010 to 40 Pa s. In the limit of large
 $\mathit{Oh}$
, the curves collapse onto a single master curve, that of the Stokes regime, within an accuracy of typically 10
 $\,\%$
due to the small variations in the surface tension, i.e. in Bond numbers between the different liquids. The curve obtained for pure PEG, which matches the Bond number of the suspensions, is taken as the reference curve for direct comparison with the PEG suspension experiments. It is important to stress that
 $\mathit{Oh}$
is always larger than 1. For pure PEG,
 $\mathit{Oh}\approx 10$
and therefore is larger when adding particles. The aqueous solution of Ucon oil has been only used for concentrated suspensions (
 $\unicode[STIX]{x1D719}=50\,\%$
), for which the Ohnesorge number based on the effective viscosity of the suspension is also of order 10.
Additional experiments were undertaken with a pendant drop configuration as shown in figures 2(c) and 2(d). These experiments were meant to determine whether the break-up dynamics differs between the two (dripping or bridge) configurations. Pendant drops of suspensions were extruded through the same nozzles as those used in the bridge experiments. Similar imaging and data analysis were used.
3 Results
3.1 General observations and regimes
3.1.1 General observations
Comparison of the pinch-off dynamics of a capillary bridge for (a) pure PEG and (b) a suspension of
 $80~\unicode[STIX]{x03BC}\text{m}$
beads dispersed in PEG at
 $\unicode[STIX]{x1D719}=50\,\%$
. The bridges in the two sequences have the same neck diameter in both the first image (i) and the penultimate image (iv) which immediately precedes break-up. In (a),
 $t_{0}-t=600$
, 100, 25, 0.66 and
 $-$
25 ms, from left to right respectively, while in (b), all of the durations are 60 times longer.

To illustrate how particles affect the pinch-off of a bridge, it is first insightful to compare the reference case of a pure viscous liquid to that of a suspension. Figure 4 shows the pinch-off dynamics for pure PEG and for a suspension of particles having a diameter
 $d=80~\unicode[STIX]{x03BC}\text{m}$
suspended in the same liquid at
 $\unicode[STIX]{x1D719}=50\,\%$
. The two bridges have the same minimal diameter in both the first (i) and the penultimate (iv) images, but the time intervals are 60 times larger for the suspension. This directly illustrates the first consequence of adding a large amount of particles to a viscous thread, which is simply to increase the time scale of the whole pinch-off process as previously noted by Furbank & Morris (Reference Furbank and Morris2004, Reference Furbank and Morris2007). In the present case, since the Bond number is unchanged by the presence of the particles and the particles are mostly wetted by the liquid, this suggests that the suspension behaves overall as an effective fluid which is more viscous than the pure liquid by the same factor of 60. However, besides slowing down the overall dynamics, particles also alter the shape of the bridge as pinch-off proceeds. Indeed, although both bridges have the same minimal diameter in the images (iv), the bridge is clearly less slender and the pinching is more localised for the suspension case. Similarly, it must be noted that the rates of thinning of the two bridges are not simply proportional to each other over the whole pinching process. Images (iii) and (iv) clearly evidence that, relatively to the overall time scales of the pinch-off, the thinning close to break-up is faster for the suspension than for the pure liquid.
Bridge shape as pinch-off proceeds, at the same values of the neck diameter
 $h_{\mathit{min}}=2$
, 0.6, and 0.15 mm, from top to bottom respectively. (a) Suspensions having the same particle size (
 $d=80~\unicode[STIX]{x03BC}\text{m}$
) but different particle volume fractions
 $\unicode[STIX]{x1D719}=20$
, 35 and
 $50\,\%$
from left to right respectively. (b) Suspensions having the same particle volume fraction (
 $\unicode[STIX]{x1D719}=35\,\%$
) but different particle sizes
 $d=10$
, 80 and
 $550~\unicode[STIX]{x03BC}\text{m}$
from left to right respectively. The leftmost sequences illustrate the pure liquid case.

More systematically, figure 5 illustrates how the main alterations to the bridge shape during the pinch-off depend on the parameters of the suspension, specifically
 $\unicode[STIX]{x1D719}$
and
 $d$
. Figure 5(a) compares the pinch-off process for a viscous liquid (
 $\unicode[STIX]{x1D719}=0\,\%$
) and for three suspensions of increasing volume fractions
 $\unicode[STIX]{x1D719}=20$
, 35 and 50
 $\,\%$
but having the same particle diameter
 $d=80~\unicode[STIX]{x03BC}\text{m}$
. For each case, the bridge is shown at the same three values of the neck diameter, namely
 $h_{\mathit{min}}=2$
, 0.6 and 0.15 mm. Initially, there is no noticeable difference in the shape of the bridge with respect to that of a pure viscous liquid. However, as the thinning of the neck proceeds, a systematic deviation occurs, which becomes stronger with decreasing
 $h_{\mathit{min}}$
and manifests earlier as
 $\unicode[STIX]{x1D719}$
is increased. For instance, at
 $h_{\mathit{min}}=0.15~\text{mm}$
, the pure liquid bridge is slender and almost cylindrical, whereas for
 $\unicode[STIX]{x1D719}\gtrsim 20\,\%$
the bridge becomes corrugated owing to the formation of aggregates of particles, and for
 $\unicode[STIX]{x1D719}=50\,\%$
the bridge adopts a double-cone shape, reminiscent of that reported for foams and emulsions (Huisman et al.
Reference Huisman, Friedman and Taborek2012). These alterations of the bridge shape manifest similarly for both smaller and larger particles, albeit for different values of
 $h_{\mathit{min}}$
. Figure 5(b) compares the case of particle diameters ranging from 10 to
 $550~\unicode[STIX]{x03BC}\text{m}$
for the same particle volume fraction
 $\unicode[STIX]{x1D719}=35\,\%$
. At
 $h_{\mathit{min}}=0.15~$
mm, the bridge shape is almost unaltered for
 $d=10~\unicode[STIX]{x03BC}\text{m}$
, whereas it is dramatically modified into a double-cone shape for
 $d=550~\unicode[STIX]{x03BC}\text{m}$
. At such moderate
 $\unicode[STIX]{x1D719}$
, the shape of the bridge is altered only once it has thinned down to a few particle sizes.
(a) Evolution of the neck diameter for suspensions of
 $10~\unicode[STIX]{x03BC}\text{m}$
beads dispersed in PEG at volume fractions ranging from 20 to 52 %. (b) Same data rescaled (and shifted by an arbitrary time
 $t_{1}$
) to match the reference dynamics of the pure liquid (
 $\unicode[STIX]{x1D719}=0\,\%$
) in the early stage of the pinch-off. For each
 $\unicode[STIX]{x1D719}$
, the rescaling defines the effective viscosity
 $\unicode[STIX]{x1D702}_{e}$
relative to that of the pure liquid.

3.1.2 The different regimes of pinching
As anticipated in the above description, these conspicuous alterations of the bridge shape directly impact the rate of thinning of the bridge. All the trends described above can therefore be quantified by just focusing on the time evolution of the minimal diameter of the bridge
 $h_{\mathit{min}}$
. This is illustrated in figure 6(a) for suspensions having the same diameter
 $d=10~\unicode[STIX]{x03BC}\text{m}$
but with
 $\unicode[STIX]{x1D719}$
ranging from 20 to
 $52\,\%$
. As already noticed, the duration of the pinch-off increases significantly (by two orders of magnitude) between the pure liquid and
 $\unicode[STIX]{x1D719}=52\,\%$
. The precise influence of the particle volume fraction is thus better appreciated by representing each pinch-off dynamics in its own time scale. This is performed in figure 6(b) by defining for each
 $\unicode[STIX]{x1D719}$
an effective viscosity,
 $$\begin{eqnarray}\unicode[STIX]{x1D702}_{e}\equiv \unicode[STIX]{x1D702}_{0}\frac{{\dot{h}}_{\mathit{min}}|_{\unicode[STIX]{x1D719}=0}}{{\dot{h}}_{\mathit{min}}},\end{eqnarray}$$
and using it to rescale the data (note that the slope
 ${\dot{h}}_{\mathit{min}}$
is obtained by averaging data over
 $h_{\mathit{min}}>0.2h_{0}$
). This definition simply stems from extending the prediction of the neck thinning rate of a pure liquid at large
 $\mathit{Oh}$
(i.e.
 ${\dot{h}}_{\mathit{min}}|_{\unicode[STIX]{x1D719}=0}\propto {\mathcal{H}}(\mathit{Bo})\,\unicode[STIX]{x1D70E}/\unicode[STIX]{x1D702}_{0}$
) to the suspension case (i.e.
 ${\dot{h}}_{\mathit{min}}\propto {\mathcal{H}}(\mathit{Bo})\,\unicode[STIX]{x1D70E}/\unicode[STIX]{x1D702}_{e}$
) while keeping in mind that, in the present case, both
 $\unicode[STIX]{x1D70E}$
and
 $\mathit{Bo}$
are independent of
 $\unicode[STIX]{x1D719}$
. By rescaling the dynamics for each
 $\unicode[STIX]{x1D719}$
with this effective viscosity, a good collapse onto the pure liquid curve can be obtained at the beginning of the pinch-off process (starting at
 $h_{\mathit{min}}\gtrsim 2~\text{mm}$
), as shown in figure 6(b). However, at lower values of
 $h_{\mathit{min}}$
, systematic deviations are observed as the suspension thinning significantly accelerates compared to that of the pure liquid.
(a–c) Time evolution of the neck diameter for different particle sizes and particle volume fractions: (a)
 $\unicode[STIX]{x1D719}=20\,\%$
, (b)
 $\unicode[STIX]{x1D719}=35\,\%$
and (c)
 $\unicode[STIX]{x1D719}=50\,\%$
. The insets in (b) and (c) are blow-ups and define (for
 $d=40~\unicode[STIX]{x03BC}\text{m}$
) the two deviation onset diameters,
 $h^{\prime }$
and
 $h^{\ast }$
, at which the thinning deviates from the Newtonian case, and at which particle size effects are observed, respectively. The open triangles represent the reference case of a pure viscous liquid. (d) Neck diameter at the onset of the deviations for the different curves shown in (c).
 $h^{\prime }$
and
 $h^{\ast }$
only differ from each other for sufficiently small particle sizes and large volume fractions.

Before analysing quantitatively the pinch-off dynamics, it is crucial to characterise these deviations. Figure 7 shows the evolution of
 $h_{\mathit{min}}$
with increasing
 $d$
for three particle volume fractions,
 $\unicode[STIX]{x1D719}=20$
, 35 and
 $50\,\%$
, as well as for the viscous reference case (
 $\unicode[STIX]{x1D719}=0$
). The general trend is that, as the particle size increases, the deviation occurs earlier, i.e. the neck diameter at which the thinning accelerates becomes larger. This is clearly seen for
 $\unicode[STIX]{x1D719}=20\,\%$
and
 $\unicode[STIX]{x1D719}=35\,\%$
for which the deviation occurs at a neck diameter
 $h^{\ast }$
which increases with increasing
 $d$
. However, for
 $\unicode[STIX]{x1D719}=50\,\%$
, while a deviation onset which depends on
 $d$
is recovered for the largest diameter explored (
 $d=135~\unicode[STIX]{x03BC}\text{m}$
), a different behaviour is observed for smaller
 $d$
. For
 $d<135~\unicode[STIX]{x03BC}\text{m}$
, the suspension dynamics starts to depart from that of the pure viscous liquid at a value of the neck diameter, noted
 $h^{\prime }$
, which is independent of
 $d$
, before a further deviation from this latter curve at the neck diameter
 $h^{\ast }$
which depends on
 $d$
, as seen in the inset of figure 7(c). This means that at large
 $\unicode[STIX]{x1D719}$
and smaller
 $d$
, the departure from the viscous case first occurs at a neck diameter
 $h^{\prime }$
which differs from the diameter
 $h^{\ast }$
. This unexpected observation is evidenced in figure 7(d) for
 $\unicode[STIX]{x1D719}=50\,\%$
. For
 $d\leqslant 80~\unicode[STIX]{x03BC}\text{m}$
, the onset of the deviation from the liquid reference case is constant at
 $h^{\prime }\approx 0.18h_{0}$
, whereas the onset of deviation from this already deviated curve,
 $h^{\ast }$
, increases systematically with
 $d$
. For
 $d>80~\unicode[STIX]{x03BC}\text{m}$
, the
 $d$
-dependence dominates and
 $h^{\prime }$
and
 $h^{\ast }$
cannot be distinguished.
These distinct behaviours in the evolution of
 $h_{\mathit{min}}$
yields to the definition of two successive regimes which will be studied separately in the two next sections:
(i) an effective-viscous-fluid regime in the early stage of the pinch-off, in which the dynamics is independent of the particle size and the suspension behaves as an effective viscous fluid, albeit pseudo-Newtonian (see § 3.2),
(ii) a subsequent discrete regime in the late stage of the pinch-off, in which the dynamics depends on the particle size and the thinning rate significantly increases (see § 3.3).
3.2 Effective-viscous-fluid regime
In the effective-viscous-fluid regime, the neck thinning dynamics of the suspension is similar to that of a pure viscous liquid: the particles do not deform significantly the interface and, in the present case of neutrally buoyant particles, no sedimentation or creaming is anticipated. This regime is thus entirely characterised by an effective viscosity of the suspension,
 $\unicode[STIX]{x1D702}_{e}$
, that can be inferred using (3.1). However, as discussed above, for large
 $\unicode[STIX]{x1D719}$
, two different rates of thinning are successively measured, respectively above and below
 $h^{\prime }\simeq 0.18\,h_{0}$
. While the effective regime has been reported in the literature (Furbank & Morris Reference Furbank and Morris2004, Reference Furbank and Morris2007), this latter behaviour for a concentrated suspension has not been documented.
3.2.1 Case
 $h_{\mathit{min}}>h^{\prime }$

We first focus on the range
 $h_{\mathit{min}}>h^{\prime }$
, since an effective-viscous-fluid regime can be observed for all the particle volume fractions and all the particle sizes in that case. The effective viscosity
 $\unicode[STIX]{x1D702}_{e}$
measured over this range and normalised by that of the suspending liquid
 $\unicode[STIX]{x1D702}_{0}$
is shown in figure 8(a) as a function of
 $\unicode[STIX]{x1D719}$
for different
 $d$
. The collapse of the data for
 $10~\unicode[STIX]{x03BC}\text{m}$
 ${\leqslant}d\leqslant 550~\unicode[STIX]{x03BC}\text{m}$
shows that there is no dependence on particle size and thus assesses that the suspension can be seen as a continuum. The effective viscosity
 $\unicode[STIX]{x1D702}_{e}/\unicode[STIX]{x1D702}_{0}$
increases with increasing
 $\unicode[STIX]{x1D719}$
and seems to diverge at a critical particle volume fraction
 $\unicode[STIX]{x1D719}_{c}\simeq 54\,\%$
. This value of
 $\unicode[STIX]{x1D719}_{c}$
is somehow smaller than that (
 $\unicode[STIX]{x1D719}_{c}\simeq 58-62\,\%$
) usually reported for non-Brownian suspensions (see e.g. Zarraga et al.
Reference Zarraga, Hill and Leighton2000; Boyer, Guazzelli & Pouliquen Reference Boyer, Guazzelli and Pouliquen2011a
) but happens to be similar to that observed by Blanc, Peters & Lemaire (Reference Blanc, Peters and Lemaire2011) for
 $30~\unicode[STIX]{x03BC}\text{m}$
particles in a different Newtonian suspending liquid.
(a) Relative effective viscosity
 $\unicode[STIX]{x1D702}_{e}/\unicode[STIX]{x1D702}_{0}$
versus
 $\unicode[STIX]{x1D719}$
during the early stage of the pinch-off (
 $h_{\mathit{min}}>h^{\prime }\simeq 0.18\,h_{0}$
) for different diameter
 $d$
, nozzle diameter
 $h_{0}$
, contact angle
 $\unicode[STIX]{x1D703}$
and for the (PDC) pendant drop configuration. Unless otherwise specified,
 $d=80~\unicode[STIX]{x03BC}\text{m}$
,
 $h_{0}=4.39~\text{mm}$
,
 $\unicode[STIX]{x1D703}\approx 0^{\circ }$
and the configuration is that of a capillary bridge. (b) Relative effective viscosity
 $\unicode[STIX]{x1D702}_{e}/\unicode[STIX]{x1D702}_{0}$
and relative shear viscosity
 $\unicode[STIX]{x1D702}_{s}/\unicode[STIX]{x1D702}_{0}$
versus
 $\unicode[STIX]{x1D719}$
for
 $d=10~\unicode[STIX]{x03BC}\text{m}$
. The shear viscosity
 $\unicode[STIX]{x1D702}_{s}$
is measured independently with a cone–plate rheometer at a typical shear rate
 ${\approx}-{\dot{h}}_{\mathit{min}}/h_{\mathit{min}}$
. The three lines represent the correlations of (KD) Krieger–Dougherty,
 $\unicode[STIX]{x1D702}_{s}/\unicode[STIX]{x1D702}_{0}=[\unicode[STIX]{x1D719}_{c}/(\unicode[STIX]{x1D719}_{c}-\unicode[STIX]{x1D719})]^{5\unicode[STIX]{x1D719}_{c}/2}$
, of (E) Eilers,
 $\unicode[STIX]{x1D702}_{s}/\unicode[STIX]{x1D702}_{0}=[1+(5/4)\unicode[STIX]{x1D719}_{c}\unicode[STIX]{x1D719}/(\unicode[STIX]{x1D719}_{c}-\unicode[STIX]{x1D719})]^{2}$
, and of (BGP) Boyer et al.,
 $\unicode[STIX]{x1D702}_{s}/\unicode[STIX]{x1D702}_{0}=1+(5/2)\unicode[STIX]{x1D719}_{c}\unicode[STIX]{x1D719}/(\unicode[STIX]{x1D719}_{c}-\unicode[STIX]{x1D719})+\unicode[STIX]{x1D707}^{c}(\unicode[STIX]{x1D719})[\unicode[STIX]{x1D719}/(\unicode[STIX]{x1D719}_{c}-\unicode[STIX]{x1D719})]^{2}$
with the contact contribution
 $\unicode[STIX]{x1D707}^{c}(\unicode[STIX]{x1D719})$
varying in the range 0.3–0.7, and with
 $\unicode[STIX]{x1D719}_{c}=54\,\%$
.

The effective viscosity
 $\unicode[STIX]{x1D702}_{e}$
is not significantly altered when the particles are coated, i.e. by varying their wetting contact angle
 $\unicode[STIX]{x1D703}$
from typically
 $0^{\circ }$
to typically
 $90^{\circ }$
(see table 1). This shows that the effective surface tension which drives the dynamics is unaffected by the presence of small partially non-wetted particles in the range of
 $\unicode[STIX]{x1D719}$
examined. This is also consistent with the direct observation that the static shape of the pending drop used to form the bridge is unaffected by these particles. This means that, even during the first stage of the pinch-off when the bridge interfacial area begins to shrink, the mean curvature of the interface is not overall affected by the presence of small partially non-wetted particles. Same values of
 $\unicode[STIX]{x1D702}_{e}$
are also measured using a smaller nozzle diameter (
 $h_{0}=0.8~\text{mm}$
) and a different pinch-off configuration, namely that of a pending drop detaching from a nozzle. This shows that the early pinch-off dynamics only depends on the particle volume fraction
 $\unicode[STIX]{x1D719}$
and is independent of the other parameters investigated (
 $d$
,
 $\unicode[STIX]{x1D703}$
,
 $h_{0}$
) and of the pinch-off configuration. This clearly evidences that, in this regime, the suspension can be seen as a bulk and continuum medium.
The effective viscosity
 $\unicode[STIX]{x1D702}_{e}$
measured during the early stage of pinch-off is also compared in figure 8(b) to measurements of the shear viscosity
 $\unicode[STIX]{x1D702}_{s}$
of the same suspensions performed with a plate–plate rheometer. These two viscosities increase similarly with increasing
 $\unicode[STIX]{x1D719}$
and present the same divergence (within less than
 $1\,\%$
) at the same critical value
 $\unicode[STIX]{x1D719}_{c}\approx 54\,\%$
. These experimental data coming from two different types of measurements are found to be in good agreement with the classical correlation of Eilers (see e.g. Stickel & Powell Reference Stickel and Powell2005) as well as that of Boyer et al. (Reference Boyer, Guazzelli and Pouliquen2011a
). They both present a divergence which scales as
 ${\sim}(\unicode[STIX]{x1D719}_{c}-\unicode[STIX]{x1D719})^{-2}$
near the critical value
 $\unicode[STIX]{x1D719}_{c}\approx 54\,\%$
above which the suspension is unable to flow.
3.2.2 Case
$h_{\mathit{min}}<h^{\prime }$

In the late stage of pinch-off (
 $h_{\mathit{min}}<h^{\prime }$
), a different effective-viscous-fluid regime can be observed for dense suspensions. This regime is seen when it is not screened by finite-size effects that dominate the later stage of the pinch-off. This implies that the particles should be much smaller than the nozzle size
 $h_{0}$
. The focus in this section is therefore on the experiments with the smallest particles. In this case, for
 $\unicode[STIX]{x1D719}\gtrsim 35\,\%$
, the dynamics departs from that of the pure liquid at a constant neck diameter
 $h^{\prime }\simeq 0.18\,h_{0}$
. For
 $h_{\mathit{min}}<h^{\prime }$
, the neck thinning rate adopts a constant value which differs from that observed for
 $h_{\mathit{min}}>h^{\prime }$
(discussed in the preceding section) until finite-size effects eventually dominate for a much thinner neck. As shown in the inset of figure 7(c), this dynamics observed for
 $h_{\mathit{min}}<h^{\prime }$
does not depend upon
 $d$
. The suspension still behaves as an effective fluid. However, although the shape of the capillary bridge is essentially not modified in this regime until
 $h_{\mathit{min}}$
has reached
 $h^{\ast }$
(as evidenced in figures 5 and 9
b), it is rather delicate to infer a quantitative measurement of some effective viscosity from the sole value of
 $h_{\mathit{min}}$
once a deviation from the pure liquid viscous case has occurred. We thus characterise this regime through the ratio
 $\unicode[STIX]{x1D6FC}\equiv \unicode[STIX]{x1D702}_{\text{e}}|_{h^{\ast }<h_{\mathit{min}}<h^{\prime }}/\unicode[STIX]{x1D702}_{\text{e}}|_{h_{\mathit{min}}>h^{\prime }}$
, with
 $\unicode[STIX]{x1D702}_{\text{e}}$
defined as in (3.1), which represents the change in the pinching rate relative to its value for
 $h_{\mathit{min}}>h^{\prime }$
. If the flow remains uniformly a Newtonian Stokes flow below
 $h^{\prime }$
, the ratio
 $\unicode[STIX]{x1D6FC}$
precisely measures the relative change in the effective viscosity around
 $h^{\prime }$
. More generally, it only qualitatively reflects the change in the effective viscosity at the neck.
(a) Ratio
 $\unicode[STIX]{x1D6FC}$
of the pinching rates after and before
 $h_{\mathit{min}}=h^{\prime }$
(see text). (b) Bridge aspect ratio
 $l/h_{\mathit{min}}$
versus
 $h_{\mathit{min}}/h_{0}$
for suspensions at
 $\unicode[STIX]{x1D719}=50\,\%$
and for the viscous liquid reference. The inset defines the typical length
 $l$
over which the bridge diameter varies. The solid line shows the prediction for the self-similar shape evolution in a viscous extensional flow,
 $l/h_{\mathit{min}}\sim (h_{\mathit{min}}/h_{0})^{\unicode[STIX]{x1D6FD}-1}$
with
 $\unicode[STIX]{x1D6FD}\simeq 0.175$
(Papageorgiou Reference Papageorgiou1995). The vertical lines show the value of
 $h^{\ast }$
for each particle size (dashed) and of
 $h^{\prime }$
(thin solid).

The thinning rate ratio
 $\unicode[STIX]{x1D6FC}$
is shown in figure 9(a) for increasing
 $\unicode[STIX]{x1D719}$
. While it is equal to 1 for
 $\unicode[STIX]{x1D719}\lesssim 35\,\%$
, it becomes progressively smaller for larger
 $\unicode[STIX]{x1D719}$
until it has decreased by typically one half at the largest
 $\unicode[STIX]{x1D719}$
explored (
 $\unicode[STIX]{x1D719}=52\,\%$
). This indicates that the effective viscosity is unchanged around
 $h_{\mathit{min}}=h^{\prime }$
as long as
 $\unicode[STIX]{x1D719}\lesssim 35\,\%$
, and suggests that for larger
 $\unicode[STIX]{x1D719}$
the effective viscosity decreases when
 $h_{\mathit{min}}$
becomes smaller than
 $h^{\prime }$
.
Some insights into this evolution of the effective viscosity can be obtained by examining the bridge shape around the transition between the two effective-viscous-fluid regimes. Figure 9(b) shows the evolution of the bridge aspect ratio
 $l/h_{\mathit{min}}$
as the neck is thinning down, i.e. as
 $h_{\mathit{min}}/h_{0}$
decreases. The axial elongation of the bridge
 $l$
has been defined as the distance between two bridge cross-sections having a diameter of
 $1.25\,h_{\mathit{min}}$
(the evolution of
 $l$
is independent of the precise value adopted for the pre-factor), as depicted in the inset of figure 9(b). For the reference pure liquid, the aspect ratio,
 $l/h_{\mathit{min}}$
, becomes significantly larger than one and follows the prediction for the self-similar shape evolution in a viscous extensional flow [
 $l/h_{\mathit{min}}\sim (h_{\mathit{min}}/h_{0})^{\unicode[STIX]{x1D6FD}-1}$
with
 $\unicode[STIX]{x1D6FD}\simeq 0.175$
(Papageorgiou Reference Papageorgiou1995)] when
 $h_{\mathit{min}}$
becomes smaller than a value very close to that of
 $h^{\prime }(\simeq 0.18\,h_{0})$
. For the suspensions, this large aspect ratio as well as its self-similar evolution are recovered for
 $h^{\ast }\lesssim h_{\mathit{min}}\lesssim h^{\prime }$
.
The value of this aspect ratio has a direct impact on the nature of the flow inside the bridge. For a large aspect ratio, the flow can be considered as essentially extensional. For an aspect ratio of order one, it is more complex and contains a significant portion of pure shear. While the influence of the flow type does not affect the rheological response of a Newtonian fluid such as the present reference pure fluid (PEG), it may have an effect on the response of a suspension as the microstructure built by the particles is flow dependent (see e.g. Morris Reference Morris2009). The ratio
 $\unicode[STIX]{x1D6FC}$
could therefore reflect the effective viscosity difference between the two flow types. Figure 9(a) suggests that the effective viscosity is lower in the late extensional flow stage than in the early complex flow stage of the pinch-off for
 $\unicode[STIX]{x1D719}\gtrsim 40\,\%$
. The fact that the difference in viscosities becomes significant above
 $\unicode[STIX]{x1D719}\approx 40\,\%$
may be an additional indication of non-Newtonian effects as for these large
 $\unicode[STIX]{x1D719}$
normal stress differences happen to be detectable in pure shear flow configurations (Zarraga et al.
Reference Zarraga, Hill and Leighton2000; Boyer, Pouliquen & Guazzelli Reference Boyer, Pouliquen and Guazzelli2011b
; Gallier et al.
Reference Gallier, Lemaire, Peters and Lobry2014). It should also be stressed that the slight shear-thinning behaviour mentioned in § 2.2 is also expected to reduce the viscosity as the pinching proceeds and the rate of deformation increases.
Nonetheless, the difference between these two viscosities is not large (a factor of at most two at the largest
 $\unicode[STIX]{x1D719}$
explored), both of them are similar to the steady shear viscosity measured with a cone–plate rheometer, as evidenced in figure 8(b). This suggests that, for a suspension, the shear stresses in the complex non-steady and partly extensional flow in the neck of the bridge do not differ in order of magnitude from those developing in a steady pure shear flow with the same rate of deformation. This may indicate that non-Newtonian normal stresses (which never exceed the shear stress in a purely sheared suspension) do not dominate the extensional rheology of the suspension (in contrast with e.g. dilute polymer solutions at large Deborah numbers for which the Trouton ratio can exceed
 $10^{3}$
, McKinley & Sridhar Reference McKinley and Sridhar2002). This observation is consistent with numerical results suggesting that different types of suspensions
 $-$
contactless Brownian particles (Sami Reference Sami1996), frictional and frictionless non-Brownian particles (Seto, Giusteri & Martiniello Reference Seto, Giusteri and Martiniello2017; Cheal & Ness Reference Cheal and Ness2018)
 $-$
have a Trouton ratio which is close to that of a Newtonian liquid, except maybe very close to
 $\unicode[STIX]{x1D719}_{c}$
(Cheal & Ness Reference Cheal and Ness2018).
3.3 Discrete regime
In the last stage of the pinch-off, the thinning dynamics accelerates significantly and becomes driven by the discrete nature of the suspension, as previously noted by Furbank & Morris (Reference Furbank and Morris2004), Bonnoit et al. (Reference Bonnoit, Bertrand, Clément and Lindner2012) and Mathues et al. (Reference Mathues, McIlroy, Harlen and Clasen2015). Figure 10(a) shows this last thinning stage for a suspension with
 $d=10~\unicode[STIX]{x03BC}\text{m}$
. In order to resolve smaller values of
 $h_{\mathit{min}}$
, the data were obtained with a larger optical magnification and a shorter time resolution than in figure 6 (same values are obtained over the common range of observation). The actual difference with figure 6 is that the time is now rescaled by
 $\unicode[STIX]{x1D6FC}\unicode[STIX]{x1D702}_{e}$
instead of
 $\unicode[STIX]{x1D702}_{e}$
. This provides a better presentation of the finite-size effects, in particular at large
 $\unicode[STIX]{x1D719}$
where the two thinning rates differ from each other.
(a) Time evolution of the neck diameter in the last stage of the pinch-off for a suspension having
 $d=10~\unicode[STIX]{x03BC}\text{m}$
. The inset defines the terminal thinning rate of the neck
 ${\dot{h}}_{\mathit{min}}|_{h_{\mathit{min}}\approx d}$
as well as the time
 $t^{\ast }$
and the neck diameter
 $h^{\ast }\equiv h_{\mathit{min}}(t^{\ast })$
at the onset of the departure from the effective-viscous-fluid curve. (b) Terminal thinning rate measured at
 $h_{\mathit{min}}\approx d$
(filled circles). The horizontal line shows the thinning rate of the pure suspending liquid. For comparison, the open triangles represent the rate of thinning in the effective-viscous-fluid regime (
 $h_{\mathit{min}}>h^{\prime }$
).

The very last instants of the pinch-off are first considered. Figure 10(b) presents the terminal thinning rate of the bridge, i.e. the value of
 ${\dot{h}}_{\mathit{min}}$
measured at
 $h_{\mathit{min}}\approx d$
. Over the whole range of
 $\unicode[STIX]{x1D719}$
explored, this value is equal to the thinning rate of the pure suspending liquid within a factor two. This factor has to be compared with the
 $10^{3}$
times slower rate observed prior to this acceleration for the largest
 $\unicode[STIX]{x1D719}$
in the effective-viscous-fluid regime. We therefore recover that the terminal pinching rate is dictated by the pure interstitial fluid, as anticipated by Furbank & Morris (Reference Furbank and Morris2007) and reported by Bonnoit et al. (Reference Bonnoit, Bertrand, Clément and Lindner2012) and Mathues et al. (Reference Mathues, McIlroy, Harlen and Clasen2015).
We then turn to the examination of the onset of the thinning acceleration. We choose to characterise it by the diameter
 $h^{\ast }$
at which the thinning rate
 $|{\dot{h}}_{\mathit{min}}|$
has increased by
 $30\,\%$
from its constant value prior to the acceleration (we checked that the value of
 $h^{\ast }$
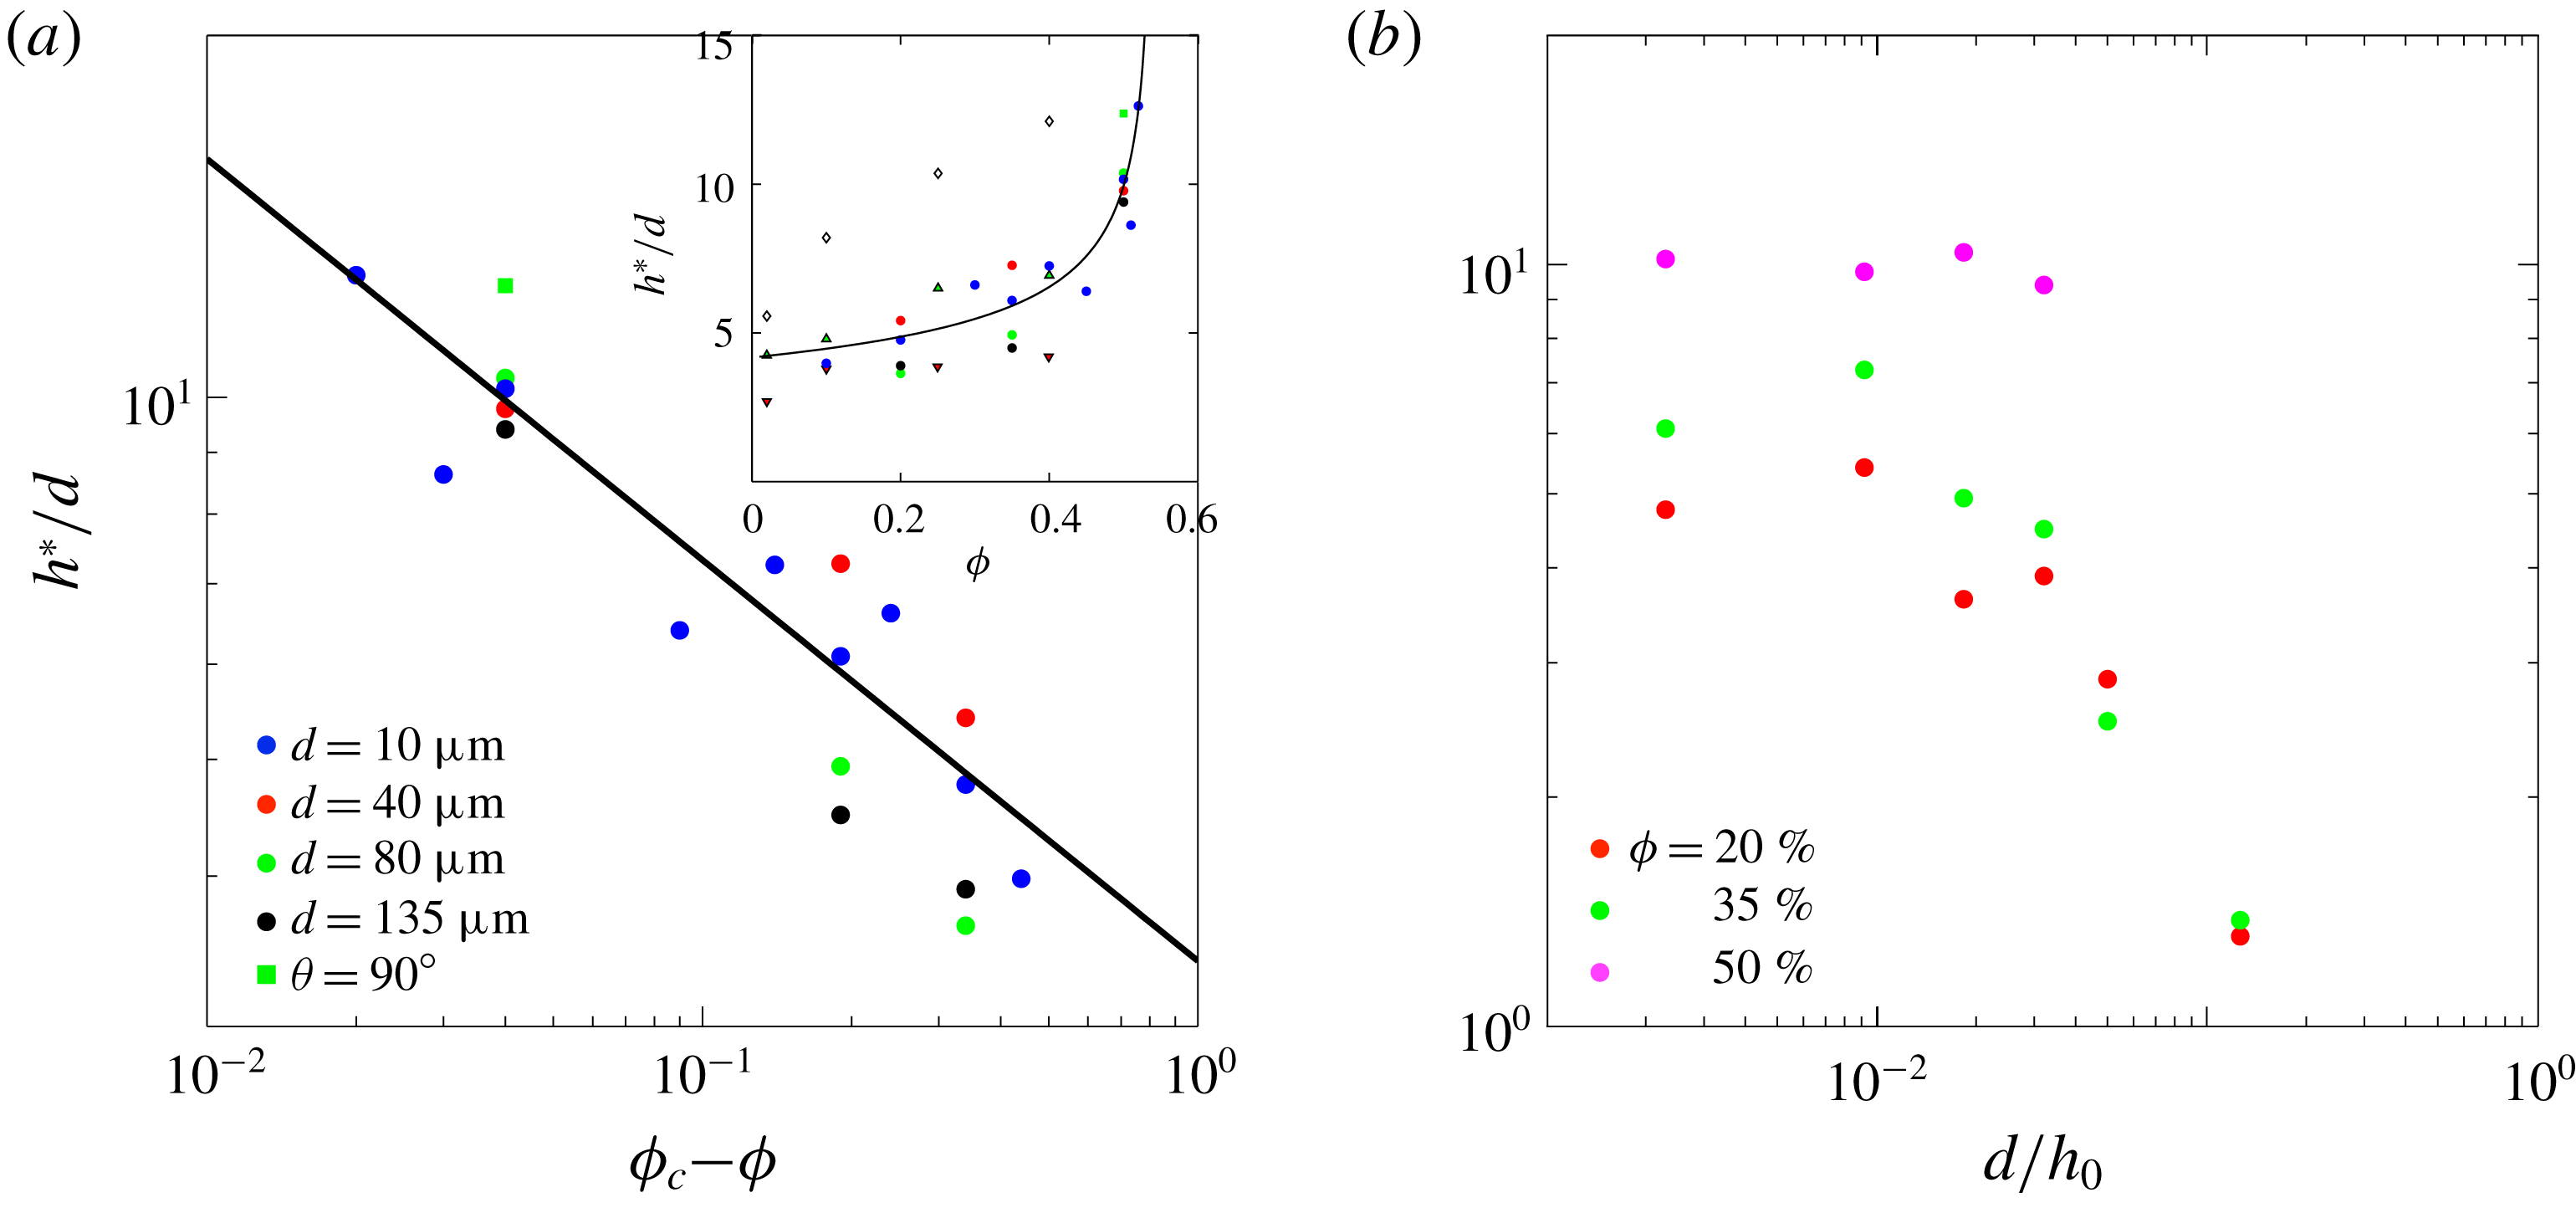
is not sensitive to the precise value of the criterion), see the inset of figure 10(a). Figure 11(a) presents the variation with
 $\unicode[STIX]{x1D719}$
of the onset diameter
 $h^{\ast }$
made dimensionless by
 $d$
, for particle diameters ranging from 10 to
 $135~\unicode[STIX]{x03BC}\text{m}$
. The inset graph of this figure shows that all the data, including those for the coated particles (
 $\unicode[STIX]{x1D703}\simeq 90^{\circ }$
), collapse approximately on the same curve. Note that the data of Mathues et al. (Reference Mathues, McIlroy, Harlen and Clasen2015) for polystyrene particles also collapse on this curve. Their smallest (3
 $\unicode[STIX]{x03BC}\text{m}$
PMMA) particles however deviate from this general behaviour, which may be due to colloidal forces as suggested by Mathues et al. (Reference Mathues, McIlroy, Harlen and Clasen2015).
This collapse indicates that
 $h^{\ast }$
is linear in
 $d$
(in this range of
 $d$
) and increases monotonically with increasing
 $\unicode[STIX]{x1D719}$
(in the range of
 $\unicode[STIX]{x1D719}$
investigated). The increase becomes steeper for increasing
 $\unicode[STIX]{x1D719}$
and suggests a weak algebraic divergence at the jamming point,
 $h^{\ast }/d\sim (\unicode[STIX]{x1D719}_{c}-\unicode[STIX]{x1D719})^{-1/3}$
, as evidenced in the main graph of figure10(a).
(a) Neck diameter at the onset of the discrete regime,
 $h^{\ast }$
, as a function of
 $\unicode[STIX]{x1D719}_{\text{c}}-\unicode[STIX]{x1D719}$
for
 $d$
ranging from 10 to
 $135~\unicode[STIX]{x03BC}\text{m}$
. The green squares (
 $\unicode[STIX]{x1D703}=90^{\circ }$
) correspond to the coated
 $80~\unicode[STIX]{x03BC}\text{m}$
spheres. The line shows
 $h^{\ast }/d\sim (\unicode[STIX]{x1D719}_{c}-\unicode[STIX]{x1D719})^{-1/3}$
. The inset displays the same data versus
 $\unicode[STIX]{x1D719}$
together with those extracted from figure 8 of Mathues et al. (Reference Mathues, McIlroy, Harlen and Clasen2015) (
 $3\,\unicode[STIX]{x03BC}\text{m}$
PMMA particles
 $\diamond$
,
 $10\,\unicode[STIX]{x03BC}\text{m}$
polystyrene particles
 ${\vartriangle}$
,
 $20\,\unicode[STIX]{x03BC}\text{m}$
polystyrene particles
 $\triangledown$
). (b) Neck diameter
 $h^{\ast }$
as a function of
 $d$
up to
 $d=550~\unicode[STIX]{x03BC}\text{m}$
for three different particle volume fractions.
This weak divergence at jamming does not agree with the stochastic prediction (
 $=0.65\,\unicode[STIX]{x1D719}^{-1/3}(\unicode[STIX]{x1D719}_{c}-\unicode[STIX]{x1D719})^{-1}$
) of Mathues et al. (Reference Mathues, McIlroy, Harlen and Clasen2015) who invoked an effective decrease in the suspension viscosity owing to Poissonian particle concentration fluctuations in the small volume of the neck (i.e. the local random fluctuations expected in the limit of low
 $\unicode[STIX]{x1D719}$
). Although weaker, the observed divergence is reminiscent of that predicted for the particle displacement correlation length
 $\unicode[STIX]{x1D709}$
in simulations of over-damped shear flow of hard spheres at the jamming point (
 $\unicode[STIX]{x1D709}/d\sim (\unicode[STIX]{x1D719}_{c}-\unicode[STIX]{x1D719})^{-0.6}$
for frictionless particles and
 $\unicode[STIX]{x1D709}/d\sim (\unicode[STIX]{x1D719}_{c}-\unicode[STIX]{x1D719})^{-0.43}$
for both frictionless and frictional particles in the range
 $\unicode[STIX]{x1D719}_{c}-\unicode[STIX]{x1D719}\gtrsim 1\,\%$
, respectively found by Olsson & Teitel Reference Olsson and Teitel2007; Trulsson, DeGiuli & Wyart Reference Trulsson, Degiuli and Wyart2017). This suggests that discrete effects accelerate the pinching when the smallest dimension of the thread, namely
 $h_{\mathit{min}}$
, has reduced down to the scale at which the fluctuating motion of the particles is correlated. This decreasing resistance to deformation of the suspension with increasing confinement might be related to the compliance of the capillary confinement imposed by the liquid interface.
The proportionality between
 $h^{\ast }$
and
 $d$
(seen in figure 11(a) for
 $d\lesssim 135~\unicode[STIX]{x03BC}\text{m}$
) does not hold above
 $d/h_{0}\approx 0.03$
, i.e. when the onset diameter
 $h^{\ast }\sim 10\,d$
becomes of the order of the initial bridge diameter
 $h_{0}$
, see figure 11(b). This may be due to the qualitative change in the bridge aspect ratio
 $l/h_{\mathit{min}}$
(discussed in § 3.2.2). Indeed, the flow around the neck when
 $h_{\mathit{min}}\approx h^{\ast }$
is expected to be similar for the different particle sizes, only if the bridge is significantly slender in all cases, i.e. if
 $h^{\ast }\sim 10\,d\lesssim h^{\prime }\simeq 0.18\,h_{0}$
for all of them, which fails to be true for
 $d/h_{0}\gtrsim 0.03$
.
Lastly, we examine the duration of the acceleration, which indicates how much shorter is the suspension pinch-off compared to that of a pure liquid of the same viscosity. Figure 12(a) presents this duration
 $t^{\ast }$
, defined by
 $h_{\mathit{min}}(t^{\ast })\equiv h^{\ast }$
(see inset in figure 7(a)), for
 $d=10~\unicode[STIX]{x03BC}\text{m}$
. The duration
 $t^{\ast }$
is found to be close to
 $\unicode[STIX]{x1D6FC}\unicode[STIX]{x1D702}_{e}h^{\ast }/\unicode[STIX]{x1D70E}$
for the whole range of particle volume fractions. For comparison, figure 12(a) also presents the time needed to thin down from
 $h^{\ast }$
at the terminal velocity
 $\propto \unicode[STIX]{x1D70E}/\unicode[STIX]{x1D702}_{0}$
. Clearly, the average thinning rate is dominated by that of the pseudo-viscous-fluid regime prior to the acceleration. Therefore, in the present range of interest of
 $\unicode[STIX]{x1D719}\leqslant 52\,\%$
, the presence of particles does not modify the order of magnitude of the overall duration but only shortens the pinch-off by a pre-factor of order one.
(a) Normalised duration of the discrete regime as a function of
 $\unicode[STIX]{x1D719}$
for
 $d=10~\unicode[STIX]{x03BC}\text{m}$
(filled circles). The solid line represents the average over the different
 $\unicode[STIX]{x1D719}$
,
 $t^{\ast }\simeq 1.4\,\unicode[STIX]{x1D6FC}\unicode[STIX]{x1D702}_{e}h^{\ast }/\unicode[STIX]{x1D70E}$
. For comparison, the dashed line corresponds to the duration expected for the pure liquid (
 ${\sim}\unicode[STIX]{x1D702}_{0}h^{\ast }/\unicode[STIX]{x1D70E}$
). (b) Time evolution of
 $h_{\mathit{min}}$
in the natural scales of the discrete regime for
 $\unicode[STIX]{x1D719}$
ranging from 10 to 50 % (
 $d=10~\unicode[STIX]{x03BC}\text{m}$
). The solid and dashed lines represent
 $h_{\mathit{min}}/h^{\ast }=(t_{0}-t)/t^{\ast }$
and
 $h_{\mathit{min}}/h^{\ast }=[(t_{0}-t)/t^{\ast }]^{1/7}$
, respectively.

With the knowledge of
 $h^{\ast }$
and
 $t^{\ast }$
, the acceleration of
 $h_{\mathit{min}}(t)$
can be plotted in these natural scales of the discrete regime in figure 12(b) for
 $d=10~\unicode[STIX]{x03BC}\text{m}$
and increasing
 $\unicode[STIX]{x1D719}$
. For low
 $\unicode[STIX]{x1D719}$
, the thinning rate is essentially constant, since
 $\unicode[STIX]{x1D6FC}\unicode[STIX]{x1D702}_{e}=\unicode[STIX]{x1D702}_{e}\,\sim \,\unicode[STIX]{x1D702}_{0}$
, whereas for larger
 $\unicode[STIX]{x1D719}$
, the time evolution of
 $h_{\mathit{min}}$
becomes increasingly concave. Therefore, the discrete regime is not unique in the sense that the function
 $h_{\mathit{min}}([t_{0}-t]/t^{\ast })/h^{\ast }$
continuously depends upon the particle volume fraction. An attempt to estimate this
 $\unicode[STIX]{x1D719}$
-dependence can be undertaken close to the jamming point. If
 $h_{\mathit{min}}/h^{\ast }$
is a power law of
 $(t_{0}-t)/t^{\ast }$
, the observations
 $h^{\ast }/d\propto (\unicode[STIX]{x1D719}_{c}-\unicode[STIX]{x1D719})^{-1/3}$
,
 $t^{\ast }\propto \unicode[STIX]{x1D6FC}\unicode[STIX]{x1D702}_{e}h^{\ast }\unicode[STIX]{x1D70E}$
, and
 ${\dot{h}}_{\mathit{min}}|_{h_{\mathit{min}}=d}/{\dot{h}}_{\mathit{min}}|_{h_{\mathit{min}}=h^{\ast }}=\unicode[STIX]{x1D6FC}\unicode[STIX]{x1D702}_{e}/\unicode[STIX]{x1D702}_{0}$
together with
 $\unicode[STIX]{x1D6FC}\unicode[STIX]{x1D702}_{e}/\unicode[STIX]{x1D702}_{0}\propto (\unicode[STIX]{x1D719}_{c}-\unicode[STIX]{x1D719})^{-2}$
imply
 $h_{\mathit{min}}/h^{\ast }=[(t_{0}-t)/t^{\ast }]^{1/7}$
in the limit
 $\unicode[STIX]{x1D719}\rightarrow \unicode[STIX]{x1D719}_{c}$
. This particularly steep acceleration is shown as a dashed line in figure 12. It is found to significantly overestimate the actual acceleration of
 $h_{\mathit{min}}$
for the largest particle volume fraction (
 $\unicode[STIX]{x1D719}=50\,\%$
) for which the finite-size acceleration regime could be accurately resolved. Without observations at larger
 $\unicode[STIX]{x1D719}$
, it is not possible to conclude whether this estimate is relevant for
 $\unicode[STIX]{x1D719}$
closer to
 $\unicode[STIX]{x1D719}_{c}\simeq 54\,\%$
.
4 Conclusion
Adding particles to a viscous liquid thread dramatically influences its break-up. It both alters the transient bridge shapes and slows down the pinching with respect to the pure liquid case. We have studied the pinching dynamics of suspensions of non-Brownian, mono-disperse, neutrally buoyant, hard spheres using a capillary bridge at large Ohnesorge numbers and have identified the influence of the suspension parameters (volume fraction
 $\unicode[STIX]{x1D719}$
, diameter
 $d$
and wetting contact angle
 $\unicode[STIX]{x1D703}$
of the particles) on the rate of pinching. Two successive regimes of thinning have been distinguished.
First, we observe an effective-viscous-fluid regime in the early stage of the pinch-off, in which the dynamics only depends on
 $\unicode[STIX]{x1D719}$
and is independent of
 $d$
. In this regime, the suspension behaves as an effective viscous fluid and the pinching is similar to that of a viscous liquid. The neck thinning rate can be written as
 ${\dot{h}}_{\mathit{min}}\sim -\unicode[STIX]{x1D70E}/\unicode[STIX]{x1D702}_{e}$
and is solely determined by the effective viscosity of the suspension,
 $\unicode[STIX]{x1D702}_{e}$
. This effective viscosity is similar to the steady shear viscosity measured using a conventional rheometer and diverges as
 $(\unicode[STIX]{x1D719}_{c}-\unicode[STIX]{x1D719})^{-2}$
at the critical volume fraction,
 $\unicode[STIX]{x1D719}_{c}\approx 54\,\%$
. For
 $\unicode[STIX]{x1D719}\gtrsim 35\,\%$
, the precise value inferred for the effective viscosity depends on whether the thinning flow is still a complex shear flow (
 $\unicode[STIX]{x1D702}_{e}$
for
 $h_{\mathit{min}}>h^{\prime }\simeq 0.18\,h_{0}$
) or has already transited to the primarily extensional flow specific of the viscous break-up (a lower value for
 $h_{\mathit{min}}<h^{\prime }$
). This slight difference in thinning rates depending on the nature of the flow suggests weak non-Newtonian effects at large
 $\unicode[STIX]{x1D719}$
.
We then identify a subsequent discrete regime in which the dynamics depends both on
 $d$
and
 $\unicode[STIX]{x1D719}$
. In this regime, the thinning rate,
 $|{\dot{h}}_{\mathit{min}}|$
, accelerates from the effective-viscous-fluid thinning rate,
 ${\sim}\unicode[STIX]{x1D70E}/\unicode[STIX]{x1D6FC}\unicode[STIX]{x1D702}_{e}$
, to the interstitial-pure-fluid thinning rate,
 ${\sim}\unicode[STIX]{x1D70E}/\unicode[STIX]{x1D702}_{0}$
. An important output of the present study is the determination of the transition neck diameter,
 $h^{\ast }\sim d(\unicode[STIX]{x1D719}_{c}-\unicode[STIX]{x1D719})^{-1/3}$
, and of the duration of this acceleration until break-up,
 $t^{\ast }\sim \unicode[STIX]{x1D6FC}\unicode[STIX]{x1D702}_{e}h^{\ast }/\unicode[STIX]{x1D70E}$
. This latter duration,
 $h^{\ast }$
, is that typically expected from the effective-viscous-fluid regime thinning rate,
 $\unicode[STIX]{x1D6FC}\unicode[STIX]{x1D702}_{e}/\unicode[STIX]{x1D70E}$
. The weak divergence of the transition neck
 $h^{\ast }$
at jamming does not agree with the stochastic prediction of Mathues et al. (Reference Mathues, McIlroy, Harlen and Clasen2015) and can be compared to the weak divergence found for the particle displacement correlation length at the jamming transition. However, it must be stressed that other mechanisms could contribute to the acceleration dynamics of the suspension thread. The neck may become increasingly diluted owing to shear-induced migration of particles from the high shear region of the neck to the low shear regions. In the present rapidly evolving extensional flow, such a migration process is certainly complex, with particles migrating away from the thin neck region but also across the neck width until they protrude at the interface. This needs to be further explored.
An important point is that the two regimes are found to be independent of the wetting contact angle made by the liquid on the particles in the studied range
 $0\lesssim \unicode[STIX]{x1D703}\lesssim 90^{\circ }$
and
 $0<\unicode[STIX]{x1D719}\lesssim 52\,\%$
. This suggests that the effective surface tension of the suspension is very similar to that of the suspending liquid, indicating that the interface is not thermodynamically equilibrated, i.e. is not saturated with particles. This situation is expected to be generic of situations where new interfaces are created, like pending drops and stretched jets, with large non-Brownian particles.
Last, it is worth mentioning that the present study focuses on the configuration of a capillary bridge, i.e. a thread with a short imposed length which pinches off at a single location. If this configuration is relevant for studying the time scale of the break-up, it does not permit addressing the question of the intrinsic length scale selected by the fragmentation of a sufficiently long thread, i.e. the size of the thread fragments. The different regimes discussed above suggests that the fragment size of an isolated thread with ‘small’ particles (
 $h^{\ast }\ll h_{0}$
) would be essentially determined by the effective viscosity of the suspension (dictating the wavelength of the Plateau-Rayleigh destabilisation) whereas that of concentrated threads with a diameter of a few particle sizes (
 $h_{0}\sim h^{\ast }$
) might be prescribed by discrete effects. The consequences regarding the length and drop sizes of a falling jet are open questions that need future works.
Acknowledgement
This work has been financially supported by the Agence Nationale de la Recherche through grant ANR-14-ACHN-0019-01.
Supplementary movies
Supplementary movies are available at https://doi.org/10.1017/jfm.2018.530.



