Introduction
Oviposition is probably the most important event in the life history of mosquitoes for both their fitness and role as vectors of pathogens. The choice of appropriate environments for oviposition can increase the fitness of individuals able to choose environments where resources are abundant and negative interactions with other species or conspecifics are avoided (Spencer et al., Reference Spencer, Blaustein and Cohen2002; Kiflawi et al., Reference Kiflawi, Blaustein and Mangel2003). The search for oviposition habitats also influences mosquito movement across habitats (Edman et al., Reference Edman, Scott, Costero, Morrison, Harrington and Clark1998). Likewise, oviposition regulates vectorial capacity, since infected female mosquitoes will only look for new bloodmeals, which may ultimately translate into transmission, once they have oviposited (Day & Curtis, Reference Day and Curtis1999; Day et al., Reference Day, Curtis and Edman1990). The extrinsic incubation period of a pathogen, i.e. the time necessary for pathogen development in the vector before it is transmissible (Dye, Reference Dye1992), is more likely to be completed if a mosquito retains her eggs while searching for oviposition sites (Day & Curtis, Reference Day and Curtis1989, Reference Day and Curtis1994, Reference Day and Curtis1999; Shaman et al., Reference Shaman, Day and Stieglitz2002, Reference Shaman, Day and Stieglitz2005), provided that senescence, the increase of mortality with age, onsets after mosquito reproduction (Styer et al., Reference Styer, Carey, Wang and Scott2007a,Reference Styer, Meola and Kramerb).
Several dimensions of climate and its variability seem to be important for the exogenous regulation of oviposition at different temporal scales. This scenario is predicted by Schmalhausen's law, a principle stating that biological systems at the boundary of their tolerance along any dimension of existence become more vulnerable to small changes along the other dimensions (Schmalhausen, Reference Schmalhausen1949; Awerbuch et al., Reference Awerbuch, Kiszewski, Levins, Martens and McMichael2002; Chaves & Koenraadt, Reference Chaves and Koenraadt2010). For example, environmental cues for oviposition can be diluted with rainfall, or low relative humidity may limit habitat colonization in an environment that typically has high relative humidity when temperature is a limiting factor for mosquito activity. Many studies on climatic (or on the shorter term, weather) factors regulating oviposition dynamics of mosquitoes have shown a robust role for rainfall at relatively coarse time scales for the mosquito lifetime, i.e. weeks and months (Hayes & Hsi, Reference Hayes and Hsi1975; Hayes & Downs, Reference Hayes and Downs1980; Strickman, Reference Strickman1983, Reference Strickman1988; Day et al., Reference Day, Curtis and Edman1990; Day & Curtis, Reference Day and Curtis1999). Predictions for longer time scales (years or season to season) have indicated that suboptimal habitats may be chosen as the end of the suitable oviposition season is approached (Edgerly et al., Reference Edgerly, McFarland, Morgan and Livdahl1998) and that timely rainfall can synchronize mosquito populations through oviposition (Shaman et al., Reference Shaman, Day and Stieglitz2002, Reference Shaman, Day and Stieglitz2005; Shaman & Day, Reference Shaman and Day2007). For finely grained time scales, i.e. daily and hourly, it has been demonstrated that light plays a major role, inhibiting oviposition when continuous in laboratory settings (Suleman & Shirin, Reference Suleman and Shirin1981) and delaying oviposition time in the field (Macdonald et al., Reference Macdonald, Madder and Surgeoner1981; Reddy et al., Reference Reddy, Lepore, Pollack, Kiszewski, Spielman and Reiter2007). Similar inhibitory effects on oviposition at fine-grained temporal scales have been shown for strong winds and heavy rainfall (de Meillon et al., Reference de Meillon, Sebastian and Khan1967). However, there is a knowledge gap for intermediate time scales, i.e. days to weeks. Relative humidity has been predicted to play a major role at intermediate time scales by facilitating the movement of gravid females and the subsequent access to oviposition sites (Platt et al., Reference Platt, Collins and Witherspoon1957, Reference Platt, Love and Williams1958; Rowley & Graham, Reference Rowley and Graham1968; Dow & Gerrish, Reference Dow and Gerrish1970; Edman et al., Reference Edman, Scott, Costero, Morrison, Harrington and Clark1998; Day & Curtis, Reference Day and Curtis1999). To study the possibility of qualitative (i.e. significant and quantitatively large) impacts of environmental change on mosquito oviposition dynamics, we conducted a field study to determine the influence of several dimensions of weather variability at intermediate time scales on the oviposition dynamics of the southern house mosquito, Culex quinquefasciatus Say (Diptera: Culicidae), the most common subtropical and tropical urban mosquito. Schmalhausen's law predicts that qualitative changes in the oviposition habitat affect the sensitivity to different climatic variables. We tested this prediction by setting up experimental larval habitats that were optimal for mosquito oviposition and that were subject to natural changes in weather factors. We followed oviposition in these habitats during three different 19 –day-long periods and found the sensitivity to climatic variables, as measured by regression coefficients, to significantly change through time, with shifts in the association regime coupled to rainfall events and changes in ammonia concentration [NH4+] in the experimental oviposition habitats.
Materials and methods
Data collection
Observation period A
For the first observation period, three artificial oviposition traps, each composed of a 20 l. dark blue surface Rubbermaid® container with 3 l of combined sewage overflow water and 12 g of crumbled dog food (20% protein) were located in the Baker Woodland Reserve at Emory University in Atlanta, GA. The choice of the oviposition medium was based on its superior attractiveness (Chaves et al., Reference Chaves, Keogh, Vazquez-Prokopec and Kitron2009). For 19 days (July 2008) the number of egg rafts were recorded and removed from each container at 11 am. To account for the possibility of broken egg rafts, we counted partial rafts that seemed to fit into a larger oval raft as one unique egg raft. Containers had openings to allow water runoff in case liquid volume increased to over 4 l due to rainfall. During the same period, water temperature was recorded every two hours in a Hobo® data logger model UA-001-08 placed in a 1-l container filled with tap water and located at the center of the three traps. Logger data for temperature were averaged for each 24-h period preceding egg raft collection. Daily temperature standard deviations for the same periods were also computed. Resulting time series were identified with the day of collection, since they reflect the environmental conditions during the oviposition period. Weather station data on daily relative humidity and precipitation for the Druid Hills/Emory area of Atlanta were obtained from Weather Underground (http://www.wunderground.com/). This station is located 2.5 km from the study site. During the entire study, we did not notice other insects in the oviposition traps, and all larvae developed in the lab from a fraction (at least one raft per container) of the field caught egg rafts were identified as Cx. quinquefasciatus.
Observation periods B and C
We continued the field study for two additional observation periods during July and August 2009, using the same setup of observation period A, but increasing the number of replicates to five to accommodate some changes in data collection for covariates. For these study periods, water temperature was measured for each container using an individual data logger per container, instead of using a separate container with tap water. Temperature measurements were recorded every 30 min instead of every two hours. For these periods, we also used a Hobo® data logger model H8-031-08 to measure air temperature and relative humidity at the study site with measurements recorded every 30 min. Additionally, for three of the five replicates, we took 10 ml of water daily to measure ammonia concentration [NH4+] colorimetrically with a chemetrics kit#K–1523 (direct nesslerization method). We measured ammonia because of the known role of nitrogen in limiting bacteria that serve as resource for mosquito larvae (Merritt et al., Reference Merritt, Dadd and Walker1992) and the positive effects of this nutrient on bacterial populations and mosquito productivity (Walker et al., Reference Walker, Lawson, Merritt, Morgan and Klug1991; Beehler & Mulla, Reference Beehler and Mulla1995). Thus, a change in ammonia can be used as a proxy of changes in bacterial populations. All other procedures and data sources were similar to those used for observation period A.
Statistical analysis
Oviposition cycles and patterns of association
To study oviposition cycles, the wavelet spectrum analysis was used, a technique that reveals cycles and their temporal changes in time series analysis (Cazelles et al., Reference Cazelles, Chavez, de Magny, Guegan and Hales2007). The wavelet power spectrum of the average number of egg rafts for each observation period series was computed and its significance was tested against a white Gaussian noise background (Chaves & Pascual, Reference Chaves and Pascual2006). White noise is uncorrelated random variation that resembles a Gaussian, a.k.a. normal, probability distribution. Wavelet analysis can also be used to study patterns of association between time series over time by performing a cross-wavelet analysis (Chaves & Pascual, Reference Chaves and Pascual2006). Cross-wavelets can be used in a coherence analysis to determine if two time series oscillate in a similar fashion, i.e. if the time difference between peaks and troughs is the same, and to quantify the degree of synchrony, i.e. if peaks in the two time series occur simultaneously. The information from the cross-wavelets can also be used in a phase analysis that allows measuring the delay between the peaks and troughs of two time series (Cazelles et al., Reference Cazelles, Chavez, de Magny, Guegan and Hales2007). For a time frequency visualization of the association, cross-wavelet coherence and phase analyses between the average number of rafts for each observation period and selected climatic covariates were performed using the Matlab package by Grinsted et al. (Reference Grinsted, Moore and Jevrejeva2004). Significance levels for time frequency regions were obtained by a Monte Carlo with 1000 surrogated datasets against a red noise process, and the Morlet wavelet was used as wavelet basis in all the analyses (Chaves & Pascual, Reference Chaves and Pascual2006). Red noise is defined as autocorrelated random variation. We chose wavelet techniques over more traditional correlation based techniques since they allow one to localize in time the effect of covariates whose impacts on dynamics can be very transient, yet important to understand dynamic changes in a system. For a comprehensive description of wavelets analysis and its use in the study ecological time series, see Cazelles et al. (Reference Cazelles, Chavez, de Magny, Guegan and Hales2007).
Breakpoints and changes in the effects of weather and ammonia concentration [NH4+] on the oviposition dynamics
A breakpoint is the time when a qualitative change in the dynamics of a system occurs (Scheffer et al., Reference Scheffer, Carpenter, Foley, Folke and Walker2001). The log-likelihood profiles of split models for the average number of rafts from each observation period were computed to identify potential breakpoints. The significance of chosen breakpoints was tested with 1000 realizations of the parametric bootstrap procedure presented by Solow & Beet (Reference Solow and Beet2005). Once potential breakpoints were identified, linear mixed effects models (LMEM) were used to explicitly consider the effects of the different sources of variability, namely the different study periods, the replicates, the repeated measurements through time, the regimes before and after the breakpoints, and the error. The explicit consideration of these sources of variability is not possible with simpler time series analysis (Chaves, Reference Chaves2010). LMEMs that considered the above listed sources of variability were also used to study the relationship of egg rafts with temperature and ammonia during periods B and C using the detailed data at the level of the individual container. We also analyzed the average number of egg rafts for each study period using time series models that besides the breakpoints included average covariates for those measured at the replicate scale, i.e. water temperature and [NH4+], and those covariates that were not measured at each experimental container and that can assumed to be homogeneous at our study site, i.e. rainfall, air temperature and relative humidity. This analysis complemented the results of the LMEMs by considering all the measured covariates, including those that were only measured for the whole site (like relative humidity), and allowed us to compare the three studied periods in terms of the overall impacts of the weather covariates. Covariate lags were chosen by looking at cross correlation functions and included as demeaned covariates in linear models. Cross correlation functions were based on Kalman pre-whitened residuals (Chaves & Pascual, Reference Chaves and Pascual2006). Finally, models were selected by their Akaike Information Criterion (AIC) (Shumway & Stoffer, Reference Shumway and Stoffer2000). Restricted maximum likelihood (REML) was used for parameter estimation in the linear mixed effects models (Faraway, Reference Faraway2006). For time series models, maximum likelihood parameter estimation was done using the Kalman recursions implemented in the statistical package R (Chaves & Pascual, Reference Chaves and Pascual2006).
Results
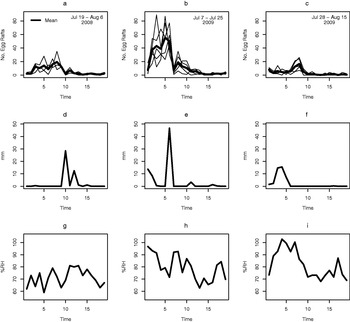
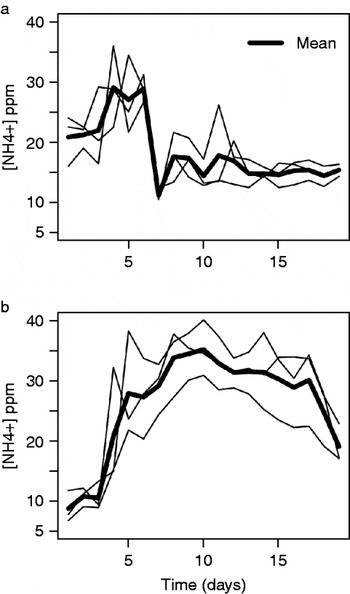
Egg rafts, rainfall and relative humidity data are presented in fig. 1. Ammonia concentration data are presented in fig. 2. Figure S1 presents temperature data for the three study periods.
Time series (a), (b) and (c) show the average number of egg rafts (thick lines) and individual replicates (thin lines) for observation periods A, B and C, respectively. (d), (e) and (f) show the daily rainfall during the observation periods A, B and C, respectively. (g), (h) and (i) show the daily average relative humidity for observation periods A, B and C, respectively.

Ammonia concentration (NH4+) dynamics: (a) observation period B; (b) observation period C. Thick lines are the averages for each period and thin lines individual replicates.

Oviposition cycles and patterns of association
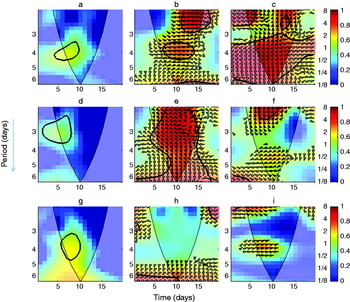
The wavelet power spectra (fig. 3) showed that all studied periods had similar cycles of 3–4 days (y-axis), being statistically significant between days 4 and 10–12 (x-axis). In general, rainfall had a negative association with oviposition (fig. 1), either inhibiting it (for period C) or shifting oviposition dynamics (periods A and B). This association was statistically significant as revealed by the cross-wavelets analysis (fig. 3), which shows a significant association for periods A and B during the major rainfall events. The effect was synchronous for series A since rainfall on day 10 of that observation period occurred before the daily survey and, if there was any oviposition rafts, could have been washed by rainfall, while for series B the effect was noticed on day 7 as rainfall in day 6 occurred after the survey. In the plots, rainfall impacts on oviposition dynamics are revealed by the direction (angle) of the arrows (i.e. the phase), while the intensity by the predominance of red (i.e. a high coherence). A sustained and strong coherence between relative humidity and the average number of egg rafts was observed in all the three study periods, as shown by fig. 3. In the plots, this is revealed by the abundance of yellow/red through time (i.e. high levels of coherence). For periods A and B, the coherence was statistically significant across temporal scales (y-axis) for the whole period (x-axis), while for period C it was limited to the first half (day 10 and before) of the series. In all cases, coherence was out of phase, i.e. with a lag.
Time frequency analysis (a), (d) and (g) wavelet power spectrum of the average daily number of rafts for observation periods A, B and C, respectively. Cross-wavelet coherency and phase between the average daily number of rafts and: rainfall ((b), (e) and (h) for observation periods A, B and C, respectively); relative humidity ((c), (f) and (i) for observation periods A, B and C, respectively). The wavelet power spectrum scale is from 1/8 (blue) to 8 (red). The coherency scale is from zero (blue) to one (red). The cone of influence (within which results are not influenced by the edges of the data) and the significant (P<0.05) coherent time-frequency regions are indicated by thin and thick solid lines, respectively. For (a), (d) and (g) red regions indicate high variability and blue regions indicate low variability. For (b), (c), (e), (f), (h) and (i), red regions in the upper part of the plots indicate frequencies and times for which the two series share variability. The relative phase relationship is shown as arrows (with in-phase pointing right, anti-phase pointing left and the climatic covariate leading by a 90° difference when pointing down). Period scale is in days. The y-axis is on a base 2 logarithmic scale.

Breakpoints and changes in the effects of weather and ammonia concentration [NH4+] on the oviposition dynamics
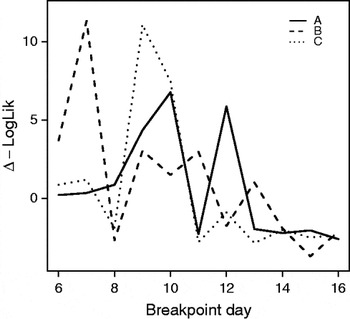
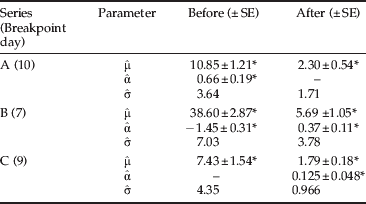
The log-likelihood profiles of split models are presented in fig. 4. In this figure, the largest differences in log-likelihood indicate the most likely breakpoints for each study period. In general, breakpoints were significant when looking at the three periods, separately and together as shown by the LMEM (tables 1 and S1). All breakpoints were statistically significant according to the bootstrap (P<0.005). During the three study periods, oviposition dynamics shifted around major rainfall events (fig. 1). Breakpoints were statistically significant: the day of a major rainfall event for period A, the day following a similar event for series B, and number of rafts was reduced for period C when rainfall was abundant at the beginning of the period (tables 1 and S1). The consideration of relative humidity as covariate improved the fit of models (table 2). Models including only relative humidity had the best fits and had a general form:

where μ is the mean number of egg rafts, α is a coefficient for the effect of relative humidity (RH), t indicates the time, and ε is the error, which was assumed to be independent, normal and with variance σ2. Table 2, which shows the results of the time series models, reveals that, in general, increases on average relative humidity had a positive impact on oviposition dynamics. However, for period B, the effect of an increased relative humidity was negative before the regime shift. No significant results were found for air temperature, water temperature or their daily variability measured as SD. Finally, [NH4+] was important for oviposition before the regime shift, having a negative effect on oviposition (table 3).
Log-likelihood profiles of models considering one breakpoint. The solid line is for observation period A (breakpoint at day 10), the dashed line for observation period B (breakpoint at day 7), and the dotted line for observation period C (breakpoint at day 9). In all cases, breakpoints were statistically significant when tested with parametric bootstraps (P<0.005).

Mean number of egg rafts before and after breakpoints for all time series from each observation period considered together in a linear mixed effects model.

* Significant (P<0.05) when compared to a null model of mean equal to 0.
Breakpoint indicates the day the time series were split. Before and After are the resulting segments. 95% confidence limits were obtained using a parametric bootstrap. This model included parameters for the variability of each series of experiments ( ), for the replicates within the series of experiments and for each segment, (
 ), to account for the repeated measurements through time (
 ) and for each individual observation (i.e. the error,
 ). This model (AIC=1787) outperformed models that did not consider differences between regimes for each experimental series (AIC=1826) and simplified models that did not consider explicitly any of the above sources of variability, with or without regime shifts (all with AICs over 1800).
Parameter values before and after breakpoints for time series models of the average number of egg rafts for each observation period time series using linear time series models.

* Statistically significant (P<0.05) indicates that the parameter was not estimated for the segment following model selection (table S1).
Breakpoint indicates the day the time series was split. Before and After are the resulting segments. For parameter interpretation see results section on breakpoints.
Mean number of egg rafts before and after breakpoints for observation periods B and C where [NH4+] concentration was measured.

* Significant (P<0.05).
Before corresponds to the first segment and After to the second. 95% confidence limits were obtained using a parametric bootstrap.  represents the average number of egg rafts and
 is a coefficient that represents changes in the number of egg rafts as function of [NH4+]. This model included parameters for the variability of each series of experiments (
 ), for the replicates within the series of experiments and for each segment, (
 ), to account for the repeated measurements through time (
 ) and for each individual observation (i.e. the error:
 ). This model (AIC=880) outperformed models that did not consider differences between regimes for each experimental series (AIC=895) and simplified models that did not consider explicitly any of the above sources of variability, with or without regime shifts, and including or excluding water temperature (all with AICs over 885).
Discussion
Regime shifts, or qualitative changes in dynamic behavior, are very common phenomena in ecosystems, affecting both populations and environmental quality (Scheffer et al., Reference Scheffer, Carpenter, Foley, Folke and Walker2001). Since shifts can be due to both the action of organisms and the changing environment, finding plausible causes is one of the major challenges to understanding the nature of regime shifts (Vandermeer & Yodzis, Reference Vandermeer and Yodzis1999). In our study, major rainfall events are a major cause for observed shifts in oviposition. This observation is robustly supported by the results from the cross-wavelet coherence analyses over three different time periods. Alternatively, pheromones that are important for the oviposition of this species could have been washed, but this mechanism of action is less likely given the unobserved recovery following the initial oviposition after the rainfall (Beehler et al., Reference Beehler, Millar and Mulla1994; Millar et al., Reference Millar, Chaney, Beehler and Mulla1994; Braks et al., Reference Braks, Leal and Cardé2007). We did not measure adult abundance, which could limit oviposition if rainfall has an impact on the density of gravid females, a fact that is not supported by several studies in mosquito ecology (Silver, Reference Silver2008). Rainfall could also have lagged effects by altering blood feeding and activity patterns of mosquitoes even if effects in adult mortality are nil. Nonetheless, our observations robustly show a synchronous effect, thus supporting an effect on oviposition medium quality.
The coherence analyses found a negative association between oviposition and rainfall, which is likely to act through changes in water quality (fig. 2), in that following rainfall a marked change in [NH4+] was observed. Changes in ammonia have been shown to quickly impact microbial communities that serve as resources for mosquito larvae (Walker et al., Reference Walker, Lawson, Merritt, Morgan and Klug1991). Previous observations showed an inhibitory effect of rainfall on Cx. quinquefasciatus oviposition at the hourly time scale (de Meillon et al., Reference de Meillon, Sebastian and Khan1967). In our study, at intermediate time scales (days to weeks), rainfall has an inhibitory impact similar to the one observed for short time scales, which contrasts with patterns reported at longer time scales (months and seasons), where the role of rainfall is positive (Strickman, Reference Strickman1988; Day et al., Reference Day, Curtis and Edman1990). The scale dependent paradoxical effects of rainfall on oviposition indicate that rainfall frequency and intensity are critical to understanding the rhythms of mosquito abundance. On one hand, sustained rainfall can have negative impacts on oviposition, by inhibiting mosquito activity, including oviposition. On the other hand, it can lead to increased mosquito abundance via a phase locking, i.e. rainfall facilitates the growth of mosquito populations (Shaman & Day, Reference Shaman and Day2007). However, the dual effects of rainfall also raise questions about other factors that may be fundamental to untangling its role in the seasonal dispersal and amplification of arboviral transmission by mosquitoes (Shaman et al., Reference Shaman, Day and Stieglitz2002, Reference Shaman, Day and Stieglitz2005). For example, rainfall in cities may locally increase nutrients in water bodies by combined sewage overflows (Calhoun et al., Reference Calhoun, Avery, Jones, Gunarto, King, Roberts and Burkot2007), and agricultural runoff has been shown to increase nutrients in water worldwide (Beman et al., Reference Beman, Arrigo and Matson2005). By contrast, in our study, rainfall washed and diluted the oviposition medium. The former decreased the medium quality for oviposition, explaining the low numbers of rafts after or during rainy days. Thus, mosquito population dynamics might be influenced by the abundance of nutrients in the landscape (as well as its heterogeneous distribution), and their effects on mosquito population dynamics through oviposition (Spencer et al., Reference Spencer, Blaustein and Cohen2002).
That relative humidity was identified as one of the most important variables explaining the dynamics of oviposition was expected, given the need for moist landscapes in which mosquitoes may move and find oviposition sites (Platt et al., Reference Platt, Collins and Witherspoon1957, Reference Platt, Love and Williams1958; Rowley & Graham, Reference Rowley and Graham1968; Dow & Gerrish, Reference Dow and Gerrish1970; Day et al., Reference Day, Curtis and Edman1990; Edman et al., Reference Edman, Scott, Costero, Morrison, Harrington and Clark1998). The fact that the association can become negative could reflect some non-linearities in the effects of relative humidity, where excessively large values can be associated with other weather variables (rain) that inhibit mosquito oviposition and movement. For period C, relative humidity was not important before the breakpoint when it was very high (over 80%, which also means that it had a low variability given the boundedness of this variable between 1 and 100%). When relative humidity was negative for period B, it was also during a period where it tracked rainfall.
Models for oviposition predict that when no better choice is available, aging females will oviposit in any available habitats (Mangel, Reference Mangel1987). Since that is a risky choice, because the progeny can be doomed unless the environment improves, it is to be expected that oviposition will occur whenever possible while moving across a dangerous environment, i.e. one that increases mortality. Thus, the importance of weather variability in driving oviposition diminishes with increasing age and in sub-optimal environments, since fitness is no longer optimized (Levins, Reference Levins1968). Basically, the gravid female is highly likely to die before even attempting oviposition. Our study suggests the importance of scale-dependent effects of rainfall and other climatic covariates on mosquito oviposition dynamics and demonstrates the need for longer studies with finely grained resolution of the dynamics. Such studies should include measurements on the dynamics of the oviposition medium beyond chemical components, looking at the microbial communities, to better understand mosquito oviposition and population dynamics in complex ecosystems (Merritt et al., Reference Merritt, Dadd and Walker1992). It is also necessary to understand how the dynamics are affected by inter-specific interactions, primarily predation (Blaustein & Chase, Reference Blaustein and Chase2007). Although predators have not been found in sewage overflow water used in our study (Calhoun et al., Reference Calhoun, Avery, Jones, Gunarto, King, Roberts and Burkot2007), predators can become adapted to these sewage overflow emerging habitats and can influence oviposition habitat choice in mosquitoes (Chesson, Reference Chesson1984; Kiflawi et al., Reference Kiflawi, Blaustein and Mangel2003). The fact that we removed egg rafts daily needs further consideration; at best, it represents a case of a high predation. However, our previous results showed no major differences when egg rafts were removed or stayed in the container throughout a similar field study (Chaves et al., Reference Chaves, Keogh, Vazquez-Prokopec and Kitron2009). The information from such studies will aid the proposal of biologically based models for the management of mosquito populations.
Acknowledgements
This work was funded by Emory University and NSF Ecology of Infectious Disease Grant 0840403. Carolyn Lauren Keogh, Gregory Morris Decker and Kevin Lai Lanza offered assistance with the study. Carolyn Lauren Keogh also provided valuable comments on this manuscript. An anonymous referee also made very valuable comments to further improve the manuscript. We also thank the Research and Policy for Infectious Disease Dynamics (RAPIDD) program of the Science and Technology Directorate and the Fogarty International Center, National Institutes of Health program on mosquito borne diseases, for helpful discussions in the context of this manuscript.
Supplementary Material
The online table and figure can be viewed at http://journals.cambridge.org/ber