


1. Introduction
Reference LliboutryNye (1965) has calculated a solution for the steady-state flow along a channel of uniform section and slope of a glacier obeying the non-linear flow law of Glen. He takes as boundary condition on the rock bed a zero slip velocity. It could also be non-zero, uniform, and independent of the friction, but such a hypothesis seems completely unrealistic.
Recent measurements of ice deformation on the surface and at depth made by Reference RaymondRaymond ( 1971) on the Athabasca Glacier show a very different distribution of velocities from those suggested by Nye. Instead of a constant slipping velocity, Raymond has found a velocity which varies along the section. This velocity, which is a few metres per year at the edges, reaches 42 m a−1 at the centre or about 80% of the surface velocity. This characteristic leads us to adopt a theoretical model which allows large variations of slip velocity. It seems more realistic to adopt as boundary condition between ice and rock a friction f proportional to the normal pressure of the ice, reduced by the mean pressure of liquid water at the interface (Reference LliboutryLliboutry, 1968, Reference Lliboutry1969). Measurement of the level of water in hole 2A has in effect shown that there exists a very large water pressure in cavities at the bed of the glacier. For an extremely wide glacier (plane problem) the difference between the pressure of the ice and the pressure of the water in cavities has the mean value

where ρ
i and ρ
w are the densities of ice and water respectively, h is the thickness of ice, h
w the piezometric height corresponding to subglacial water channels, and κ is a factor depending on the way the hydraulic network branches, and varies from  .
But, as Professor Lliboutry has commented, for a valley glacier we must take into account the variation in pressure due to the difference in height H between the point considered and the place where the subglacial water cavities come together with the main subglacial stream. The expression for  becomes

2. Co-ordinates and Notation
We adopt a co-ordinate system as shown in Figure 1. The free surface of the ice is the plane y = 0 which makes an angle α with the horizontal, t is the angle formed by the normal to the bed with the Oy axis, w is the ratio of the half-width to the depth a of the perpendicular section, and y w is the distance from the water table to the surface.
Schematic diagram of valley glacier. Left: longitudinal profile along centre line. Right: transverse parabolic crosssection of width ratio w = 2.

We suppose that the movement is in a steady state and is parallel to the Ox axis with velocity u. We suppose that the stresses follow the equations:

with, in the plane y = 0

In this case the equilibrium equations reduce to

and Glen’s flow law gives

where  , A = 0.17 and n = 3.
We adopt the reduced variables

and the stress function ψ already introduced by Nye so that

3. Boundary Conditions at the Bottom of the Glacier
The friction condition at the bed is written.

where C 0 is a constant if w and ϒ w are given. For 0 ⩽ ϒ ⩽ ϒ w the second term in Equation (8) becomes Cϒ with C = C 0 κ cot α, and for ϒ w ⩽ ϒ ⩽ 1

Along the edge of the perpendicular section where ϒ and  are related by the equation
 , Equation (8) is a first-order differential equation for a function of a single variable. Let us put ξ = tan t, and Equation (8) is written for 0 ⩽ ϒ ⩽ ϒ
w

where δ = (ρ w–ρ i)/ρ i = 0.12 and ξ w is the value of ξ for ϒ w.
Along the O
z
axis T
Y
= 0 therefore  and ψ is constant. Similarly on Oy where Tz = 0, dψ/dy = 0 and ψ is constant. One chooses this constant to be zero, and therefore ψ is known at two points of the bed:
 and
 These two expressions for ψ must become the same at ϒ = ϒ
w which determines the value of C.
It follows that for ϒ ⩽ ϒ w:

and for ϒ w ⩽ ϒ ⩽ 1:

with

where

ξ w, λ w, λ w′ are the values of ξ, λ, λ′ for ϒ = ϒ w, and λ 0, λ 0′ the values of λ, λ′ for ϒ = 0.
4. Numerical Solutions
Function ψ, known at the edges of the section, must satisfy within the section the equation in partial derivatives:

Equation (14) is of the elliptic type throughout the domain. To resolve this Dirichlet problem, one uses an iterative relaxation method described in detail by Reference NyeNye (1965). To do this, Equation (14) is written in finite difference form for the network shown in Figure 2. In this case the value of ψ at point 2 is a linear function of the values of ψ at the eight neighbouring points.
Square mesh used to write Equation (14) as a finite-difference approximation at the point 2. Near the bed (heavy line), the points 3, 5, 9 and 8 can be exterior to the cross-section. Instead of these points we take the points 31, 51, 91 and 81. The distance of these points from point 2 are the ρ i

A difference in treatment affects the way of expressing Equation (14) for points neighbouring the boundary when some of the eight neighbouring points are outside the domain. These external points (points 8, 5, 9 and 3 in Figure 2) are replaced in the example shown by the points 81, 51, 91 and 31 respectively. The distances between the point 2 and the points i1 are called ρ i. The first derivatives at the point 2 are therefore given to the second order approximately by:

These expressions involving ψ 2 we have replaced by
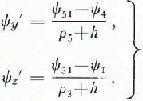
The method has been programmed for an IBM 360–70 computer. To cover the domain, a technique of alternate iterations has been used taking the points line by line and beginning from an axis on the perpendicular section, then column by column beginning this time by the points at the margin. This treatment related to a relaxation technique gives a rapid convergence. The meshes of the grid are squares of variable side, the first solution obtained for squares of side 0.2, serves as an initial solution for the grid of side 0.1, etc. The calculation has been terminated for squares of side 0.05, the solution obtained being very close to its predecessor. The calculating programme was tested for two obvious solutions of Equation (14) which are

The tests showed that for these solutions the finite-difference form of the differential equation and the manner of treating points near to the boundary of the perpendicular section are correct.
5. Solutions
The calculation has been made with values obtained on the Athabasca Glacier: W = 2, a = 310 m, α = 3° 30′.
Using the ϒ w the value of the water level for water in bore-hole 2A: ϒ w = 0.13, we obtain a velocity at the centre of 104 m a−1 at the surface and 96 m a−1 at the bottom, although the shear stress τ xy at the bottom is only −0.37 ρga sin α. The value 0.13 for the parameter ϒ w therefore leads to results rather far from experimental results. However, taking ϒ w = 0.13 one produces at the subglacial stream and at cavities which communicate easily with each other a very high pressure equal to 27 bars. But, according to Lliboutry’s model, this pressure varies from one point to another on the bed according to the nature of the interconnection of the cavities with the main subglacial stream. This has been verified in the course of borings made on the Glacier de Saint-Sorlin, France. For certain bore holes the level of water stabilized at different heights although others in the same neighbourhood emptied suddenly when the boring tool reached the rock bed (verbal communication from F. Gillet). It is for this reason that measurement of the piezometric height at a single point can only give a rough idea of the pressure which is occurring at the base of the glacier.
Several calculations, made with various values for the parameter ϒ
w, show that the velocity decreases rapidly when ϒ
w increases (Fig. 7). For a mean-water height of  or a pressure of 20.8 bars at the base, the distribution of velocities (Fig. 3) is very close to that obtained by Raymond, for the majority of the section (Figs. 4, 5), the only difference coming from velocities close to the edge. But for this region a comparison is hardly possible because no measurements were made at depth. This value of ϒ
w has therefore been adopted.
Distribution of longitudinal velocity for a parabolic channel of width ratio 2 with a = 310 m. α = 3° 30′ and ϒw = 0.33, n = 3, A = 0.17, (a) down the ϒ-axis, (b) in cross section. Units are m a−1.

Distribution of longitudinal velocity in Athabasca Glacier cross-section (section A, Raymond, 1970). Units are m a−1

Lateral variations of surface velocity in three sections of Athabasca Glacier (Raymond, 1970). Field data (solid lines), and computed values, with a = 310 m, ϒw = 0.33, n = 3, A 0.17 (dashed line).

The values of the velocities used at the centre of the surface, of the mean velocities over the surface ⟨u s⟩ and the mean values over the section ⟨u⟩ as well as the total outflow are shown in Table I for the values measured on the Athabasca Glacier, those given by Nye’s theory and by our theory.
Measured And Calculated Velocities And Outflows

6. Stress Distribution
The distribution of stresses shown in Figure 6 gives a variation of τ xy along the axis of the glacier practically linear with depth and at the bottom:

Distribution of shear stress τ for a parabolic channel of width ratio 2 with a = 310 m, α = 30° 30′, ϒw = 0.33, n = 3 and A = 0.17, (a) in a crass section, (b) down the ϒ-axis, (c) on the  -axis.

Along the edges at  , Equation (10) gives
 ; this value does not depend strongly on ϒ
w when w = 2.
We therefore have:

With the exception of the case where ϒ w = 1, that is to say the case where the subglacial stream is at atmospheric pressure, Tz has a maximum at the surface and not on the edge but at some distance from the margin of the glacier (Fig. 7). But it must be noted that if this corresponds with observations, this does not constitute a proof of the validity of our model, for Nye has obtained the same result with different boundary conditions.
Parabolic channel, w = 2, n = 3; values in dimensionless form. Top left: Velocity distribution down the ϒ-axis. Top right: Velocity in a transverse line ( -axis) on the surface. Bottom left: shear stress ϒY on the ϒ-axis. Bottom right: shear stress Tz on the
 -axis. Numbers on curves are values of ϒw. The dashed line represents the values computed by Nye for the same channel.

With the law adopted, the maximum stress on the bed is no longer obtained along the axis of the channel as in Nye’s model, but at the edges for ϒ = ϒ w. This last characteristic can explain, as Professor Lliboutry has pointed out, the important lateral erosion and the U-shape encountered in the majority of valley glaciers.
Acknowledgements
I would like to thank Professor L. Lliboutry who proposed this subject to me and has guided each stage of the work. I also want to thank Professor Gastinel, Director of the Applied Mathematics service in the Faculty of Sciences at Grenoble, who has advised me on the methods of calculation.



