Introduction
Attention-deficit hyperactivity disorder (ADHD) is a childhood-onset neurodevelopmental disorder whose persistence into adulthood has been increasingly acknowledged (Asherson et al. Reference Asherson, Buitelaar, Faraone and Rohde2016). ADHD in both children and adults manifests as a heterogeneous condition with significantly varied intensity and types of inattention and hyperactivity–impulsivity symptoms across individuals (Asherson et al. Reference Asherson, Buitelaar, Faraone and Rohde2016). Individuals with ADHD also commonly present with general cognitive deficits (Fair et al. Reference Fair, Bathula, Nikolas and Nigg2012; Mostert et al. Reference Mostert, Hoogman, Onnink, van Rooij, von Rhein and van Hulzen2018) interacting with clinical symptoms (Cheung et al. Reference Cheung, Rijdijk, McLoughlin, Faraone, Asherson and Kuntsi2015; Rommelse et al. Reference Rommelse, van der Kruijs, Damhuis, Hoek, Smeets and Antshel2016).
Although the etiological markers of ADHD remain elusive, the disorder is associated with functional alterations in whole-brain resting-state networks (Gallo & Posner, Reference Gallo and Posner2016). ADHD symptoms, in both adults and children, have consistently been linked to abnormal functional connectivity within and between the default-mode network (DMN), cognitive control and attention networks, as well as mesocorticolimbic circuits (Cocchi et al. Reference Cocchi, Bramati, Zalesky, Furukawa, Fontenelle and Moll2012; Lin & Gau, Reference Lin and Gau2015; Castellanos & Aoki, Reference Castellanos and Aoki2016; Cai et al. Reference Cai, Chen, Szegletes, Supekar and Menon2017). In line with the clinical expression of ADHD, these networks are widely-known to provide crucial support to higher-order cognitive functions (Cole et al. Reference Cole, Ito, Bassett and Schultz2016) and general intelligence (Hearne et al. Reference Hearne, Mattingley and Cocchi2016).
Altered resting-state connectivity has been used to parse clinically heterogeneous children with ADHD into more coherent subgroups (Gates et al. Reference Gates, Molenaar, Iyer, Nigg and Fair2014; Costa Dias et al. Reference Costa Dias, Iyer, Carpenter, Cary, Wilson and Mitchell2015). However, attempts to stratify ADHD based on resting-state connectivity have so far provided inconsistent results with important caveats from a clinical perspective. For example, connectivity-based clusters have not converged on symptomatically similar subgroups of ADHD across studies (Gates et al. Reference Gates, Molenaar, Iyer, Nigg and Fair2014). Previous studies have also isolated subgroups by pooling ADHD and typically developing controls together, precluding a distinct assessment of possible categories specific to ADHD (Gates et al. Reference Gates, Molenaar, Iyer, Nigg and Fair2014; Costa Dias et al. Reference Costa Dias, Iyer, Carpenter, Cary, Wilson and Mitchell2015; Marquand et al. Reference Marquand, Wolfers, Mennes, Buitelaar and Beckmann2016). On the other hand, dimensional models of ADHD psychopathology based on behavioral measures are increasingly supported (Marcus & Barry, Reference Marcus and Barry2011; Willcutt et al. Reference Willcutt, Nigg, Pennington, Solanto, Rohde and Tannock2012). Nevertheless, the link between existing dimensional models and brain function remains elusive, with very limited data in the adult population (Asherson et al. Reference Asherson, Buitelaar, Faraone and Rohde2016; Gallo & Posner, Reference Gallo and Posner2016).
Recent advances in neuroimaging methods provide new opportunities to test the dimensional and categorical models of ADHD by using multivariate analyses (e.g., canonical correlation analysis, CCA) of brain–behavior relationships (Smith et al. Reference Smith, Nichols, Vidaurre, Winkler, Behrens and Glasser2015; Drysdale et al. Reference Drysdale, Grosenick, Downar, Dunlop, Mansouri and Meng2017). Leveraging these new methodological developments, the heterogeneity between individuals with ADHD can be addressed by borrowing and extending the construct of biotype. Here, a biotype delineates a subgroup of individuals with ADHD sharing common symptom patterns and abnormal resting-state connectivity. A dimensional biotype is defined by abnormal brain–symptom patterns that vary in severity across individuals on a continuum. Conversely, a categorical biotype defines a discrete subgroup of individuals sharing a combined pattern of altered functional connectivity and clinical-cognitive features that are unique and segregated from other individuals. Breaking down ADHD heterogeneity into dimensional or categorical biotypes is important because it will enable the development of targeted research and clinical interventions. Prior studies have attempted to define ADHD categorical subtypes based on co-occurring psychiatric symptoms (Acosta et al. Reference Acosta, Castellanos, Bolton, Balog, Eagen and Nee2008), neuropsychological profiles (Fair et al. Reference Fair, Bathula, Nikolas and Nigg2012; Mostert et al. Reference Mostert, Hoogman, Onnink, van Rooij, von Rhein and van Hulzen2018), temperaments (Karalunas et al. Reference Karalunas, Fair, Musser, Aykes, Iyer and Nigg2014), and patterns of functional connectivity (Gates et al. Reference Gates, Molenaar, Iyer, Nigg and Fair2014; Costa Dias et al. Reference Costa Dias, Iyer, Carpenter, Cary, Wilson and Mitchell2015). Karalunas et al. (Reference Karalunas, Fair, Musser, Aykes, Iyer and Nigg2014) were the first to use behavioral and physiological measures to investigate the existence of ADHD categorical subtypes. In this study, subtypes were initially defined using temperamental features and subsequently validated by cardiac and brain measures, as well as clinical outcomes. However, to the best of our knowledge, no studies have combined symptoms and brain features to assess the existence of categorical and/or dimensional biotypes of ADHD. In other psychiatric disorders such as psychosis, neuroimaging, and behavioral data have recently been used to parse individuals into separate biotypes. For example, Clementz et al. (Reference Clementz, Sweeney, Hamm, Ivleva, Ethridge and Pearlson2016) delineated three categorical psychosis biotypes using cluster analysis applied to electrophysiological and neuropsychological data, while Kaczkurkin et al. (Reference Kaczkurkin, Moore, Calkins, Ciric, Detre and Elliott2017) applied a constrained factor analysis to psychiatric symptoms in a large cohort of youth to delineate orthogonal dimensions of psychopathology.
In this study, we assessed complex relationships between clinical and cognitive presentations and abnormal resting-state connectivity in a large medication-naïve sample of adults with ADHD. The principal aim of our analysis was to uncover the existence of dimensional or/and categorical biotypes of childhood-onset adult ADHD. Specifically, we identified distinct alterations in whole-brain resting-state connectivity (as estimated by a multi-echo planar imaging, EPI, acquisition) that were associated with distinct symptoms of inattention and hyperactivity-impulsivity, as well as general cognitive functioning (Wechsler, Reference Wechsler1997). To maximize the translational value of our work (Drysdale et al. Reference Drysdale, Grosenick, Downar, Dunlop, Mansouri and Meng2017), we focused on a subset of symptom measures which capture the majority of variance in ADHD phenomenology (Asherson et al. Reference Asherson, Buitelaar, Faraone and Rohde2016) and are commonly acquired in clinical settings. Based on recent findings (Barch, Reference Barch2017; Drysdale et al. Reference Drysdale, Grosenick, Downar, Dunlop, Mansouri and Meng2017), we hypothesized that biotypes of adult ADHD would involve functional connectivity changes in brain networks previously with symptoms of ADHD. Specifically, we expected the interaction between the DMN and cognitive control and attention networks to be key to the delineation of ADHD dimensional or categorical biotypes (Cocchi et al. Reference Cocchi, Bramati, Zalesky, Furukawa, Fontenelle and Moll2012; Lin & Gau, Reference Lin and Gau2015; Cai et al. Reference Cai, Chen, Szegletes, Supekar and Menon2017).
Methods
Participants and procedure
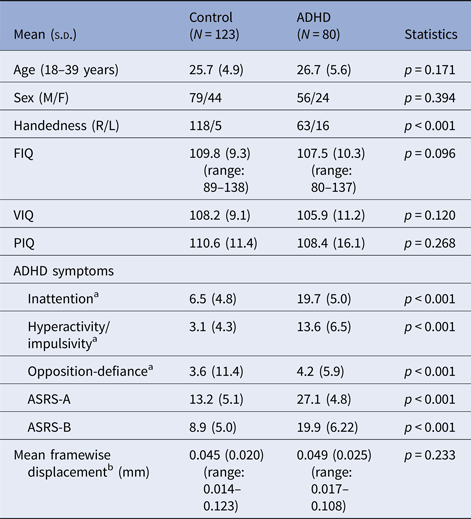
The study included 80 medication-naïve adults with childhood-onset ADHD (24 females) aged 18–39 years (mean 26.7 years), who fulfilled DSM-IV-TR criteria for ADHD, and 123 age- (mean 25.7 years) sex- (44 females) and IQ-matched healthy controls with no clinically significant psychopathology. The participants were assessed at the adult ADHD special clinic of the Department of Psychiatry, National Taiwan University Hospital (NTUH), Taipei, Taiwan from March 2014 to December 2016. Compared to existing multi-site studies (Hoogman et al. Reference Hoogman, Bralten, Hibar, Mennes, Zwiers and Schweren2017), we recruited a homogeneous sample that is free from medication and multi-site confounds (e.g., different MR scanners and protocols). The detection of biotypes in our unique sample is also facilitated because the variance in the data cannot be linked to heterogeneous developmental delays and psychiatric comorbidity (Schnack & Kahn, Reference Schnack and Kahn2016). From a methodological viewpoint, our analyses were tailored so that meaningful ADHD biotypes could be detected with the given sample size (see online Supplementary Methods).
All participants, including patients and healthy controls, were recruited via advertisements at the hospital, colleges, and websites. Adults interested in the study were first telephone-screened using the Chinese version of the Adult ADHD Self-Report Scale v1.1 (Yeh et al. Reference Yeh, Gau, Kessler and Wu2008). Those identified as probable cases of ADHD by telephone interview were excluded from the study if they had ever received psychotropic treatment before. All other participants were then clinically assessed and diagnosed by a board-certified child psychiatrist (SS Gau) for the presence or absence of ADHD and any other psychiatric disorders. The ADHD diagnosis was further confirmed with the Conners’ Adult ADHD Diagnostic Interview (Conners et al. Reference Conners, Erhardt and Sparrow1999) for current ADHD, and the modified adult version of the ADHD supplement of the Chinese version of the Kiddie-Schedule for Affective Disorders and Schizophrenia–Epidemiological Version (K-SADS-E) for childhood and current ADHD (see online Supplementary Information) (Lin et al. Reference Lin, Yang and Gau2016). Age-matched healthy adult controls without any lifetime diagnosis of ADHD received the same clinical assessments as the ADHD group. Exclusion criteria for all participants included: Any prior systemic medical illness; a history of affective disorders, psychosis, substance use disorder, autism spectrum disorder; current depressive/anxiety symptoms or suicidal ideation; a history of psychotropic treatment, including medication for ADHD; and a full IQ (FIQ) <80, as assessed by Wechsler Adult Intelligence Scale-3rd Edition (Wechsler, Reference Wechsler1997). Of the ADHD participants, 47, 32, and one were diagnosed with the DSM-IV inattentive, combined, and hyperactivity-impulsive subtypes, respectively (Table 1 and Supplementary Table S1). Notably, only 61 adults retained the same subtypes across current and childhood presentations (the childhood subtypes were ascertained using the K-SADS-E).
Demographic and clinical features of the participants

ADHD, attention-deficit hyperactivity disorder; FIQ, full intelligence quotient; PIQ, performance intelligence quotient; VIQ, verbal intelligence quotient; ASRS, Adult ADHD Self-Report Scale; M, male; F, female; R, right; L, left; s.d., standard deviation
a Measured by the Swanson, Nolan, and Pelham, version IV (SNAP-IV) scale
b Estimated by the Euclidian norm (enorm: square root of the sum of squares of the differences in motion derivatives), computed with AFNI's 1d_tool.py
All study procedures were approved by the Research Ethics Committee of the NTUH (201401024RINC; ClinicalTrials.gov number, NCT02642068). All participants provided written informed consent.
Imaging protocols and preprocessing
Neuroimaging data were acquired with a Siemens 3 T Tim Trio scanner using a 32-channel head coil at Advanced Biomedical Imaging Lab of the NTUH. All participants were instructed to relax, clear their mind, and remain still with their eyes closed while undergoing a 7 min 39 s resting-state functional magnetic resonance imaging (rs-fMRI) scan. Wakefulness was checked immediately after the sequence was completed, and all participants denied falling asleep during rs-fMRI scans. The duration of the rs-fMRI sequence was decided to limit the chance of possible fluctuations in participants’ wakefulness and in-scanner motion while allowing the acquisition of sufficient blood-oxygen-level-dependent (BOLD) signal (Van Dijk et al. Reference Van Dijk, Hedden, Venkataraman, Evans, Lazar and Buckner2010; Birn et al. Reference Birn, Molloy, Patriat, Parker, Meier and Kirk2013). Localizer and rs-fMRI scans were obtained first. T1-weighted anatomical scans (MPRAGE pulse sequences) and diffusion spectrum imaging, which was not analyzed here, were acquired thereafter. Functional images were acquired with a multi-echo EPI sequence (repetition time = 2.55 s; flip angle = 90°; matrix size = 64 × 64; in-plane resolution = 3.75 mm; FOV = 240 mm; 31 oblique slices, alternating slice acquisition slice thickness 3.75 mm with 10% gap; iPAT factor = 3; bandwidth = 1698 Hz/pixel; echo time, TE = 12, 28, 44 and 60 msec). Anatomical images were acquired using a T1-weighted magnetization prepared rapid gradient echo (MPRAGE) sequence (repetition time = 2 s; TE = 2.98 msec; flip angle = 9°; matrix size = 256 × 256; inversion time = 900 msec; voxel size = 1 mm3).
These fMRI data permit unique denoising and analyses using multi-echo independent components analysis (ME-ICA v3.0 beta1; www.bitbucket.org/prantikk/me-ica) (Kundu et al. Reference Kundu, Inati, Evans, Luh and Bandettini2012). In comparison to standard single-echo imaging, this approach enhances the signal-to-noise ratio and addresses concerns regarding non-neural confounding factors in fMRI acquisitions, particularly head motion (Kundu et al. Reference Kundu, Voon, Balchandani, Lombardo, Poser and Bandettini2017). Preprocessing was carried out using AFNI v16.1.10 and Python v2.7.11 toolkits. Each individual's denoised EPI was co-registered to their T1 image and then non-linearly normalized to the Montreal Neurological Institute template (3-mm isotropic voxel size). Spatial smoothing was not conducted for the denoised normalized data as per the recommendation by Lombardo et al. (Reference Lombardo, Auyeung, Holt, Waldman, Ruigrok and Mooney2016). The time course was temporally band-pass filtered (0.01~0.1 Hz). Post-hoc analysis showed that levels of framewise displacement (computed using AFNI's 1d_tool.py) did not significantly differ between ADHD and controls (F(1, 201) = 1.462, p = 0.233; Table 1). No participants exhibited extreme levels of head motion (translation and rotation rigid-body realignment estimates were <1.5 mm and <1.5°). ME-ICA are detailed in online Supplementary Methods.
Whole-brain patterns of altered functional connectivity in ADHD
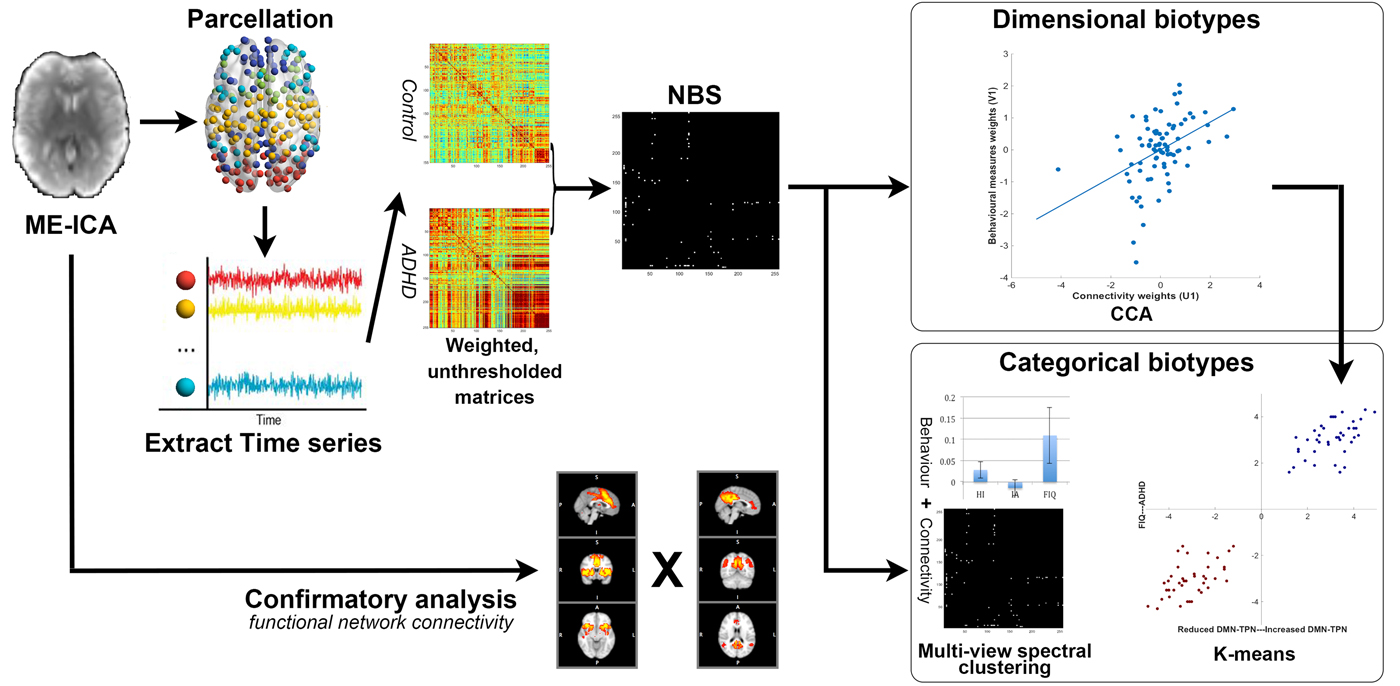
We delineated ADHD biotypes based on distinct patterns of abnormal resting-state connectivity identified by diagnostic group comparisons (ADHD v. controls). We reasoned that biologically meaningful ADHD subtypes would be best characterized by a subset of the whole-brain resting-state connectivity features that comprise group differences between ADHD and controls. A graphic representation of the analysis pipeline is presented in Fig. 1.
Overview of data processing and analysis pipeline. Multi-echo independent component analysis (ME-ICA) was used to denoise eye-closed resting-state imaging data. Functional connectivity matrices were calculated by extracting the average signal time series from validated brain parcellations. The network-based statistic (NBS) was used to assess differences in whole-brain connectivity between 80 drug-naive individuals with attention-deficit hyperactivity disorder (ADHD) and 123 matched healthy controls. Results from the NBS were corroborated by a data-driven functional network connectivity analysis. Following data reduction steps (see text) functional connectivity and behavioral data were used to perform a canonical correlation analysis (CCA). This analysis allowed one to identify hidden relations between resting-state functional connectivity and behavior. The CCA assigns a weight for each functional connection and each symptom such that the level of linear correlation between connectivity and behavioral data across individuals with ADHD is maximized. Permutation testing determined a family-wise error (FWE) corrected p value for this multivariate correlation (i.e., dimensional biotype). Regarding the discovery of categorical biotype, two complementary approaches were employed: (a) k-means clustering was used to test if the individual associations between connectivity and behavior form distinct clusters; (b) multi-view spectral clustering (Kumar & Daumé, Reference Kumar, Daumé, Getoor and Scheffer2011) was implemented using features from symptoms and connectivity (NBS results).

We generated a whole-brain correlation matrix for each participant, based on a well-validated functional brain parcellation (Power et al. Reference Power, Cohen, Nelson, Wig, Barnes and Church2011). Eleven of the originally published 264 nodes (mostly the inferior temporal areas and cerebellum areas, including two regions-of-interest (ROIs) in the DMN; five ROIs in the limbic network; four ROIs in the cerebellum) were excluded from analysis owing to incomplete MRI coverage. We additionally included the bilateral nucleus accumbens, centered at MNI coordinates x = ± 9, y = 9, z = −8 as defined by Costa Dias et al. (Reference Costa Dias, Iyer, Carpenter, Cary, Wilson and Mitchell2015). These ROIs were included for their roles implicated in ADHD. The final parcellation included 255 functional nodes (10-mm-diameter spheres). fMRI time series were extracted from each node by averaging over the representative voxels. The Fisher z-transformation was applied to each correlation coefficient within the matrix.
We employed network-based statistic (NBS) (Zalesky et al. Reference Zalesky, Fornito and Bullmore2010), a validated non-parametric algorithm that controls for multiple comparisons (between all possible edges). NBS was performed on connectivity matrices to identify bivariate patterns of connectivity that differentiated ADHD from healthy controls. NBS is based on the principles underpinning traditional cluster-based thresholding of statistical parametric maps and hence proceeds with a preliminary height threshold (pair-wise connections) followed by a familywise error (FWE)-corrected cluster threshold (topological subnetworks of connections). We used a t-statistic (absolute value) of 3.5 as our initial height threshold (corresponding to p < 0.0005, two-tailed), followed by a conservative FWE corrected p < 0.05 for our pairwise contrasts. This height threshold was decided based on our previous neuroimaging investigation in adult ADHD (Cocchi et al. Reference Cocchi, Bramati, Zalesky, Furukawa, Fontenelle and Moll2012). The inference was performed using permutation testing (10 000 permutations).
To ensure our results are not specific to any particular parcellation template, we repeated the analysis with functional networks constructed using parcellation templates of different resolution and nature (Supplementary Fig. S1). To further test the robustness of our NBS results, we undertook a confirmatory analysis using data-driven group ICA and functional network connectivity (Jafri et al. Reference Jafri, Pearlson, Stevens and Calhoun2008) (see Fig. 1 and online Supplementary Information).
CCA and clustering
CCA is a multivariate statistical method to identify latent, linear relations between combinations of independent and dependent variables (Krzanowski, Reference Krzanowski2000). The first mode represents canonical correlations corresponding to the maximum co-variation between the two sets of variables. Subsequent modes represent maximum residual, orthogonal co-variation. We implemented CCA, in steps similar to those previously reported (Smith et al. Reference Smith, Nichols, Vidaurre, Winkler, Behrens and Glasser2015; Perry et al. Reference Perry, Wen, Kochan, Thalamuthu, Sachdev and Breakspear2017), to identify modes which relate sets of resting-state connectivity patterns to symptom and cognitive measures of ADHD pathology, within the ADHD cohort. Connections composing the altered resting-state network as identified by the NBS were selected as connectivity features within the CCA. Three symptom measures were included in the CCA: factor scores of inattentive and hyperactivity–impulsivity symptoms, and FIQ. As general cognitive functions may modify the clinical presentation of ADHD (Rommelse et al. Reference Rommelse, van der Kruijs, Damhuis, Hoek, Smeets and Antshel2016), moderate its prognosis (Cheung et al. Reference Cheung, Rijdijk, McLoughlin, Faraone, Asherson and Kuntsi2015) and influence its clinical heterogeneity (Fair et al. Reference Fair, Bathula, Nikolas and Nigg2012; Mostert et al. Reference Mostert, Hoogman, Onnink, van Rooij, von Rhein and van Hulzen2018), we included FIQ alongside the two main symptom dimensions of ADHD as the CCA symptom measures. FIQ is advantageous because it represents a parsimonious account of general cognitive functions, and is easily accessible in clinical routines, which was not the case for cognitive measures adopted in earlier attempts of clustering ADHD (Marquand et al. Reference Marquand, Wolfers, Mennes, Buitelaar and Beckmann2016). Statistical significance at FWE-corrected α <0.05 was estimated via 100 000 permutations of the rows of one matrix relative to the other. Technical details regarding the CCA are provided in online Supplementary Methods.
To test the existence of ADHD categorical biotypes, we implemented complementary analysis strategies using the features derived from CCA modes and combined features from connectivity and clinical symptoms. To assess whether the brain–symptom associations identified by the CCA were evenly distributed or clustered in distinct subgroups, we first employed k-means clustering on those linearly projected two-dimensional features by the CCA. To further test the existence of categorical biotypes, we explored joint clustering of connectivity features and symptom features using multi-view spectral clustering. This clustering algorithm maximizes the agreement across clusters identified in different feature spaces (connectivity and symptom) (Kumar & Daumé, Reference Kumar, Daumé, Getoor and Scheffer2011). The existence of valid discrete clusters detected using the k-means method was determined using state-of-the-art robustness measures, including average silhouette width values and the Jaccard similarity (Hennig et al. Reference Hennig, Meila, Murtagh and Rocci2015), as well as the gap statistic (Tibshirani et al. Reference Tibshirani, Walther and Hastie2001). For the multi-view spectral clustering, we considered the convergence of the number of clusters yielded across different similarity thresholds. While there are no clear indications regarding the minimum sample size necessary for clustering analyses, broadly accepted guides (Hennig et al. Reference Hennig, Meila, Murtagh and Rocci2015) argue that our sample size (N = 80) is substantially larger than that required to identify clusters using the number of features we employed. Methodological details regarding clustering algorithms are described in the online Supplementary Methods.
Results
Altered whole-brain resting-state connectivity in medication-naive adults with ADHD
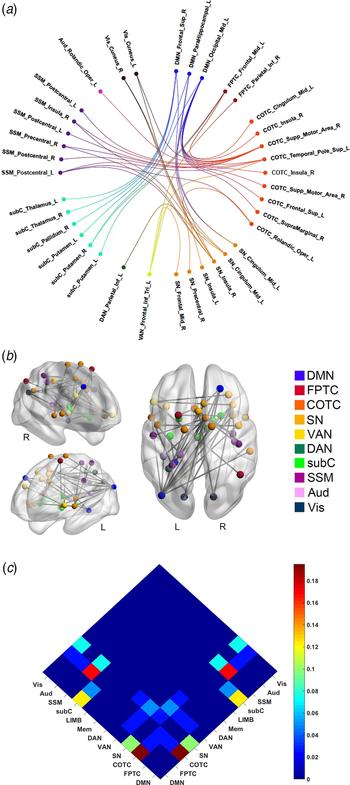
The application of NBS identified one significant brain network that differentiated adults with ADHD from healthy controls (FWE-corrected p = 0.037; Fig. 2 and online Supplementary Tables S2 & S3 for details). The ADHD cohort showed stronger resting-state connectivity in this network compared to controls, with increased correlations between the DMN and frontoparietal network, the DMN and attention networks (including both salience/cingulo-opercular and dorsal attention components), the DMN and subcortical regions, the salience/cingulo-opercular network and sensory-motor and visual network, as well as the salience/cingulo-opercular network and dorsal attention, alongside frontoparietal networks (Fig. 2). Confirmatory analyses using different brain parcellations yielded similar results (online Supplementary Fig. S1).
Group differences in inter-regional functional connectivity. The network-based statistic (NBS) identified a single network differentiating adult attention-deficit hyperactivity disorder (ADHD) from healthy controls. This network was hyper-connected (i.e., higher positive correlations) in ADHD compared with controls. Functional brain networks were designated according to Power and colleagues (Power et al. Reference Power, Cohen, Nelson, Wig, Barnes and Church2011). Moreover, we replicated the results using several alternative brain parcellations (Supplementary Fig. S1). (a) Circular layout of the network distribution. Colors are used to define different brain networks (see below for abbreviations). (b) Topological representation of brain network hyper-connectivity in ADHD compared to healthy controls. (c) The proportion of functional connections affected by ADHD. The number of connections involving each network pair was normalized by a total number of altered pair-wise connections. Adults with ADHD showed the highest positive functional connectivity between (i) the default mode (DMN) and the salience (SN) networks; (ii) the frontoparietal task control network (FPTC) and subcortical (subC) networks. Network nodes and edges (connections) were visualized using BrainNet Viewer (http://www.nitrc.org/projects/bnv/). Circular layouts were generalized with NeuroMArVL (http://immersive.erc.monash.edu.au/neuromarvl/). Networks/modules were assigned based on the community information provided by Power et al. (Reference Power, Cohen, Nelson, Wig, Barnes and Church2011). The anatomical location was identified by the Automatic Anatomical Labeling atlas (http://www.gin.cnrs.fr/en/tools/aal-aal2/) and visual inspection. COTC, cingulo-opercular task control network; VAN, ventral attention network; DAN, dorsal attention network; SSM, somatosensorimotor network; Aud, auditory network; Vis, visual network; Supp, supplementary; R, right; L, left; Sup, superior; Inf, inferior; Mid, middle; Oper, opercular.

In a confirmatory analysis, we repeated the NBS analysis adjusting for subject-specific mean framewise displacements, gender, and age. In line with the original results, this analysis identified one significant brain network showing hyperconnectivity in adults with ADHD compared with healthy controls (online Supplementary Fig. S2). This network was similar to the one detected by our main analysis (Fig. 2).
To test the stability of connectivity differences detected in our analysis, we undertook confirmatory analyses using different search thresholds (T values = 3; 3.3; 3.9) for the NBS. As shown in online Supplementary Fig. S3, the confirmatory NBSs identified similar patterns of hyperconnectivity between (i) the DMN and attention and cognitive control networks, (ii) the DMN and subcortical regions, and (iii) the salience/cingulo-opercular network and sensory processing networks in ADHD compared with healthy controls. Consistent with the effect of increasing the network-forming threshold, these subnetworks become sparser as the serach threshold is increased.
The main NBS results were replicated using an alternative approach to characterize functional brain networks, using maps derived from ICA decomposition of the data rather than a predefined parcellation (Jafri et al. Reference Jafri, Pearlson, Stevens and Calhoun2008). Specifically, results from this additional analysis confirmed that ADHD had stronger connectivity between the DMN and the cingulo-opercular/salience/ventral attention networks compared with the controls (false discovery rate corrected q = 0.044; online Supplementary Fig. S4).
ADHD biotyping
Dimensional biotype
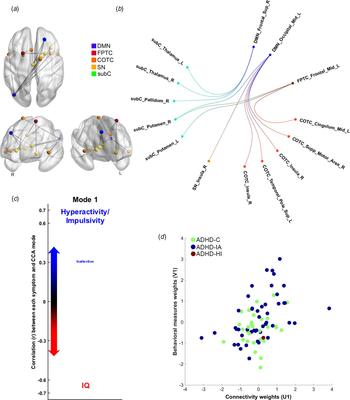
The application of CCA identified one significant mode (r = 0.430, FWE-corrected p = 0.037) of interdependences between functional connectivity patterns and the symptom indices of hyperactivity-impulsivity, inattention, and general cognitive functioning (FIQ) (online Supplementary Table S4a). Specifically, ADHD adults with high symptoms of hyperactivity and impulsivity showed higher resting-state connectivity in a network comprising the strongest increases in positive connectivity in ADHD compared with controls (Fig. 3a). Symptoms of inattention were only mildly positively associated with ADHD hyper-connectivity. On the other hand, general cognitive functions, as indexed by IQ scores, were inversely correlated with greater resting-state connectivity (Fig. 3a). The functional connections expressing the strongest positive associations in this mode (mean r = 0.59, standard deviation = 0.09) involved mainly altered DMN-cingulo-opercular and DMN-subcortical connectivity (Fig. 3b & 3c and online Supplementary Table S5). The additional 2 modes were associated with very small effect sizes (r = 0.18, 0.02, respectively), and did not capture any additional meaningful association between patterns of brain connectivity and symptoms.
Canonical correlation analysis (CCA) and attention-deficit hyperactivity disorder (ADHD) dimensional biotypes. (a) The CCA analysis identified a single significant (FWE-corrected p = 0.037) mode of associations between resting-state connectivity and the behavioral variables of interest. The strength and direction of the variance explained by the CCA mode are indicated in the figure by the vertical position and font size. Adults with ADHD having predominant symptoms of hyperactivity and impulsivity showed higher resting-state connectivity in a network comprising the most (top 25%) hyper-connected edges in ADHD compared with controls (panel b). Conversely, higher cognitive functions (indexed by IQ scores) inversely correlated with (hyper) connectivity in the altered network. Symptoms of inattention were mildly positively associated with resting-state connectivity. (b) Representation of the top 25% node pairs expressed by the CCA mode. (c) This panel represents the circular layout of the top 25% node-pairs. This representation highlights that the majority of hyper-connected edges comprise functional interactions between the default mode (DMN) and the cingulo-opercular task control network (COTC) and subcortical (subC) networks. (d) Participants with different clinical ADHD subtypes were distributed evenly along the one-dimensional axis identified by the CCA. SN, salience network; FPTC, frontoparietal task control network; R, right; L, left; Sup, superior; Mid, middle; Supp, supplementary.

To test whether the CCA was not confounded by head motion, age or gender, we repeated this analysis using the significant subnetwork identified with the NBS in which these confounds were included as nuisance factors. This analysis also yielded one significant mode (r = 0.415, FWE-corrected p = 0.034; online Supplementary Fig. S6), recapitulating the brain–symptom associations detected in the original analysis (Fig. 3).
Categorical biotype
Results of clustering methods failed to show the existence of a non-overlapping ADHD categorical biotype. Specifically, the application of k-means clustering analysis to the CCA weighted symptom and connectivity values favored a dimensional solution over a categorical one. In particular, the value of the clustering index (average silhouette values) was 0.46 for two clusters and 0.49 for three clusters (online Supplementary Table S6), both below the range considered to support a stable cluster solution. Based on the gap statistic (online Supplementary Fig. S7), the suggested optimal number of clusters from the k-means algorithm was one. As shown in online Supplementary Fig. S8a, ADHD participants were evenly distributed without any clear cluster demarcation. In support of this observation, a multi-view spectral clustering analysis using combined symptom and connectivity features also failed to converge to a stable clustering solution (online Supplementary Fig. S8b). The inconsistency in the number of clusters detected across different similarity thresholds indicates that no valid categorical biotypes could be identified for adult ADHD.
Comparison between DSM-IV subtypes and ADHD biotype
NBS and functional network connectivity analyses did not reveal significant differences in resting-state connectivity between the combined (N = 32) and inattentive (N = 47) clinical subtypes of ADHD.
We also assessed how the DSM-IV-defined ADHD clinical subtypes mapped on the brain–symptom dimensional axis revealed by our biotyping analysis. As shown in Fig. 3d, participants with different clinical ADHD subtypes were distributed evenly along the one-dimensional axis identified by the CCA.
Gender effects on ADHD biotype
NBS did not identify significant connectivity differences between males and females with ADHD. As shown in online Supplementary Fig. S9, males and females, regardless the clinical subtypes, were also distributed evenly along the one-dimensional axis identified by the CCA.
Discussion
ADHD is characterized by substantial clinical and cognitive heterogeneity. Here, we questioned whether this childhood-onset adult ADHD heterogeneity could be parsed into dimensional or categorical biotypes. Our multivariate analyses showed that inter-individual differences in brain connectivity, clinical symptoms and general cognitive functioning in ADHD define a dimensional biotype (Fig. 3a). We found no evidence for a categorical definition of adult ADHD. Results from this study support the notion of adult ADHD as a single pathological entity, with altered brain–symptom associations varying across a single dimension or spectrum.
Data from our sample allowed the isolation of ADHD biotypes, which are not confounded by developmental delays, general cognitive dysfunction, history of medication use or confounds related to multi-site experiments. Using state-of-the-art multi-echo rs-fMRI data, we showed reduced functional segregation (i.e., higher positive functional connectivity) between the DMN and attention, alongside cognitive control networks in ADHD compared with healthy controls. One of the most robust findings of the fMRI literature in children and adults with ADHD is the increased functional interplay between the DMN and other networks of the brain, especially the cingulo-opercular/salience/ventral attention networks (Castellanos & Aoki, Reference Castellanos and Aoki2016; Gallo & Posner, Reference Gallo and Posner2016). In healthy controls, these between-network interactions are known to support dynamic switches between internal and external mental processes (Menon, Reference Menon2011). Accordingly, studies have shown that the reduced functional segregation between the DMN and other brain networks correlated with attention and hyperactivity symptoms of ADHD (Cocchi et al. Reference Cocchi, Bramati, Zalesky, Furukawa, Fontenelle and Moll2012). For example, reduced functional segregation between the DMN and cognitive control networks has been linked to inattention (Barber et al. Reference Barber, Jacobson, Wexler, Nebel, Caffo and Pekar2015) and poor inhibitory control (van Rooij et al. Reference van Rooij, Hartman, Mennes, Oosterlaan, Franke and Rommelse2015) in ADHD youths. Also, the pharmacological enhancement of this between-networks functional segregation improves ADHD symptoms (Lin & Gau, Reference Lin and Gau2015). The current study extends these previous findings to a larger sample of medication-naïve adults with clinical ADHD. Both NBS and functional network connectivity analyses show increased interactions between DMN and attention alongside cognitive control networks (especially the salience/cingulo-opercular component), supporting the notion that this deficit represents a key brain signature of ADHD (Castellanos & Aoki, Reference Castellanos and Aoki2016; Cai et al. Reference Cai, Chen, Szegletes, Supekar and Menon2017). We also identified increased connectivity between salience/cingulo-opercular and all other major brain networks, as well as increased connectivity within the salience/cingulo-opercular network in adults with ADHD. This result supports the notion that altered salience network function significantly impacts the balance between brain systems activity supporting external and internal mental processes (Menon, Reference Menon2011), and contributes to the emergence of ADHD symptoms (Castellanos & Aoki, Reference Castellanos and Aoki2016; Cai et al. Reference Cai, Chen, Szegletes, Supekar and Menon2017).
The CCA showed one significant mode of the population variation that links a pattern of brain connectivity to a specific pattern of covariance between core ADHD symptoms and general intelligence. This analysis suggests that the heterogeneity of ADHD symptomatology can be described by a dimensional biotype. Symptoms of hyperactivity–impulsivity and inattention loaded onto positive associations with connectivity patterns in this mode, whereas IQ loaded onto negative associations. This result, despite being correlational in nature, echoes the earlier findings suggesting that preserved cognitive function may act as a protective factor for ADHD symptoms in adults (Cheung et al. Reference Cheung, Rijdijk, McLoughlin, Faraone, Asherson and Kuntsi2015; Rommelse et al. Reference Rommelse, van der Kruijs, Damhuis, Hoek, Smeets and Antshel2016), whereas lower IQ is associated with chronic and persistent symptoms (Cheung et al. Reference Cheung, Rijdijk, McLoughlin, Faraone, Asherson and Kuntsi2015; Keyes et al. Reference Keyes, Platt, Kaufman and McLaughlin2017). Longitudinal studies would be required to better tease out any causal role in these associations. The result that hyperactivity–impulsivity and IQ loaded onto opposing ends of the same axis is in line with previous data on adolescence (Keyes et al. Reference Keyes, Platt, Kaufman and McLaughlin2017) and highlights the presence of this relationship in adulthood. Moreover, the fact that hyperactivity–impulsivity and inattention loaded onto the same CCA axis supports existing work suggesting a mildly positive correlation between these two ADHD symptom dimensions (Willcutt et al. Reference Willcutt, Nigg, Pennington, Solanto, Rohde and Tannock2012). The functional connectivity patterns that were most strongly expressed by this mode included connections between DMN and cingulo-opercular and subcortical brain regions, as well as frontoparietal–subcortical regions. This further supports the proposals derived from healthy cohorts that anti-correlated activity between the DMN and cognitive-control networks underpins optimal brain functions and behaviors (Menon, Reference Menon2011). Together, results from our CCA analysis highlight that a dimensional biotype defined by symptom-connectivity co-variation explains ADHD heterogeneity.
We revisited prior efforts to utilize neuroimaging or behavioral information to assess the existence of distinct subtypes of individuals with ADHD. Existing studies have defined several ADHD subtypes, mostly in the child population, characterized by co-occurring psychiatric symptoms (Acosta et al. Reference Acosta, Castellanos, Bolton, Balog, Eagen and Nee2008), neuropsychological profiles (Fair et al. Reference Fair, Bathula, Nikolas and Nigg2012; Mostert et al. Reference Mostert, Hoogman, Onnink, van Rooij, von Rhein and van Hulzen2018), temperamental features (Karalunas et al. Reference Karalunas, Fair, Musser, Aykes, Iyer and Nigg2014), and functional connectivity patterns (Gates et al. Reference Gates, Molenaar, Iyer, Nigg and Fair2014; Costa Dias et al. Reference Costa Dias, Iyer, Carpenter, Cary, Wilson and Mitchell2015). However, these studies have failed to provide a consistent non-overlapping parcellation of ADHD. Herein, we attempted to identify categorical ADHD biotypes by combining resting-state functional connectivity and symptom data in the largest sample of childhood-onset adult ADHD to date, but found no evidence for categorical biotypes. In keeping with the inconclusive results of previous attempts, our work highlights the difficulty in parsing the clinical heterogeneity of ADHD into non-overlapping categories. Whereas it could be argued that our clinically homogenous sample may have precluded the identification of categorical biotypes, the distribution of the current sample is consistent with demographic features of adults with childhood-onset ADHD (Asherson et al. Reference Asherson, Buitelaar, Faraone and Rohde2016). Likewise, our sample allowed the identification of ADHD-specific brain alterations and biotypes. Future studies may build upon the present results to interrogate the impact of factors such as comorbidity, developmental differences, and medication on the definition of ADHD biotypes. These multi-site endeavors will necessarily require significantly larger samples compared to the present work (Schnack & Kahn, Reference Schnack and Kahn2016). Besides sample characteristics, we acknowledge that our results are linked to the symptoms included, and that we cannot exclude the possibility that ADHD heterogeneity could be parsed using different measures. It is therefore possible that more specific cognitive measures, such as those adopted in previous attempts (Fair et al. Reference Fair, Bathula, Nikolas and Nigg2012; Mostert et al. Reference Mostert, Hoogman, Onnink, van Rooij, von Rhein and van Hulzen2018), may support the co-existence of categorical biotypes.
Intriguingly, we did not identify functional connectivity differences between the DSM-IV subtypes. Moreover, individuals across both clinically defined ADHD subtypes (i.e., combined and inattentive) were distributed evenly along the axis identified by the CCA, highlighting the challenges of clustering ADHD in non-overlapping subgroups (Marquand et al. Reference Marquand, Wolfers, Mennes, Buitelaar and Beckmann2016). Whether our findings could be generalized to recently-identified late-onset ADHD (Faraone & Biederman, Reference Faraone and Biederman2016) or children and adolescents with ADHD awaits further testing.
In the current study, we acquired multi-echo rs-fMRI, which allows direct measurement of T2* relaxation rates to facilitate the disambiguation of brain signals from noise and artifacts based on their different echo time dependence (Kundu et al. Reference Kundu, Inati, Evans, Luh and Bandettini2012). The adopted analysis pipeline (see online Supplementary Methods) has proven effective in denoising fMRI signal from motion and physiological artifacts in task and rest conditions (Kundu et al. Reference Kundu, Voon, Balchandani, Lombardo, Poser and Bandettini2017). Despite advantages of our approach in detecting neural signals, we acknowledge the trade-off in acquiring multi-echo data by sacrificing some levels of spatial and temporal resolutions. Future studies are required to assess if dynamic functional connectivity could provide new insights into the link between brain and behavior in ADHD. For CCA, it is also important to note that, due to its correlational nature, CCA does not allow causal relationships to be inferred between the brain and behavioral variables. Moreover, classic CCA, as implemented here, rests upon the assumptions of normality, which is the case herein. Where such assumptions are violated, variants such as sparse CCA, may be more suited.
Several limitations should be considered in addition to those considered above. The study sample was recruited only from one medical center in Taiwan and excluded patients with comorbid psychiatric conditions and psychotropic exposures. Future studies will need to assess the generalizability of our results to patients with such comorbidities as these are not uncommon in clinical practice. Second, only one participant presented with the hyperactive-impulsive subtype of ADHD. This ratio was consistent with the observation that the hyperactive-impulsive subtype is infrequent in adult ADHD (Asherson et al. Reference Asherson, Buitelaar, Faraone and Rohde2016). Whether this subtype of ADHD fits within the dimensional biotype identified herein would require further testing using a sample skewed to include more patients with this symptom profile. Lastly, although the gender ratio of the current adult ADHD cohort was typical (Asherson et al. Reference Asherson, Buitelaar, Faraone and Rohde2016), the small number of females might have precluded the unequivocal assessment of putative gender effects on biotyping.
In summary, we here provide the first biotyping of medication-naïve adults with ADHD using neuroimaging and symptom data. Results showed that patterns of co-variation between resting-state functional connectivity and clinically tractable symptom measures define a dimensional biotype. Despite the heterogeneity of its clinical presentation, the present work supports the notion of childhood-onset adult ADHD as a unitary disorder. Specifically, our findings highlight the need to consider its dimensional mediators in research and clinical interventions. This view is endorsed by a recent genome-wide association meta-analysis (Demontis et al. Reference Demontis, Walters, Martin, Mattheisen, Als and Agerbo2017). As a whole, our findings support the importance of mapping the link between brain-behavioral phenotypes and clinical diagnosis, echoing the Research Domain Criteria framework to revise clinically defined constructs using a neurobiologically informed dimensional approach (Cuthbert, Reference Cuthbert2015).
Supplementary material
The supplementary material for this article can be found at https://doi.org/10.1017/S0033291718000028
Acknowledgements
This work was supported by the Ministry of Technology and Science, Taiwan (MOST103-2314-B-002-021-MY3), the National Health Research Institutes, Taiwan (NHRI-EX103-10008PI), and National Taiwan University Hospital (NTUH103-S2458, NTUH104-S2761). The overseas fellowship of H.-Y.L. is supported by the Ministry of Technology and Science, Taiwan (grant no. 106-2918-I-002-019), and the National Taiwan University Hospital, Taipei, Taiwan. L.C. is supported by the Australian National Health Medical Research Council (grant no. APP1099082, APP1138711).
Declaration of interest
The authors declare no relevant conflict of interest.
Ethical standards
The authors assert that all procedures contributing to this work comply with the ethical standards of the relevant national and institutional committees on human experimentation and with the Helsinki Declaration of 1975, as revised in 2008.