Implications
Genetic selection for muscle growth has altered many characteristics of the modern poultry. The pectoralis muscle of the volant species are composed of type IIA and IIB fibers for flight; whereas, the domestic chickens have almost entirely type IIB fibers. This study showed that the heavy weight quail line has a muscle hypertrophy characterized by a larger size of type IIA fibers and a greater proportion of larger type IIB fibers compared with the random bred control line. This implies that fiber size and type should be considered as markers for selecting superior Japanese quail lines with greater growth rates and a proportionally greater breast muscle.
Introduction
The poultry industry strives to improve genetic selection for efficiency in growth and carcass performance (Lopez et al., Reference Lopez, Schilling and Corzo2011). However, genetic selection for muscle growth and muscling in poultry has altered many characteristics of the modern commercial bird, especially the breast muscle (Chiang et al., Reference Chiang, Booren and Strasburg2008). Generally, broiler-type chickens that have a greater muscle mass tend to exhibit a greater number and size of muscle fibers in the pectoralis muscle than layer-type chickens (Scheuermann et al., Reference Scheuermann, Bilgili, Tuzun and Mulvaney2004).
The avian pectoralis muscle provides most of the power required for flight and makes up as much as 7% to 27% of the body mass (Tobalske and Dial, Reference Tobalske and Dial2000). The pectoralis muscle of growth selected chickens is composed of almost entirely type IIB fibers; whereas, the volant species, including quail, are composed of type IIA and IIB fibers (Tobalske et al., Reference Tobalske, Olson and Dial1997; Rosser et al., Reference Rosser, Wick, Waldbilling, Wright, Farrar and Bandman1998). Thus, the muscle fiber characteristics of the pectoralis muscle match the daily activity patterns of different avian species (Rosser et al., Reference Rosser, Wick, Waldbilling, Wright, Farrar and Bandman1998), and the diversity of fiber type composition in relation to the diversity of flight behaviors is demonstrated across bird species (Kovacs and Meyers, Reference Kovacs and Meyers2000).
The heavy weight (HW) quail has been developed by selection for 4-week body weight (BW) from the random bred control (RBC) quail for over 40 generations (Nestor et al., Reference Nestor, Bacon and Lambio1982 and Reference Nestor, Bacon, Velleman, Anderson and Patterson2002). The body and pectoralis muscle weights of HW quail have been shown to be more than twice that of the RBC quail (Nestor et al., Reference Nestor, Bacon, Velleman, Anderson and Patterson2002), which is accompanied by a higher amount of total DNA mass and increased fiber sizes (Choi et al., Reference Choi, Sarah, Shin, Wick, Kim and Lee2013b). The objectives of this study were to characterize the muscle fibers in the pectoralis major muscle, focusing on fiber types and total fiber number, and to provide a new avian model with increased muscle mass for future studies in the general muscle biology area.
Material and methods
Animals and muscle samples
Fertile eggs from RBC and HW quail lines were obtained from the Ohio Agricultural Research and Development Center of The Ohio State University in Wooster (OH, USA). Fertile eggs from the RBC and HW quail lines were incubated. Twelve hours after hatching, quail chicks from each line were weighed and reared in heated Petersime battery brooders. Chicks were maintained in battery cages categorized by each line. All treatments and experimental procedures were the same, and quail were fed a commercial diet in accordance with the National Research Council (1998). At 42 days of age, seven quail from each line (total of 14 birds) were randomly selected and weighed. Quail were individually weighed and euthanized following standard procedures (FASS, 1999). The breast muscle was exposed, the connective tissue removed and the entire right pectoralis major muscle was excised and weighed. All animals were handled in compliance with the Institutional Animal Care and Use Committee policies and guidelines at The Ohio State University.
The area of the pectoralis major muscle was measured at the diagonal line of 1/2 of a point in the pectoralis major muscle (Supplementary Figure S1 A) using the method reported by Scheuermann et al. (Reference Scheuermann, Bilgili, Tuzun and Mulvaney2004). Muscle samples were taken from the mid-point on the diagonal line (Supplementary Figure S1 A-2, and were then immediately frozen in isopentane cooled by liquid nitrogen and stored at –80°C until the analysis of muscle fiber characteristics could be performed. Color differences between the superficial (away from the pectoralis minor muscle and bone) and deep (close to the pectoralis minor muscle and bone) regions were measured with a Minolta Chroma Meter (CR-300, Minolta Camera Co., Japan; Supplementary Figure S1 B). The superficial region of the RBC or HW quail lines exhibited a greater value of lightness (L *) than the deep region of the RBC or HW quail lines (48.53 v. 31.39 or 53.67 v. 23.68, respectively). Thus, the percentage of the pectoralis major muscle made up of each region, superficial and deep, was measured; and muscle samples were taken from each of these regions for histochemical analysis.
Histochemical analysis
Serial transverse muscle sections (10 μm) were obtained from each sample using a cryostat (CM1850, Leica, Germany) at –25°C, then mounted onto glass slides. The myosin ATPase activity of the samples was detected following pre-incubation with acid (pH 4.7) or alkaline (pH 10.7; Lind and Kernell, Reference Lind and Kernell1991). Muscle fibers were classified as types IIA or IIB (Supplementary Figure S1 C) using the nomenclature system of Brooke and Kaiser (Reference Brooke and Kaiser1970). Unfixed muscle sections were pre-incubated at room temperature for 10 min in a buffer consisting of 100 mM potassium chloride in 100 mM sodium acetate, and adjusted to pH 4.7 or pH 10.7. Sections were then washed for 30 s in a buffer containing 20 mM glycine (pH 9.4) and 20 mM CaCl2 and subsequently incubated at room temperature for 25 min in a buffer containing 40 mM glycine (pH 9.4), 20 mM CaCl2 and 2.5 mM ATP disodium salt. Muscle sections were washed for 30 s in 1% CaCl2 then kept in 2% CoCl2 for 3 min, and then washed for 30 s in distilled water. Muscle sections were finally immersed in 1% yellow ammonium sulfide solution for 30 s, washed in distilled water and then, embedded in glycerol jelly. All histochemical samples were examined using an optical microscope equipped with a CCD color camera (IK-642 K, Toshiba, Japan) and a standard workstation computer that controlled the image analysis system (Image-Pro Plus, Media Cybernetics, L.P., USA). All portions of the sections analyzed were carefully handled to avoid tissue disruption and freeze-damage. Approximately 600 fibers were evaluated per sample.
The cross-sectional area (CSA) of the muscle fibers was determined as the ratio of the total area measured divided by the total number of fibers. The mean CSA of each fiber type was also measured by taking the mean of x numbers of fibers. Muscle fiber density (fiber number/mm2) was calculated from the mean number of fibers/mm2. The total number of fibers was determined by multiplying the fiber density by the area of pectoralis major muscle. The fiber density and total number of each fiber type were also measured. The area percentage of each fiber type was calculated as the ratio of the total CSA of each fiber type divided by the total fiber area measured ×100. The number percentage of each fiber type was calculated as the ratio of the total number of each fiber type divided by the total fiber numbers measured ×100.
Statistical analysis
The GLM procedure was performed for the association between quail lines using the SAS software (SAS Institute, 2004). Significant differences of values between lines were detected by the probability difference, and the mean values were separated at the level of 5%. The results for the lines are presented as least squares means together with the standard errors.
Results
Body and pectoralis major muscle weights
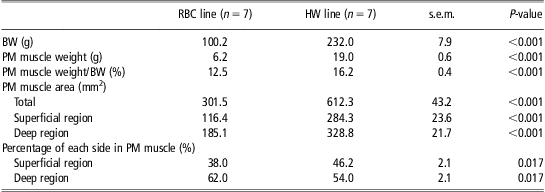
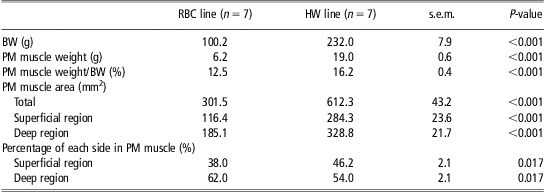
The BWs and pectoralis major muscle characteristics of the different quail lines are presented in Table 1. The body and pectoralis major muscle weights at 42 days of age were more than two times greater in the HW quail line than the RBC quail line (P < 0.001). The pectoralis major muscle of the HW line made up a greater percentage of BW than that of the RBC line (P < 0.001). The HW quail line had a greater area of the pectoralis major muscle than the RBC quail line (P < 0.001). Moreover, the areas of the superficial and deep regions were greater in the HW quail line compared with the RBC quail line (P < 0.001). However, the RBC quail line exhibited a higher percentage of the deep region (P = 0.017) and a lower percentage of the superficial region (P = 0.017) in the area of pectoralis major muscle than the HW quail line.
BW and PM muscle characteristics of the different quail lines at 42 days of age
BW = body weight; PM = pectoralis major; RBC = random bred control; HW = heavy weight.
Muscle fiber characteristics
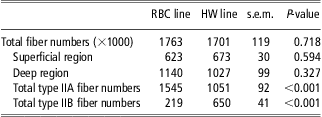
Tables 2 and 3 show the histochemical characteristics of the pectoralis major muscle on the different quail lines and muscle regions. The total numbers of fibers in the pectoralis major muscle were similar between the RBC and HW lines (P = 0.718; Table 2). The total fiber number of the superficial region (P = 0.594) or deep region (P = 0.327) was also similar between the two lines (P > 0.05). However, the HW line had higher total IIB fiber numbers (P < 0.001) and lower total type IIA fiber numbers (P < 0.001) compared with the RBC line.
Muscle fiber numbers of the pectoralis major muscle on the different quail lines at 42 days of age
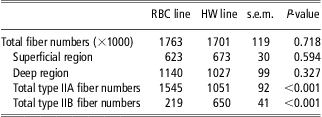
RBC = random bred control; HW = heavy weight.
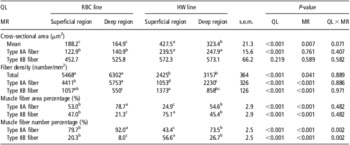
Muscle fiber characteristics of the pectoralis major muscle on the different QLs and MRs at 42 days of age

QL = quail line; MR = muscle region; RBC = random bred control; HW = heavy weight.
a–dDifferent superscripts in the same row represent significant differences (P < 0.05).
Greater mean fiber CSA (427.5 and 323.4 v. 188.2 and 164.9 μm2, P < 0.05) and type IIA fiber CSA (239.5 and 247.9 v. 122.9 and 140.9 μm2, P < 0.05) were observed in the superficial and deep regions of the pectoralis major muscle of the HW line compared with that of the pectoralis major muscle of the RBC line (Table 3). There were no significant differences in muscle fiber CSA between the superficial and deep regions within each line, with the exception of the mean CSA in the HW line. Mean fiber CSA of the deep region showed a significant difference from that of the superficial region in the HW line (P = 0.007). The RBC quail line had a higher total fiber density than the HW quail line (6006 v. 2811 fibers/mm2, P < 0.001). The type IIB fiber density was higher in the HW quail compared with the RBC quail (1115 v. 804 fibers/mm2, P < 0.001). The deep region of the RBC line had the highest type IIA fiber density (P < 0.05), and had a lower type IIB fiber density than the superficial region of the RBC line (P < 0.05).
It is generally accepted that the superficial region exhibits a greater proportion of type II fiber and a higher glycolytic capacity than the deep region within the same muscle in the pig (Choi and Kim, Reference Choi and Kim2009), rat (Rosser et al., Reference Rosser, Norris and Nemeth1992), tiger and cheetah (Hyatt et al., Reference Hyatt, Roy, Rugg and Talmadge2010). In this study, the deep region within the pectoralis major muscle of the RBC quail exhibited the highest area (P < 0.05) and number percentage (P < 0.05) of type IIA fibers (Table 3). In the percentage of type IIB fiber, the deep region of the RBC line had a lower area (P < 0.05) and number percentage (P < 0.05) than the deep region of the HW line. The superficial region of the HW quail showed a lower number percentage of type IIA fiber (P < 0.05) and a higher area percentage of type IIB fibers (P < 0.05) than the superficial region of the RBC quail. However, the superficial region of the RBC line tended to show a similar fiber type composition compared with the deep region of the HW line.
Discussion
The poultry industry is of great economic importance in the United States as well as in Europe. Poultry production and consumption have increased rapidly, and the per capita consumption of poultry meat is expected to continue to grow because of consumer demands and the perceived health benefits of poultry meat (Petracci et al., Reference Petracci, Bianchi and Cavani2009). Thus, the poultry industry continues to strive to improve growth rates and breast meat yields to produce bigger animals in a shorter period of time (Remignon et al., Reference Remignon, Zanusso, Albert and Babile2000; Chiang et al., Reference Chiang, Booren and Strasburg2008; Lopez et al., Reference Lopez, Schilling and Corzo2011). Meat-type chickens reach market weight as early as 6 weeks old, and have high breast meat yields (Fanatico et al., Reference Fanatico, Pillai, Emmert and Owens2007). In this study, the HW quail line had more than twice the BW (P < 0.001) and the pectoralis major muscle weight was three times heavier (P < 0.001) than the RBC quail line because of the results of selection.
Skeletal muscle is composed of muscle fibers, thus muscle mass is determined by the number and size of muscle fibers (Rehfeldt et al., Reference Rehfeldt, Henning and Fiedler2008; Choi et al., Reference Choi, Nam, Choe, Ryu, Wick, Lee and Kim2013a). Both the number and size of fibers are influenced by different breeds and selection for greater muscle growth as shown in the chicken (Remignon et al., Reference Remignon, Gardahaut, Marche and Ricard1995), turkey (Cherel et al., Reference Cherel, Hurtrel, Gardahaut, Merly, Magras-Resch, Fontaine-Perus and Wyers1994) and quail (Fowler et al., Reference Fowler, Campion, Marks and Reagan1980). For example, broiler-type chickens harboring a greater muscle mass tend to exhibit a higher number (muscle fiber hyperplasia) and a larger size (muscle fiber hypertrophy) of muscle fibers in the pectoralis major muscle than layer-type chickens (Aberle and Stewart, Reference Aberle and Stewart1983; Scheuermann et al., Reference Scheuermann, Bilgili, Tuzun and Mulvaney2004). In this study, the HW line having a higher muscle weight exhibited a greater mean fiber CSA (P < 0.001) and type IIA CSA (P < 0.001) than the RBC line. Moreover, the HW line exhibited a higher number of type IIB fibers than the RBC line (P < 0.001), although there were no significant differences in the total number of fibers between the RBC and HW lines (P = 0.718).
Type IIA fibers tended to locate to the inside of the muscle bundle and be surrounded by larger type IIB fibers in both regions of the pectoralis major muscle in the RBC line (Supplementary Figure S1 C-1 and -2) or the HW line (Supplementary Figure S1 C-3 and -4). A similar finding was reported by Choi and Kim (Reference Choi and Kim2009), who suggested that many skeletal muscles have a unique distribution of fibers, where type I and IIA fibers are grouped in clusters that are surrounded by type IIB fibers. The fiber pattern of the pectoralis major muscle in quail is similar to the pattern observed in the pigeon, with the pigeon showing thin red muscle fibers that are surrounded by a few thick white muscle fibers in the muscle bundle (Kiessling, Reference Kiessling1977; Tobalske et al., Reference Tobalske, Olson and Dial1997; Rosser et al., Reference Rosser, Wick, Waldbilling, Wright, Farrar and Bandman1998).
In the case of the volant species, the pectoralis major muscles of small birds are composed exclusively of fast-twitch oxido-glycolytic fibers, also known as type IIA fibers (Welch and Altshuler, Reference Welch and Altshuler2009). The higher proportion of type IIA fiber in the pectoralis major muscle suggests an evolutionary adaptation for powering and sustaining the relatively high contraction frequencies associated with flapping flight in small birds (Welch and Altshuler, Reference Welch and Altshuler2009). Type IIB fibers fatigue quickly and produce a series of very rapid and powerful contractions, and are predominate in the pectoralis major muscle of non-migratory species, such as the pheasant (Sokoloff et al., Reference Sokoloff, Ryan, Valerie, Wilson and Goslow1998). Moreover, type IIB fibers are significantly larger than type IIA fibers at the same age because of the growth rate of type IIB fibers (Ruusunen and Puolanne, Reference Ruusunen and Puolanne2004). The growth rate of type IIB fibers is approximately two times faster than that of type I or IIA (Ruusunen and Puolanne, Reference Ruusunen and Puolanne2004). In the red jungle fowl (Gallus gallus), slow-twitch fibers are clearly evident in the pectoralis major muscle; whereas, only fast-twitch fibers are present in the pectoralis muscle of the meat-type chicken (Tobalske et al., Reference Tobalske, Olson and Dial1997). Hence, animals selected for their growth rate produce muscles with a higher percentage of larger type IIB fibers (Ruusunen and Puolanne, Reference Ruusunen and Puolanne2004). Moreover, the HW quail line exhibited greater rates of the total DNA mass (10.3 v. 4.0-fold) and pectoralis major muscle weight (33.0 v. 12.9-fold) between 4 and 15 days post-hatch compared with the RBC quail line (Choi et al., Reference Choi, Sarah, Shin, Wick, Kim and Lee2013b). These differences in the DNA contents and muscle weights between the two quail lines indicate a difference in hypertrophic potential of muscle fibers (Choi et al., Reference Choi, Sarah, Shin, Wick, Kim and Lee2013b). The results from the current study support this notion. In the current study, the CSA of the type IIB fibers was more than two times greater than the CSA of the type IIA fibers in the RBC line (P < 0.001) or HW line (P < 0.001). The superficial region of the pectoralis major muscle had a higher percentage of type IIB fiber and was higher in the HW line compared with the RBC line (P < 0.05). Thus, the HW quail exhibited a higher number percentage of type IIB fiber (P < 0.001) and a lower number percentage of type IIA fiber (P < 0.001) than the RBC quail. The HW quail also showed a higher area percentage of type IIB fibers than the RBC quail (P < 0.001), although there were no significant differences in the CSA of type IIB fibers between the RBC and HW quail (P = 0.219).
The pectoralis major muscle of the HW quail line was three times heavier than the pectoralis major muscle of the RBC quail line; whereas, the area of the pectoralis major muscle and fiber CSA were approximately two times greater in the HW quail line compared with the RBC line. This discrepancy can be explained by finding that the pectoralis major muscle of the HW line is longer and wider than that of the RBC line (Supplementary Figure S1 A). An increase in the muscle fiber length occurs through the addition of new sarcomeres and is associated with the muscle mass (Rehfeldt et al., Reference Rehfeldt, Henning and Fiedler2008). Consequently, the greater body and muscle weights seen in the HW quail line are mainly because of the increased ratio of type IIB to IIA fibers and the increased CSA of type IIA fibers compared with the RBC quail line. Taken together, these data indicated preferential development of fiber toward more numbers of larger type IIB fibers and the muscle fiber hypertrophy during muscle development of the HW quail line, rather than the muscle fiber hyperplasia, which could contribute to increased muscle mass and BWs in the HW quail line.
The potential for muscle growth of an animal largely depends on the number of prenatally formed muscle fibers, because postnatal increase in muscle fiber size is limited by genetic and physiological reasons (Rehfeldt et al., Reference Rehfeldt, Henning and Fiedler2008). Both the number and size of fibers are positively correlated with growth rate and muscle mass (Ryu et al., Reference Ryu, Rhee and Kim2004; Rehfeldt et al., Reference Rehfeldt, Henning and Fiedler2008). Therefore, selection for increased live weight and muscle fiber characteristics, especially the total fiber number and increased type IIB fiber proportion, is a good way to improve the growth performance of the Japanese quail.
Acknowledgments
This project was supported by Agriculture and Food Research Initiative Competitive Grant no. 2010-65206-20716 from the USDA National Institute of Food and Agriculture, the National Research Foundation of Korea and the Agenda Program no. PJ008587 from the Rural Development Administration of Korea.