


Introduction
Glaciers that surge apparently do so cyclically, that is, they surge at regular intervals in time (Reference Meier and PostMeier and Post, 1969). It does not appear likely that surges occur by chance in an ordinary glacier at irregular intervals. (Fast-moving outlet glaciers of ice sheets are an exception to this generalization. These glaciers can be considered to be in a permanent state of surging (Weertman in discussion to Reference Meier and PostMeier and Post, 1969, p. 816).) In this paper we consider two problems: why surging glaciers surge in a cyclic fashion and what triggers the surges. Our solution to the problems is based on the assumption that the sliding velocity of a glacier can be a double- (or multiple-) valued function of the basal shear stress. Several mechanisms that lead to double-valued functions have been proposed in the past. A process that can trigger surges, which involves reversed or stationary water flow at the base of a glacier, is presented in this paper.
Important field observations on several surging glaciers
Although considerable interest exists in the problem of glacier surges, a satisfactory series of measurements of the major parameters governing the motion of a surging glacier is not likely to be made for some time. However, various observations of a more limited range of parameters are available for a few surging glaciers. An informative set of measurements was made on the profile of Finsterwalderbreen in Spitsbergen (Reference LiestølLiestøl, 1969). These observations are made even more useful when they are combined with the gravity-based depth measurements of the lower two-thirds of this glacier (Reference Husebye, Husebye, Sørnes and WilhelmsenHusebye and others, [1965]).
Figure 1a shows the surface profiles of Finsterwalderbreen in the years 1898, 1920 and 1964 (Reference LiestølLiestøl, 1969). The lower surface profile (Reference Husebye, Husebye, Sørnes and WilhelmsenHusebye and others, [1965]) is also shown in this figure. Figure 1b shows a plot of the approximate value of the basal shear stress τ versus distance along the axis of the glacier. The approximate value of the basal shear stress is given by the well-known equation

where ρ is the density of ice, g is the gravitational acceleration, h is the ice thickness, and α is the slope of the upper ice surface. (The true value of the basal shear stress τ * is given by Equation (1) with the addition of a term containing the longitudinal stress existing in the glacier. The stress τ also can be corrected with the hydraulic radius correction factor. For a typical glacier this correction factor reduces the basal shear stress calculated from Equation (1), or Equation (14), by a factor of about 0.7.) The values of h and α used to calculate the curves in Figure 1b are values averaged over distance intervals of 0.5 km.

Only one surge has occurred in Finsterwalderbreen since observations have been made on it. We believe that the form of the 1898 profile will develop again around 1980 to complete one cycle in its history. We believe the five surface profiles presented by Reference LiestølLiestøl (1969) represent stages, separated 14–22 years apart, of one surge cycle.
Consider certain features of the results given in Figure 1. The surge occurred in some unknown year (or years) between 1898 and 1920. In 1920 the term τ was equal to 0.6 bar in the lower 5 km of the glacier and was equal to 0.8 bar in the next 5 km up-stream. If allowance is made for the accumulation and ablation of snow and ice between the time of the surge and the 1920 measurement, the term τ must have been equal to or less than about 0.7 bar in the first 10 km from the snout of the glacier immediately after the surge. This result agrees with the conclusion of Reference Meier and PostMeier and Post (1969): “The active phase of the surge appears to end when the stress component ρgh sin α, or the total bed shear stress, reaches a certain low value.”
After the surge the value of τ in the upper zone of Figure 1 (5–10 km from the end of the glacier) gradually increases with time. By 1964 the mean value of τ in this zone was about 1 bar. In the “stagnant” region of the lower zone, that is, the first 3 km of the glacier, the value of τ everywhere decreased with time.
From 3 to 5 km from the end of the glacier, a region we term the “trigger zone”, the value of τ remained constant from 1920 to 1964. However, in 1898, shortly before the last surge of the glacier, τ had reached the large value of about 1.7 bar.
A study of the profiles of Muldrow Glacier in Alaska published by Reference PostPost (1960) leads to similar conclusions about the behaviour of τ for this surging glacier (see Fig. 2). Unfortunately, a bedrock profile is not available for Muldrow Glacier and only estimates of it can be made.

It appears likely that in the trigger zone of this glacier, at a distance of 15–21 km from the end of the glacier, the term τ also was of the order of 1.7 bar before the last surge.
The examples of Finsterwalderbreen and Muldrow Glacier fit another general conclusion of Reference Meier and PostMeier and Post (1969): “During the quiescent phase, the ice reservoir thickens. When the glacier becomes sufficiently thick and steep at the lower part of the reservoir, the component of the basal shear stress ρgh sin α apparently reaches a critical value and the surge begins.”
Theory
Stress change shortly after a surge
The behaviour of a surging glacier during the quiescent phase can be understood readily if the assumption is made that at the end of the surge the basal shear-stress component τ along that portion of the glacier which has surged takes on an approximately constant value τ 0, and that this value is relatively small.
The thickness h at any point x along a glacier (x is measured from the end of the glacier in a horizontal direction, as shown in Figure 3) at a time t after a surge is given by

where h
0 is the value of h immediately after the surge, ȧ is the rate of accumulation or ablation (ȧ is a positive quantity under accumulation conditions and a negative quantity under ablation conditions),  is the longitudinal rate of extension (a positive quantity) or compression (a negative quantity) of the glacier, u is the horizontal velocity component of ice in the x direction at the upper ice surface, and v is the vertical ice-velocity component at the bottom surface (v is positive in value when motion is upwards). If no ice melts or water freezes at the bottom surface the vertical velocity v is equal to u
s
β, where β is the slope of the bed of the glacier (assumed to be small in this paper), and u
s is the sliding velocity of the glacier. If melting or freezing takes place, the velocity v is decreased or increased by an amount equal to the rate of melting or freezing. All the quantities h, h
0, u, etc. may depend on x. For the glacier shown in Figure 3, the velocities u and u
s are negative quantities for normal ice motion towards the snout of the glacier.

The surface slope α at time t after a surge is given by

where α 0 is the value of α immediately after the surge. The derivation of Equations (2) and (3) requires that β be small, but not necessarily smaller than α. For simplicity of exposition, it will be assumed hereafter that the terms v and dv/dx in Equations (2) and (3) are small compared to the other terms in these equations and can be neglected.
By combining Equations (2) and (3), the following equation is found for τ

where ȧ′ = dȧ/dx.
For a period of time after a surge both  and u will be relatively small in value. Only when the glacier flow recovers will they again become important quantities in Equation (4). During the period of time when these two quantities are small the basal shear-stress component τ is given by the approximate equation

The derivative ȧ′ usually is a positive quantity over most of the length of a glacier. (The accumulation rate increases, perhaps slowly, with distance above the firn line and the ablation rate increases, perhaps slowly, with distance below the firn line.) Thus above the firn or equilibrium line (defined in this paper as the position x = x f at which ȧ′ = 0), where ȧ′ is a positive quantity, the term τ increases with time, according to Equation (5). The term τ also increases with time in the region immediately below the firn line in which the expression (ȧα 0+h 0 ȧ′) is a positive quantity. However, near the glacier snout this expression must become negative because α 0 remains finite but h 0 approaches zero in value. Thus near the snout the basal shear-stress component τ decreases in value with time. In other words, the ice in the snout region becomes stagnant. The term τ remains constant with time at that place in the ablation zone where ȧ = −h 0 ȧ′/α 0.
Let us assume that the accumulation or ablation rate ȧ is a function only of the elevation H above a horizontal reference surface (see Fig. 3). Thus, immediately after a surge the derivative ȧ′ is given by ȧ′ = (dȧ/dH) α 0. The position along a glacier (in the ablation zone) which separates the regions of increasing and decreasing basal shear-stress component τ occurs where where ȧ = −h 0 dȧ/dH. The distance Δx below the firn line at which ȧ takes on this value is given by Δx = h 0/α 0, where h 0 and α 0 are the values of these quantities for x ≈ x f. The difference in elevation between the upper ice surfaces at the firn line and at the position below the firn line that separates increasing and decreasing values of τ is thus approximately equal to h fo where h fo is the ice thickness at the firn line. For Finsterwalderbreen this predicted elevation drop is around 200 m and on Muldrow Glacier it is about 500 m. The predicted elevation drop agrees with that actually observed for Finsterwalderbreen (see Fig. 1), Not enough information is available to make a comparison with Muldrow Glacier. The position for which τ does not change with time occurs in the trigger zone in both Finsterwalderbreen and Muldrow Glacier. On a steep, and hence thin, glacier we expect that the trigger zone must be very close to the firn line.
Our discussion and the results presented up to this point lead to the conclusion that after a surge the stresses within the upper part of a cyclically surging glacier increase with time; hence the flow of ice in this region gradually becomes more active. But the lower part of the glacier becomes increasingly more stagnant. It is interesting to note that Reference LiestølLiestøl (1969) has measured surface movements of 30 m a−1 in the firn area of Finsterwalderbreen over about the last 15 years but he has found movements of only a few centimetres per year in the lowest part of this glacier.
Equation (5) explains why the lower part of a glacier becomes more stagnant and the upper part more active as time goes by after a surge. It does not explain readily why τ reaches an anomalously high value (see Fig. 1b) in the trigger zone before the next surge starts. The more accurate Equation (4) likewise does not permit an easy insight into the cause of the anomalously high value of τ.
Detailed observations related to the surging of Lednik Medvezhiy reported by Reference Dolgushin and OsipovaDolgushin and Osipova (in press) show a pattern of velocity distribution similar to that inferred for Finsterwalderbreen, including variations of velocity with time and distance along the glacier. Lednik Medvezhiy has a short surge cycle, about 13 years. It is a thin glacier of about 140 m thickness with a large surface slope of about 5–6°. It surged last in 1963. The profile measured in 1970 has a region with a built-up surface slope that separates dead ice from active ice. However, the profile measured in 1962, the year before its last surge, does not have such a “step” on its surface. The basal shear stress (as calculated by us from the 1962 profile) increases rapidly from a value of zero at the snout, where the ice thickness is zero to about. 1.5 bar at a distance of 200 m from the snout where the ice thickness is about 70 m and the surface slope is of the order of 11°. Inequality (13) is satisfied for this rate of change of basal shear stress. However, it is unlikely that, these calculations are significant because they are made for a region of the glacier in which the ice thickness increases very rapidly with distance up the glacier and the trigger zone, if one indeed exists, must be only of the order of 50 m in width.
Anomalously high basal shear stress in trigger zone
We now give a qualitative explanation of how an anomalously high value of τ might develop in the trigger zone. Our explanation is based on two results from glacier mechanics. The first, and very well known, of these results is that if the length L of an active glacier is specified and if the maximum shear stress τ
m that can be supported at the base of the glacier is given, the total volume V of ice within the glacier is essentially determined. The volume V is approximately proportional to the expression  .
The second result (Reference WeertmanWeertman, 1961) is that the length of a glacier in a steady-state condition is fixed once the average accumulation and ablation rates and the position of the firn line are given. Let x f be the position of the firn line, ȧ c be the average value of the accumulation rate in the accumulation zone, and ȧ b be the average value of the ablation rate in the ablation zone. Under steady-state conditions, L is given by

For a mountain glacier x f is a relatively insensitive function of h f, the thickncss of ice at the firn line (Reference WeertmanWeertman, 1961).
A cyclically surging glacier must satisfy the following equation, which is the analogue of Equation (6)

where T is the period of one surge cycle. In Equation (7), L, x f, ȧ b, and ȧ c all can be functions of time. Were Equation (7) not satisfied, a cyclically surging glacier would not return to the same state after a surge.
It follows directly from Equation (7) that if x f is a relatively insensitive function of h f, L i < L < L 0, where L i is the length of a glacier before a surge starts, L is the length of the glacier in a steady-state condition, and L 0 is the length of the glacier immediately after a surge.
Consider now with the aid of Figures 4, 5 and 6 the changes in thickness and length during one cycle of a surging glacier. For the sake of emphasizing some results we start with a glacier in a steady-state condition, although we believe surging glaciers never attain a profile for steady-state flow.


Curve A of Figure 4 shows schematically the longitudinal profile of a steady-state glacier of length L. The basal shear stress for this glacier is τ
m. Suppose that by some unspecified mechanism the basal shear stress for the steady-state glacier is rapidly reduced in magnitude to the value τ
0. A reduction in the value of the basal shear stress causes a steady-state glacier to surge (Reference Campbell and RasmussenCampbell and Rasmussen, 1969). Actually, Campbell and Rasmussen reduced the bed-friction coefficient in their theory. The new length L
0 is of the order of 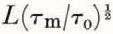 because the volume of the glacier will not change appreciably during the surge.
The glacier profile now is given by curve B of Figure 4. In the accumulation area the glacier thickness is reduced but it is still larger than the thickness of a steady-state glacier with a basal shear stress τ 0. (The profile of a steady-state glacier with a basal shear stress τ 0 is indicated by curve C in Figure 4. The length of this glacier is approximately equal to but slightly less than L.)
Next suppose the mechanism which required that the basal shear stress be reduced to the value τ 0 is turned off immediately after the surge. Assume that the basal shear stress can rise in magnitude to the value τ m and, over short periods of time, to even higher values. Suppose the accumulation and ablation rates are given by the schematic curve shown in Figure 5 as a solid line. Thus in the regions above and below the firn line the accumulation rate and the ablation rate are almost constant in value. (We will consider later the case in which these two rates do vary with distance along the glacier.)
Figure 6 shows glacier profiles D and E that are produced in time periods after a surge when the assumptions just made are valid. These profiles can be deduced from Equations (2) and (3). It should be noted that terms such as uα and  h which appear in these equations can be ignored at first because ice flow is relatively inactive immediately after a surge. We assume that the glacier flow is inactive until the basal shear approaches the value τ
m.
In the ablation zone h decreases in value. As a consequence, the basal shear stress also decreases, since α remains roughly constant in value. In the accumulation zone h increases in value and so does the basal shear stress (but α remains roughly constant in value). When the basal shear stress finally becomes approximately equal to τ m, the ice thickness in the accumulation zone, as shown by profile E, is greater than that of a steady-state glacier. That such is the case can be deduced from the fact that immediately after a surge the accumulation area surface slope of profile B must be smaller than that of the steady-state glacier of profile A whose basal shear stress is equal to τ m. Since the surface slope does not change appreciably in the accumulation zone as the glacier profiles trace a history from profiles B to D to E, the ice thickness for profile E must be larger than that of profile A if the basal shear stress for both (in the accumulation area) is equal to τ m.
The basal shear-stress component given by Equation (1) is plotted, schematically, in Figure 7 for the profile E of Figure 6. A large increase in this basal shear-stress component develops near the firn line because of the “step” which develops on the surface there. Note that in this region the derivative dȧ/dx is not equal to zero, whereas it essentially vanishes elsewhere (for the solid curve of Figure 5). Plastic flow of ice in this region can of course spread the “step” over a greater distance in the longitudinal direction and reduce the maximum value of the term τ.

Now let us relax the assumption that ȧ varies only very slowly with distance in the accumulation and ablation areas. Let it vary as shown schematically by the dashed curve in Figure 5. The derivative ȧ′ of the accumulation rate or ablation rate is assumed to be positive over the whole glacier. Let this derivative be represented by the symbol ȧ′c in the accumulation zone and by ȧ′b in the ablation zone.
In the accumulation zone both h and α will increase with time after a surge has occurred. Thus the term τ given by Equation (1) will reach the magnitude τ m at a smaller ice thickness than would be the case when ȧ′c ≈ 0. However, provided that

where h s and α s are the thickness and slope of the steady-state glacier with basal shear stress equal to τ m, the thickness of the glacier when τ = τ m will be greater than that of the steady-state glacier. (Inequality (8) is derived from Equation (5) under the assumption that α s is so small that sin α 0 ≈ α 0 and sin α s ≈ α s.)
The time T required for the thickness to attain a value for which τ = τ m is of the order of

This time should be about the same as the period of a cyclically surging glacier.
Whether the basal shear-stress component in the ablation area increases or decreases depends on the magnitude of ȧ′b. If

the basal shear stress in the ablation zone will continue to decrease with time. As long as the derivative ȧ′b satisfies Inequality (10), conditions are met for the production of a stagnant zone at the end of a cyclically surging glacier. (A weaker restriction on ȧ′b is sufficient to ensure the existence of a stagnant zone. It is necessary only that it be in the accumulation area that the stress τ first reaches the value τ m. Thus it is possible to have τ increase rather than decrease in the ablation area of a glacier which has surged and still observe a stagnant zone in the ablation area between surges.)
Now suppose that the mechanism which caused the basal shear-stress component τ to be reduced from the value τ m to τ 0 is turned on again once τ approaches the value τ m over most of the accumulation zone. The glacier once more will increase its length by reducing its thickness in the accumulation zone and surging forward in the ablation zone. The glacier profile may again approximate that of profile B of Figure 4. (Profile B was obtained from a glacier originally in a steady-state condition. A glacier that has gone through many surge cycles probably has a volume immediately after a surge that is somewhat different from the volume of a steady-state glacier. Its profile after a surge thus would differ somewhat from profile B.)
When the basal shear-stress component τ becomes comparable to τ m, terms such as uα in Equations (2), (3) and (4) become important. Nevertheless, the result that the upper part of a cyclically surging glacier becomes active some time after a surge while the lower part remains relatively stagnant is not likely to be altered by the increased importance near the beginning of the next surge of terms such as uα.
The triggering mechanism
A critical assumption for the history of events pictured in Figures 4 and 6 is that a surge starts when the glacier suddenly flows so easily that it must lower its basal shear stress to the value τ 0. Such behaviour seems inexplicable unless the sliding velocity of a glacier under certain circumstances can be a double or multiple function of the basal shear stress.
Two problems are involved (Reference Meier and PostMeier and Post, 1969) in explaining surges through a double-or multiple-valued sliding velocity function. The first and easier problem is finding a mechanism that permits the sliding velocity to be very much greater than normal (without changing the value of the basal shear stress). The second and harder problem is explaining how this mechanism is triggered into action.
Reference RobinRobin (1955) has suggested that a surge occurs when a cold glacier warms up at its bed. His mechanism appears capable of accounting for the surge of Rusty Glacier in the Yukon (Reference Clarke and ClassenClarke and Classen, 1970). We do not believe, however, that it can account for the observed surges in large glaciers whose bottom surfaces probably never are cold.
Other mechanisms have been proposed for surges (Reference WeertmanWeertman, 1962, Reference Weertman1966, Reference Weertman1969; Reference LliboutryLliboutry, 1969; Reference NielsenNielsen, 1969; Reference RobinRobin, 1969; Reference Rubin and BarnesRobin and Barnes, 1969). We will not consider the relative merits of these mechanisms in the present paper. We note that two of the mechanisms, those of Lliboutry and of Weertman, depend on the presence of water at the base of a glacier. We will assume in what follows that the fast-sliding velocity of surging glaciers does require a water “lubrication” at the glacier bed.
It is not enough to have a mechanism that permits a glacier to slide with a fast surge velocity. An explanation must be presented of how this mechanism is triggered to start the surge. We now show how a water-lubrication mechanism can be triggered.
The theories of glacier sliding (Reference WeertmanWeertman, 1957, Reference Weertman1964; Reference LliboutryLliboutry, 1964–65, Reference Lliboutry1968; Reference NyeNye, 1969, Reference Nye1970; Reference KambKamb, 1970) all contain the result that the hydrostatic pressure at the base varies on a local scale between high-pressure regions and low-pressure regions. The water which flows out from underneath a glacier should be confined in the regions of lower pressure. According to the theories of Kamb, Nye and Weertman, the greater the basal shear stress which produces the sliding, the lower is the pressure in the local low-pressure zones. (The Lliboutry theory of sliding is, in his words, “… more complex, and it involves not well known quantities, and does not allow straightforward computations” (his discussion to Reference WeertmanWeertman, 1969, p. 943). We are, therefore, not certain if his theory predicts that an increase in the basal shear stress always leads to a reduction of pressure in the low-pressure zones. Nevertheless, his theory requires, and he was the first to predict, that most of the water at the base of a glacier is under a hydrostatic pressure less than the ice overburden pressure.)
Reference WeertmanWeertman (1972) has inferred from the theories of Reference KambKamb (1970) and Reference NyeNye (1969, Reference Nye1970) that an approximate value for the hydrostatic pressure P in the water which flows at the base of a glacier is given by the following equation

where ζ is a dimensionless measure of the roughness and G is a dimensionless term that depends on ζ. Typical values of G lie between 1 and 1.5 (Reference KambKamb, 1970, fig. 4) and typical values of ζ lie between 0.01 and 0.05 (Reference KambKamb, 1970, table 2), The term  is of considerable magnitude. For τ = 1 bar, G = 1.3 and ζ = 0.01, its value is about 10 bar.
The generalized pressure gradient P g in the longitudinal direction which drives water towards the snout of a glacier consists of the gradient of the pressure given by Equation (11) plus the gradient of gravitational potential energy. The generalized pressure gradient thus is equal to

where ρ w is the density of water. When α and β are small in value, this equation reduces to

When P g is positive in value, water flows in the negative x direction in Figure 3 (that is, towards the snout of the glacier). If P g were to be negative in value, water would flow “up-hill”, away from the snout.
According to Equation (12b), the pressure gradient P g will become a negative quantity whenever

From Figure 7 it can be seen that the gradient of τ is positive in value and the largest in magnitude in the region we have termed the trigger zone of a glacier which is just about to surge. Inequality (13) is satisfied in the trigger zone for the 1898 profile of Finsterwalderbreen (see Fig. 1) and for the 1952 profile of Muldrow Glacier (see Fig. 2). (It is assumed that G = 1.3 and ζ = 0.01. The inequality is not satisfied if ζ = 0.05.)
Figure 8a and b illustrates our conception of how a surge is triggered. Figure 8a shows a plot of the basal shear stress versus the distance x shortly before a surge starts. The basal shear stress rises from a small value in the stagnant snout region to the value τ m in the upper part of the glacier. (In Figure 8a we show the basal shear stress without a maximum value, such as we found from the 1898 profile of Finsterwalderbreen, in order to emphasize the fact that up-hill water flow does not necessarily require the existence of a peak value in this stress. Up-hill water flow requires only that the basal shear stress rises at a sufficiently rapid rate.) Figure 8b shows the glacier profile at this instant in time. Indicated in the figure are directions of water flow under different parts of the glacier. Where Inequality (13) is satisfied, the water flows up-hill into a region, called the “collection zone”, in which the inequality turns into an equality. In this region P g ≈ 0. Because P g ≈ 0 in the collection zone, this region acts as a “dam” to water flowing down-hill from above it. Most of the water that gathers in the collection zone will come from the higher region rather than from the lower region.

Water cannot collect indefinitely in the P g ≈ 0 zone. As more water collects, the glacier becomes better “lubricated” in this region and is able to slide more easily. Once this region does begin to slide quickly, large quantities of water are produced from the frictional heat of sliding. Suppose, as is likely for Finsterwalderbreen some time after 1898, a zone 1–2 km long begins to slide with a fast velocity of 3–10 km a−1, which is a fast surge velocity; ice will be melted off the bottom surface at the rate of 1–3 m a−1. In other words, as much ice is melted off a 1 km length of the surging glacier as is melted by geothermal heat off a glacier of length of 200–600 km!
Figure 8c shows a plot of the basal shear stress in the next development towards a surge. The ease of sliding in the collection zone of Figure 8b leads to a reduction of the basal shear stress in this zone. The burden of supporting the glacier is thrown to the regions of the bed on either side of the zone of easy sliding. The basal shear stress on either side thus is increased and a tensile stress is set up within the glacier in the region immediately above the fast slip zone and a compressive stress in the region immediately below it. (Let σ be the average longitudinal tensile (or compressive) stress set up in a transverse cross-section of the glacier. The basal shear stress is given by

where the symbol τ * is used to distinguish the total basal shear stress from just the component ρgh sin α. The stress σ is a positive quantity for a tensile stress and a negative quantity for a compressive stress. The increase in τ * on either side of the region of easy sliding follows directly from Equation (14).)
The tensile stress σ in the region immediately above the zone of easy sliding causes the glacier to be stretched in longitudinal creep flow. Thus the ice thickness h is reduced in this zone. This thinning, as well as the increase in τ * produced by the term d(σh)/dx in Equation (14), shifts the zone in which P g ≈ 0 up the glacier. The zone in which up-hill water flow occurs eventually will be destroyed, because the ice thickness is increased in the stagnant zone by the compressive stress. The shear stress in the stagnant zone is increased, which in turn eventually leads to a decrease in the derivative dτ */dx.
Figure 8d shows the glacier profile at a later stage during the surge. Figure 8e shows the basal shear stress associated with this profile. A zone in which the pressure gradient P g is small but now is finite in value continues to move up the glacier. This zone no longer accumulates ever increasing amounts of water. Nevertheless, it contains much water because P g ≈ 0 and water can move through it only if the average thickness of the water there is relatively large. The sliding velocity in this region is high. As a result, a large amount of water is produced here which later flows into the lower portion of the glacier. The lower portion thus is lubricated and consequently it too can slide quickly.
Eventually the surge stops because the P g ≈ 0 zone has travelled up the glacier as far as it can. Furthermore, the basal shear stress in the surging portion of the glacier is lowered, through the extension of the glacier and subsequent decrease of both h and α over most of the glacier, to such a low value that fast-sliding velocities on longer are possible even over a well-lubricated bed.
Velocity at which the Pg ≈ 0 zone moves up a glacier
A rough estimate of the velocity with which the P g ≈ 0 zone of Figure 8d runs up the glacier can be made as follows. The region immediately above the step in the glacier surface of Figure 8d has an ice thickness Δh greater than the region below the step. (A typical value of Δh for a large surging glacier is 100 m.) An average tensile stress σ of the order of ρgΔh must exist in the region immediately above the step because in the region Pg ≈ 0 the basal shear stress is appreciably smaller than ρgh sin α. The tensile stress can be expected to decrease from this value σ ≈ ρgΔh to a negligible value over a distance up the glacier equal to 1 or 2 times the thickness h of the glacier. Thus, according to Glen’s creep law, the rate of thinning of the glacier immediately above the P g ≈ 0 zone is of the order of B(ρgΔh) n , where n = 3.2 and B = 0.038 bar− n a−1 (Reference GlenGlen, 1955). The time required for a length of glacier equal to h to decrease its thickness by an amount Δh is equal to Δh/hB(ρgΔh) n . The velocity with which the step of Figure 8d moves up the glacier thus is of the order of hB(ρgΔh) n . For Δh = 100 m and h = 300 m, this velocity is 13 km a−1. Thus a step moves with a velocity which is similar to a fast-surge velocity.
Discussion
The cyclic surge model we have just presented depends on two features. After a surge the lower end of a glacier must become increasingly stagnant while the upper end must become increasingly active. This behaviour is ensured if the ablation rate is not too strong a function of distance along the glacier.
At the junction between the stagnant and active ice, a region we call the trigger zone, a gradient in the basal shear stress can be set up which in turn can lead to a gradient in the water pressure at the base of the glacier which causes water to be dammed up in the trigger zone. The water may even flow up-hill. (We emphasize the fact that the up-hill flow of water is not essential to the model. The only essential feature is that the pressure gradient must become very small or even zero in order that relatively large amounts of water can accumulate in the trigger zone.)
We believe our model also is capable of explaining surges in small glaciers and in tributary glaciers of large glaciers which have surged. In small glaciers the gradient in the basal shear stress may satisfy Inequality (13), or satisfy (13) as an equality, at some stage in its history over a major fraction of its length. In other words, the whole glacier may become a trigger zone. (In the case of a large glacier, it is impossible to have Inequality (13) satisfied, or (13) satisfied as an equality, over a major fraction of the length of the glacier and still have reasonable values of the basal shear stress over the same length.)
As a surge on a large glacier passes the point where a tributary glacier flows in, Inequality (13) could be satisfied over the end of the tributary glacier. Thus the tributary glacier might be triggered into surging by the same mechanism that caused the main glacier to surge. On the other hand, a surge in a tributary glacier might be caused directly by the high tensile stress as well as high basal shear stress which is set up in it when the surface of the surging trunk glacier is lowered rapidly (Reference RobinRobin, 1969; Reference Rubin and BarnesRobin and Barnes, 1969; Weertman in discussion to Reference RobinRobin, 1969).
One objection can be raised to the damming action of water we have used in this paper. We are assuming that the water melted from the bottom surface is not drained away into stream channels at the base of the glacier in the region in which water damming occurs. This assumption can be partly justified. One of us (Reference WeertmanWeertman, 1972) has shown that it is very unlikely that water melted at the glacier bed will move into Röthlisberger channels. (A Röthlisberger channel is an ice tunnel filled with water at the base of a glacier. The creep flow of ice tends to close it up. It is kept open by the melting of ice from its walls. Energy dissipated in moving water supplies the heat which produces the melting of ice.) It is possible and even likely that melt water from the upper surface of a glacier will drain out of the glacier through Röthlisberger channels that pass through the P g = 0 zone of Figure 8b. This water flow is separated from the flow of water melted from the bottom surface of the glacier and it does not affect the damming action discussed in this paper. In the later stages of a surge it is doubtful that Röthlisberger channels can remain open in an ice mass that is subjected to such intense plastic deformation.
If a well-developed and closely spaced network of Nye channels exists in the trigger zone, there is some doubt that water can be dammed in the manner we have envisaged. (Nye channels are cut downwards into the bedrock at the base of a glacier.) Tributary Nye channels are very efficient collectors of water melted from the bottom surface of a glacier (Reference WeertmanWeertman, 1972). However, an excess supply of water saturates the carrying capacity of Nye channels, thus, even if a Nye-channel network does exist, the possibility remains that the damming action can take place.
The reader probably is aware at this stage that our “theory” of cyclic surging is in large part a phenomenological one. We cannot prove from first principles that a cyclically surging glacier seeks to have Inequality (13) satisfied, or to have it satisfied as an equality, in the trigger zone just before a surge starts. We used field evidence in support of our use of this inequality. In order to prove the validity of its importance to the triggering of surges, we would require at least a semi-quantitive theory of the effect of water lubrication on the sliding velocity of glaciers. (The theory of one of us (Reference WeertmanWeertman, 1969) could be used for this purpose. However, unless this theory gains wider acceptance or is markedly improved by application of a Nye–Kamb analysis of glacier sliding, there does not seem to be too much point in attempting at this time to develop a detailed theory with it as a basis.) Our theory could be improved considerably if account could be taken of the ice-flow terms  , u and v that appear in Equations (2), (3) and (4). In other words, the effect of phenomena such as travelling waves that move into the ablation zone and increase the ice thickness there should be included in a complete theory.
We do feel that the theory of this paper has pointed to the possible crucial role that a gradient in basal shear stress may play in causing water to accumulate under a glacier and to start it to surge by lubricating a trigger region. This crucial role can be tested, possibly proved, and certainly disproved if incorrect, from rather easy to obtain glacier profiles. Unlike most surge theories which have been proposed so far, it is a theory with which the field glaciologist may come to grips.
Acknowledgements
One of us (J.W.) did most of his work on this paper while spending a sabbatical year at the Scott Polar Research Institute on a Guggenheim Fellowship. He thanks the John Simon Guggenheim Memorial Foundation as well as Northwestern University for financial support, and the Scott Polar Research Institute for their kind and invigorating hospitality. We are indebted to Professor L. D. Dolgushin for giving us an unpublished typescript that describes results found for Lednik Medvezhiy, and to Dr W. S. B. Paterson for many helpful comments.



