
Introduction
The design of novel strategies and optimization of thermal and mechanical treatments of metallic glasses is important for accessing a broad range of states with improved physical and mechanical properties [Reference Liu and Maass1]. It is generally accepted that an elementary plastic event in disordered solids involves a collective rearrangement of a small group of atoms or a shear transformation [Reference Argon2, Reference Spaepen3]. Owing to lack of crystalline order, the plastic deformation of metallic glasses typically occurs through highly localized shear bands, which leads to catastrophic failure [Reference Egami, Iwashita and Dmowski4]. In recent years, a number of methods were proposed to enhance plasticity of metallic glasses, such as addition of chemical heterogeneities [Reference Park and Kim5, Reference Kim, Ahn, Lee, Park and Lee6] or a soft second phase [Reference Sarac and Schroers7]. A less intrusive way to tune the amorphous structure is to apply cryogenic thermal cycling that can induce rejuvenation due to heterogeneity in the local thermal expansion and therefore improve plasticity [Reference Ketov, Sun, Nachum, Lu, Checchi, Beraldin, Bai, Wang, Louzguine-Luzgin, Carpenter and Greer8, Reference Greer and Sun9, Reference Song, Meng, Wu, Cao, Wang, Liu, Wang and Lu10, Reference Grell, Dabrock and Kerscher11, Reference Guo, Yamada and Saida12, Reference Ketov, Trifonov, Ivanov, Churyumov, Lubenchenko, Batrakov, Jiang, Louzguine-Luzgin, Eckert, Orava and Greer13]. Using atomistic simulations, it was recently shown that internal stresses due to thermal expansion can in principle trigger a plastic event in sufficiently large systems [Reference Shang, Guan and Barrat14].
It was originally demonstrated using molecular dynamics (MD) simulations that the effects of annealing and aging on atomic glasses can be reversed by mechanical rejuvenation, which expels the system from the deep energy minimum [Reference Utz, Debenedetti and Stillinger15]. Later, it was found that a single subyield cycle overages the glass by decreasing its potential energy, whereas a shear cycle with large strain rejuvenates the glass and increases its potential energy [Reference Lacks and Osborne16]. More recently, a number of studies have explored the influence of periodic shear deformation on the energy states, particle dynamics, and mechanical properties of amorphous materials [Reference Priezjev17, Reference Fiocco, Foffi and Sastry18, Reference Regev, Lookman and Reichhardt19, Reference Priezjev20, Reference Regev, Weber, Reichhardt, Dahmen and Lookman21, Reference Priezjev22, Reference Priezjev23, Reference Leishangthem, Parmar and Sastry24, Reference Priezjev25, Reference Fan, Wang, Zhang, Liu, Schroers, Shattuck and O’Hern26, Reference Priezjev27, Reference Priezjev28, Reference Blank-Burian and Heuer29]. In particular, it was shown by athermal quasistatic simulations that, following a number of training cycles, the glassy systems evolve into periodic limit cycles, where particle trajectories become exactly reversible, despite large-scale collective displacements during each cycle [Reference Regev, Lookman and Reichhardt19, Reference Regev, Weber, Reichhardt, Dahmen and Lookman21]. Most recently, the structural relaxation in binary glasses subjected to periodic temperature variations below the glass transition was investigated using MD simulations [Reference Priezjev30]. It was found that the potential energy after one hundred cycles acquires a distinct minimum as a function of the thermal cycling amplitude, which correlates with the largest yield stress at the same amplitude [Reference Priezjev30]. It remains unclear, however, whether these results depend on the number of thermal cycles and details of the thermal treatment protocol.
In this work, we carried out MD simulations to study the effect of thermal cycling on the evolution of the potential energy and mechanical properties of binary glasses. The amorphous samples were initially prepared by cooling across the glass transition to a low temperature with different rates. It will be shown that after a number of transient cycles, binary glasses attain low energy states and the particle dynamics becomes nearly reversible. We find that the minimum of the potential energy after one thousand cycles and the maximum of the stress overshoot and elastic modulus occur at the same thermal cycling amplitude.
This article is structured as follows. The description of MD simulations including parameter values, annealing procedure, and temperature variation protocol are given in the next section. The numerical results for the potential energy time series, nonaffine displacements, and mechanical properties are presented in section “Results”. The conclusions and outlook are provided in the last section.
MD simulations
In this study, we consider a binary (80:20) mixture model to represent a bulk metallic glass. This model was originally introduced by Kob and Andersen (KA) [Reference Kob and Andersen31] and its parametrization is similar to the model proposed by Weber and Stillinger to describe the amorphous metal alloy Ni80P20 [Reference Weber and Stillinger32]. In the KA model, the interaction between any two atoms of types α, β = A, B is specified by the truncated Lennard-Jones (LJ) potential,
 $${V_{\alpha \beta }}\left( r \right) = 4{\varepsilon _{\alpha \beta }}\left[ {{{\left( {{{{\sigma _{\alpha \beta }}} \over r}} \right)}^{12}} - {{\left( {{{{\sigma _{\alpha \beta }}} \over r}} \right)}^6}} \right]\quad ,$$
with the following values of the LJ parameters: εAA = 1.0, εAB = 1.5, εBB = 0.5, σAA = 1.0, σAB = 0.8, σBB = 0.88, and m A = m B [Reference Kob and Andersen31]. The cutoff radius for the LJ potential is set to r c,αβ = 2.5σαβ throughout the study. For clarity, we express all physical quantities in terms of the reduced LJ units of length, mass, energy, and time as follows: σ = σAA, m = m A, ε = εAA, and  $\tau = \sigma \sqrt {{m / \varepsilon }}$. The system consists of 48,000 large atoms of type A and 12,000 small atoms of type B, and, hence, the total number of atoms is N tot = 60,000. For each configuration of atoms, the total force on each atom from its neighbors was computed using Eq. (1), and the atom positions and velocities were advanced using the velocity Verlet algorithm [Reference Allen and Tildesley33] with the time step Δt MD = 0.005τ [Reference Plimpton34].
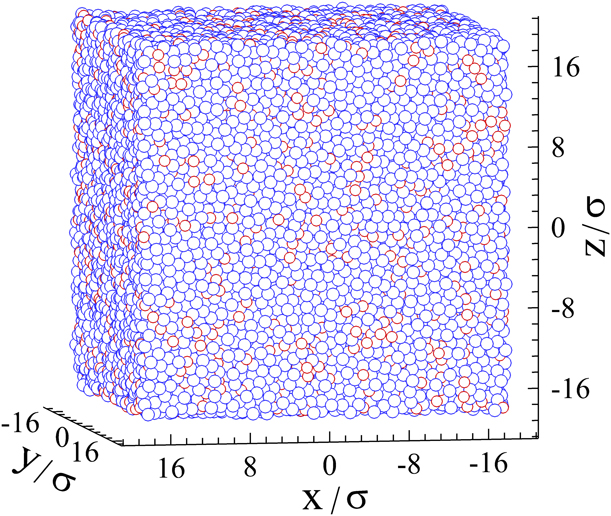
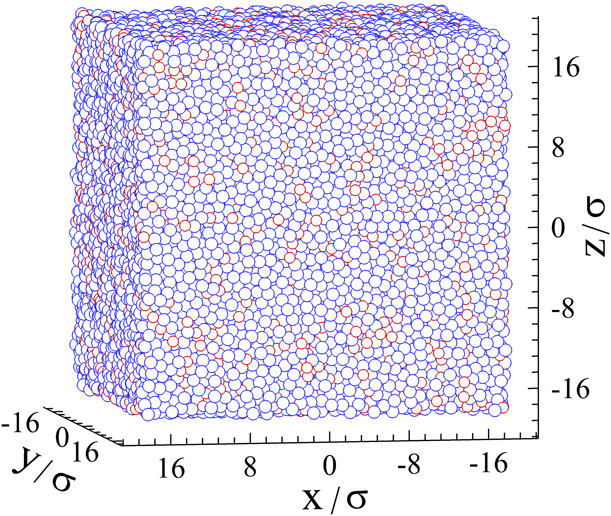
We next briefly describe the annealing process and the temperature variation protocols. First, the system was allowed to equilibrate in a periodic box at zero pressure and temperature of 0.7ε/k B. This temperature is well above the glass transition temperature of the KA model T g ≈ 0.435ε/k B at the atomic density ρ = ρA + ρB = 1.2σ−3 [Reference Kob and Andersen31]. The temperature, indicated by T LJ, was maintained by the Nosé–Hoover thermostat with a damping term [Reference Allen and Tildesley33, Reference Plimpton34]. Following the equilibration procedure, the binary mixture was annealed into the glass phase with the cooling rates 10−2 ε/k Bτ, 10−3 ε/k Bτ, 10−4 ε/k Bτ, and 10−5 ε/k Bτ. A representative snapshot of the simulated system is shown in Fig. 1 for the cooling rate of 10−2 ε/k Bτ. Next, the temperature was varied piecewise linearly with the maximum values T LJ = 0.1ε/k B, 0.2ε/k B, 0.25ε/k B, 0.3ε/k B, 0.35ε/k B, and 0.4ε/k B with respect to the reference temperature of 10−2 ε/k Bτ. The period of thermal cycling was set to T = 5000τ. The postprocessing analysis was performed using accumulated data for the system dimensions, temperature, pressure components, potential energy, and atomic configurations.
A snapshot of the binary Lennard-Jones glass (60,000 atoms) after annealing from a liquid state to the temperature T LJ = 0.01ε/k B with the cooling rate of 10−2 ε/k Bτ. Atoms of types A and B are indicated by large blue and small red spheres, respectively.
Results
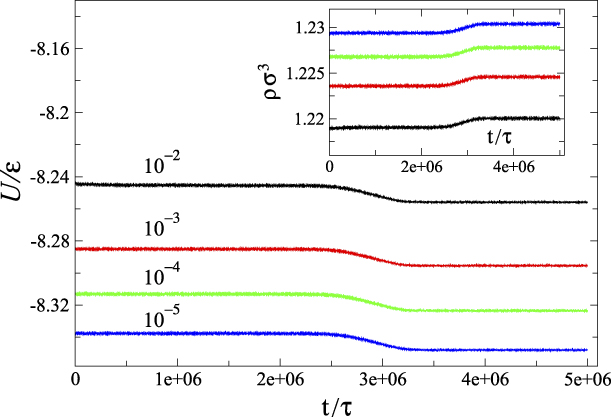
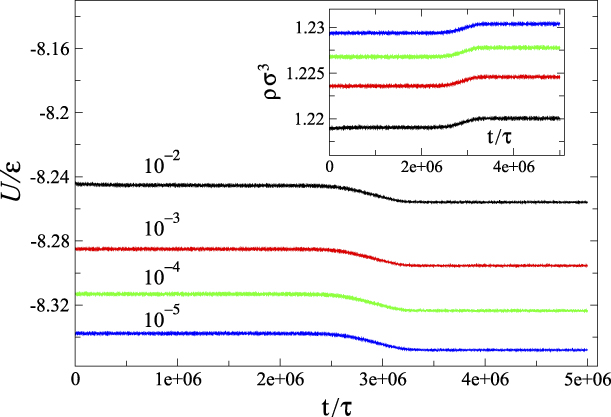
We begin the discussion of the results by presenting in Fig. 2 the time dependence of the potential energy for binary glasses annealed across the glass transition to T LJ = 0.01ε/k B with cooling rates 10−2 ε/k Bτ, 10−3 ε/k Bτ, 10−4 ε/k Bτ, and 10−5 ε/k Bτ and aged at this temperature during the time interval of 5 × 10⁶ τ. As is evident, the potential energy levels become lower when cooling is slower, because the system has more time to explore various minima in the potential energy landscape when approaching the glass transition temperature. This effect was repeatedly observed in MD simulations of glass formers annealed below the glass transition temperature [Reference Ediger and Harrowell35]. Somewhat surprisingly, it can be seen in Fig. 2 that in all cases, the potential energy remains nearly constant during 2.5 × 10⁶ τ and then gradually crosses over to slightly lower levels during the time interval of about 106 τ. The inset in Fig. 2 shows that the decrease in energy is accompanied with densification of glasses, because simulations are carried out at constant pressure. The analysis of the atomic structure, based on the pair distribution functions, did not reveal any crystallization or enhanced short range order after samples become denser (not shown). We comment that most of the long-time MD simulations of the KA model were performed either at constant volume or near T g, where the effect presented in Fig. 2 is absent [Reference Kob and Barrat36]. In the future, it might be instructive to perform a more careful analysis of the structure during aging process at constant pressure and low temperature.
The time dependence of the potential energy per atom, U/ε, at T LJ = 0.01ε/k B and P = 0 during the time interval of 5 × 10⁶ τ. The glasses were initially prepared with the cooling rates of 10−2 ε/k Bτ (black), 10−3 ε/k Bτ (red), 10−4 ε/k Bτ (green), and 10−5 ε/k Bτ (blue). The time evolution of the average density for the same samples is shown in the inset. The initial cooling rates are 10−2 ε/k Bτ, 10−3 ε/k Bτ, 10−4 ε/k Bτ, and 10−5 ε/k Bτ (from bottom to top).
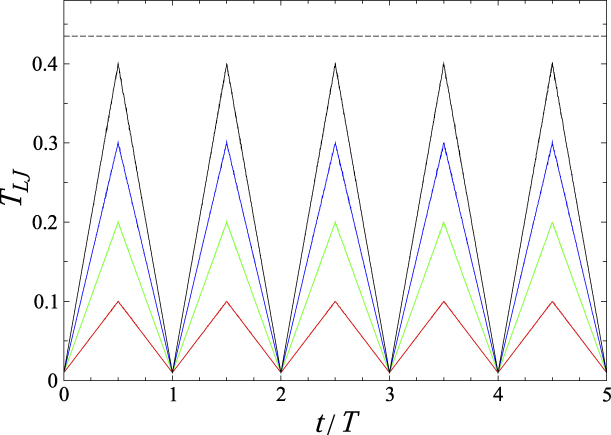
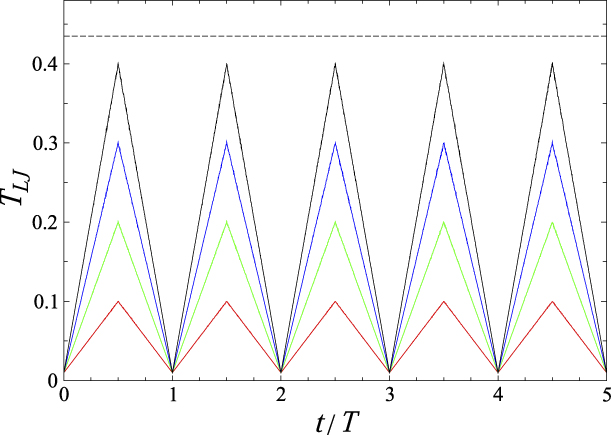
As described in the previous section, the glasses were first annealed at constant pressure to the low temperature of 0.01ε/k B with cooling rates 10−2 ε/k Bτ, 10−3 ε/k Bτ, 10−4 ε/k Bτ, and 10−5 ε/k Bτ. The thermal treatment was then applied by repeatedly heating and cooling the samples during 1000 cycles with the period T = 5000τ. Examples of the temperature profiles measured during the first five cycles are presented in Fig. 3. During each cycle, the system gradually expands upon heating to the maximum temperature T LJ and then cooled with the effective rate of about 2T LJ/T. When the glass temperature become higher, the probability of thermally activated rearrangements of atoms increases, thus leading to structural relaxation over consecutive cycles. In this study, the maximum amplitude of thermal cycling is T LJ = 0.4ε/k B, just below T g ≈ 0.435ε/k B, as it is expected that cycling with higher thermal amplitudes will result in melting and repeated quenching to the solid phase across the glass transition.
The temperature T LJ (in units of ε/k B) during the first five periods, T = 5000τ, for the temperature amplitudes 0.1ε/k B (red), 0.2ε/k B (green), 0.3ε/k B (blue), and 0.4ε/k B (black). The horizontal dashed line indicates the critical temperature of 0.435ε/k B.
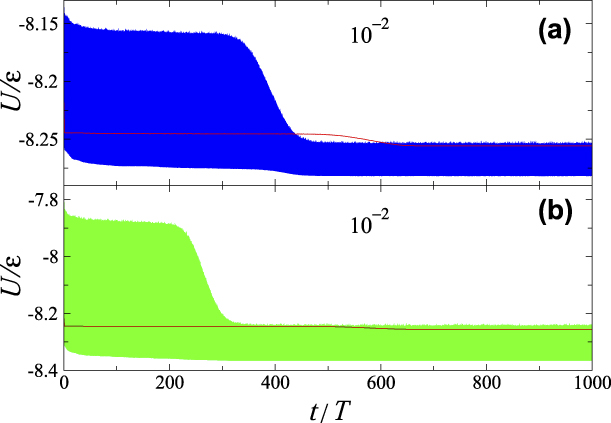
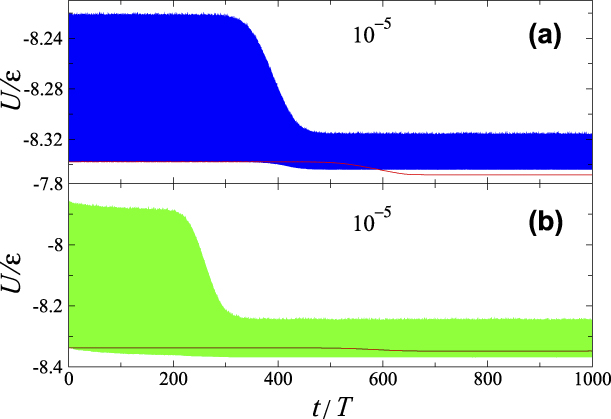
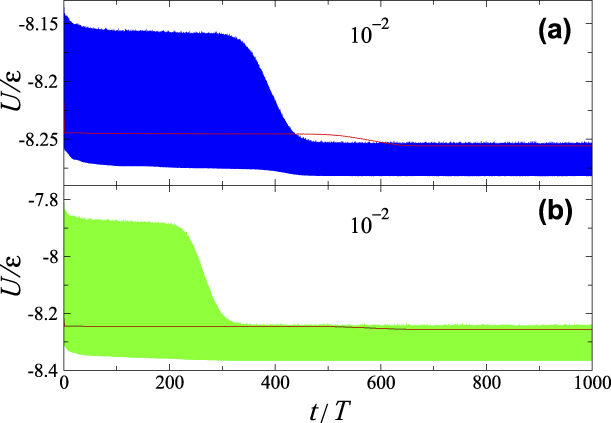
The representative potential energy series during 1000 thermal cycles are shown in Fig. 4 for poorly annealed (10−2 ε/k Bτ) and in Fig. 5 for well-annealed (10−5 ε/k Bτ) glasses and maximum temperatures 0.1ε/k B and 0.35ε/k B. For reference, the potential energies for aged glasses at constant temperature T LJ = 0.01ε/k B are also presented in Figs. 4 and 5 by the red curves, the same data as in Fig. 2 for samples annealed with cooling rates 10−2 ε/k Bτ and 10−5 ε/k Bτ. It can be observed in Fig. 4(a) that the amplitude of the potential energy oscillations is relatively large during the first 300 cycles, and then it is gradually reduced by a factor of about three during the next hundred cycles until a steady state is attained. Note that the potential energy minima after every cycle (the lower envelope of the energy oscillations) gradually decreases during the first 500 cycles but then it remains constant in steady state. We also comment that similar features, as shown in Fig. 4(a), are present for the variation of the total volume, i.e., the system becomes denser and the amplitude of the volume oscillations is reduced in the steady state (Fig. S1).
The potential energy during 1000 thermal cycles with maximum temperatures: (a) 0.1ε/k B (blue) and (b) 0.35ε/k B (green). The potential energy of the glass aged at T LJ = 0.01ε/k B is denoted by red curves (the same data as in Fig. 2). The vertical scales in both panels are different. The oscillation period is T = 5000τ. The glass was initially prepared with the cooling rate of 10−2 ε/k Bτ.
The potential energy series for the thermally cycled glass with maximum temperatures: (a) 0.1ε/k B (blue) and (b) 0.35ε/k B (green). Before the thermal treatment, the glass was annealed with the cooling rate of 10−5 ε/k Bτ. Red curves denote the potential energy for the glass aged at T LJ = 0.01ε/k B (the same data as in Fig. 2). The period of thermal oscillations is T = 5000τ. The vertical scales are different in both cases.
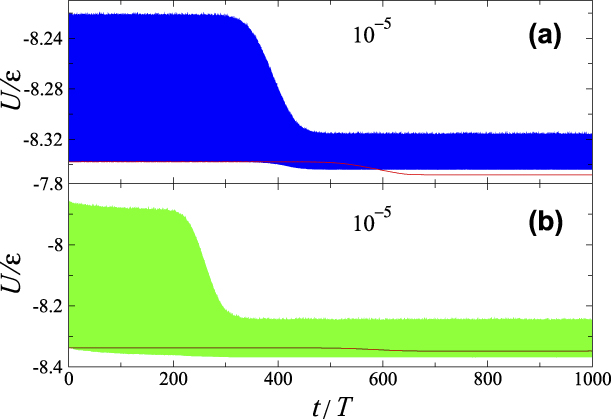
The thermal cycling with the higher maximum temperature 0.35ε/k B, shown in Fig. 4(b), results in qualitatively similar response; however, the transition to the steady state occurs after about 200 cycles. Note that in both cases presented in Fig. 4, the onset of the potential energy decrease in thermally cycled glasses appears sooner than for the sample aged at the low temperature 0.01ε/k B. The same conclusions can be deduced from the potential energy series for the well-annealed glass (cooling rate 10−5 ε/k Bτ) shown in Fig. 5, except that the energy levels for the aged glass (red curves) remain closer to the energy minima of thermally cycled glasses. We comment that the characteristic decay of the amplitude of potential energy oscillations after several hundred cycles was observed in all samples and all thermal cycling amplitudes considered in this study; however, they are omitted here for brevity.
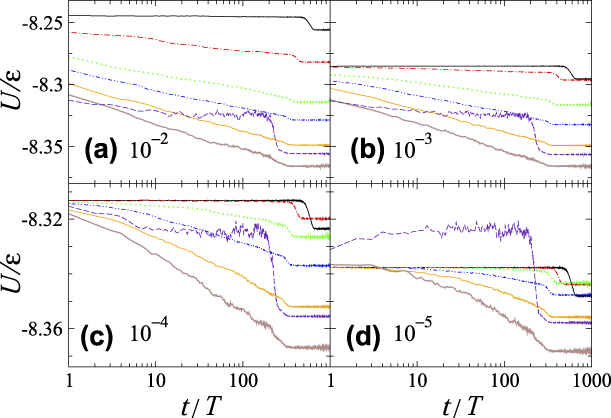
The summary of the data for the potential energy minima after each thermal cycle is presented in Fig. 6 for binary glasses cooled with the rates 10−2 ε/k Bτ, 10−3 ε/k Bτ, 10−4 ε/k Bτ, and 10−5 ε/k Bτ. In all panels, the potential energy for glasses aged at constant temperature of 0.01ε/k B is indicated by the black curves (the same data as in Fig. 2). On inspection of the data in Fig. 6, the common trend emerges for all samples cycled with the maximum temperatures 0.1ε/k B ≤ T LJ ≤ 0.35ε/k B; namely, the potential energy gradually decreases during several hundred cycles until a steady state is reached. Typically, the onset of the steady state with a well-defined level of the potential energy occurs sooner for higher thermal cycling amplitudes. Except for the cases T LJ = 0.1ε/k B and 0.2ε/k B in Fig. 6(d), the potential energy in the steady state is lower for higher thermal amplitudes.
The potential energy minima after each thermal cycle for glasses initially annealed with cooling rates (a) 10−2 ε/k Bτ, (b) 10−3 ε/k Bτ, (c) 10−4 ε/k Bτ, and (d) 10−5 ε/k Bτ. The potential energy for samples at constant temperature of 0.01ε/k B is indicated by solid black curves (the same data as in Fig. 2). The energy minima for thermally cycled glasses with the maximum temperature of 0.1ε/k B (dashed-dotted red), 0.2ε/k B (dotted green), 0.25ε/k B (dashed-double dotted blue), 0.3ε/k B (orange), 0.35ε/k B (dark brown), and 0.4ε/k B (dashed indigo). Note that the vertical scales in the upper and lower panels are different.
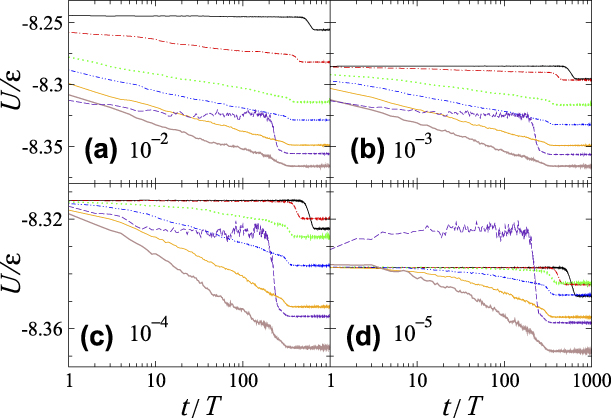
Overall, the results in Fig. 6 resemble the behavior of the potential energy in glasses during cyclic shear, where it was shown that a certain number of training cycles are required to reach a steady state of periodic deformation [Reference Fiocco, Foffi and Sastry18, Reference Regev, Lookman and Reichhardt19, Reference Leishangthem, Parmar and Sastry24]. In particular, it was demonstrated that with increasing strain amplitude below yield, the number of transient cycles increases and the potential energy level becomes deeper, leading to steady states where particle trajectories become exactly reversible at zero temperature [Reference Fiocco, Foffi and Sastry18, Reference Regev, Lookman and Reichhardt19, Reference Leishangthem, Parmar and Sastry24]. However, this analogy does not cover all aspects of thermally cycled glasses, because MD simulations are performed at finite temperature and the number of thermal cycles required to reach a steady state decreases with increasing thermal cycling amplitude, as shown in Fig. 6. We finally note that the potential energy curves for all four samples thermally cycled with the maximum temperature T LJ = 0.4ε/k B are nearly the same after about 10 cycles (Fig. 6).
Additional details of the structural relaxation process during thermal treatment can be obtained by examining the so-called nonaffine displacements of atoms. Recall that the nonaffine measure quantifies a displacement of a particular atom with respect to its neighbors during some time interval. This quantity can be evaluated numerically as follows. First, a transformation matrix Ji, which describes a linear transformation of neighbors of the i-th atom during the time interval Δt, needs to be computed [Reference Falk and Langer37]. Then, the nonaffine measure is determined as follows:
 $$\eqalign{{D^2}\left( {t,\;\Delta t} \right) \cr= {1 \over {{N_i}}}{\sum\limits_{j = 1}^{{N_i}} {\left\{ {{{\bf{r}}_j}\left( {t + \Delta t} \right) - {{\bf{r}}_i}\left( {t + \Delta t} \right) - {{\bf{J}}_i}\left[ {{{\bf{r}}_j}\left( t \right) - {{\bf{r}}_i}\left( t \right)} \right]} \right\}} ^2},$$
where the sum is carried over neighboring atoms that are located closer than 1.5σ to the i-th atom. In the last few years, the numerical analysis of nonaffine displacements was performed for cyclically sheared [Reference Priezjev22, Reference Priezjev23, Reference Priezjev25, Reference Priezjev27, Reference Priezjev28], compressed [Reference Priezjev38], and thermally cycled [Reference Priezjev30] glasses. Interestingly, it was found that the yielding transition in poorly annealed [Reference Priezjev28] and well-annealed [Reference Priezjev25] glasses occurs after a certain number of cycles and it is associated with the formation of a system spanning shear band that consists of atoms with relatively large nonaffine displacements. On the other hand, a reduction in size of clusters of atoms with large nonaffine displacements upon mechanical annealing signifies an approach to a regime of reversible deformation where most atoms return to their cages after each cycle [Reference Priezjev22, Reference Priezjev23, Reference Priezjev25, Reference Priezjev27, Reference Priezjev28, Reference Priezjev38].
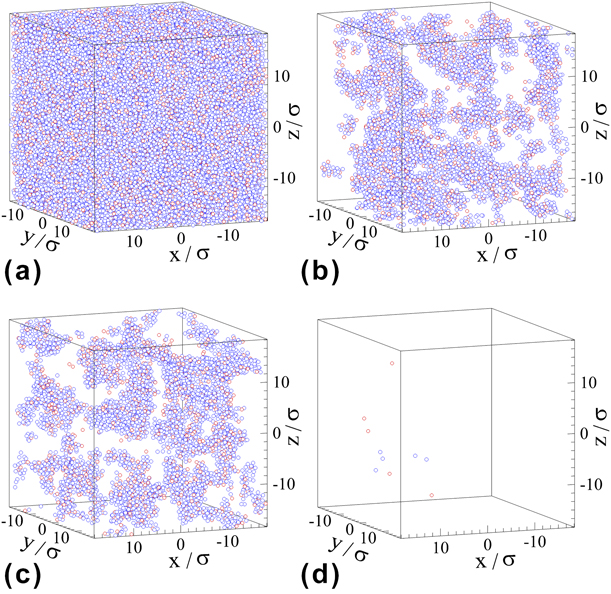
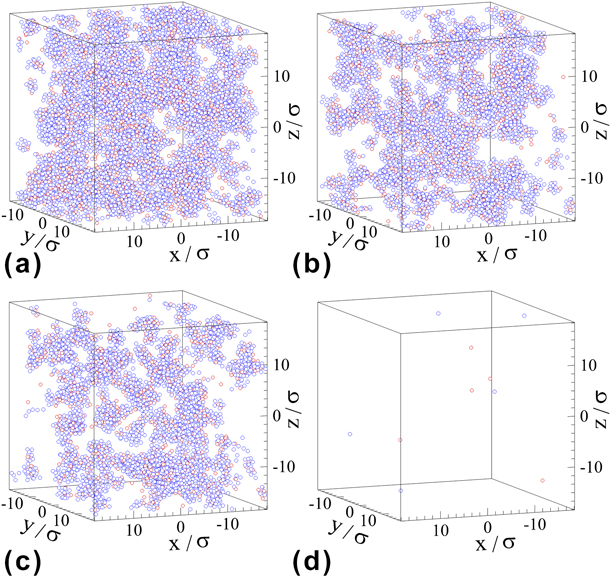
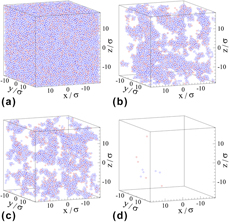
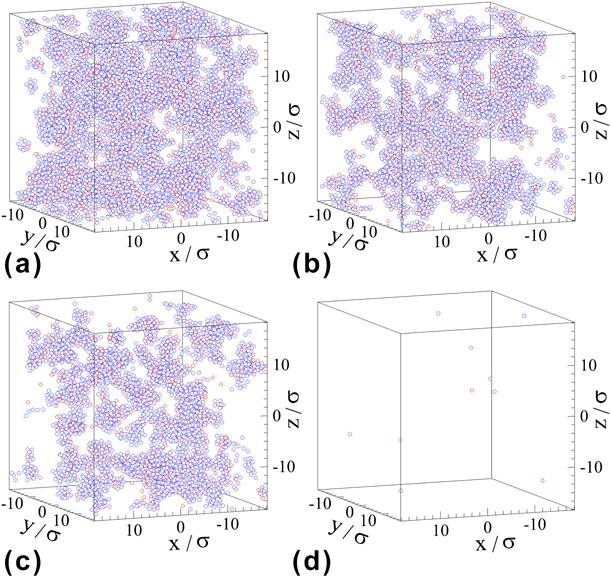
The sequence of spatial configurations of atoms with large nonaffine displacements during one cycle is presented in Fig. 7 for poorly annealed (10−2 ε/k Bτ) and in Fig. 8 for well-annealed (10−5 ε/k Bτ) glasses. In both cases, the maximum temperature during each cycle is 0.35ε/k B. It can be observed in Fig. 7 that during the first cycle, most of the atoms in the rapidly quenched glass undergo large nonaffine displacements and leave their cages. The typical cage size is about r c ≈ 0.1σ. With increasing cycle number, the characteristic size of clusters of mobile atoms is reduced, and only a few isolated atoms are present after the last cycle, indicating a nearly reversible dynamics. It was recently shown that the appearance of several mobile atoms in glasses subjected to multiple subyield shear cycles does not necessarily imply diffusive motion, because these atoms can jump back and forth between neighboring cages [Reference Priezjev22, Reference Priezjev23]. A qualitatively similar behavior is reported in Fig. 8 for the well-annealed glass, except that the typical size of clusters of atoms with large nonaffine displacements after the first cycle is significantly reduced.
Spatial configurations of atoms with large nonaffine measure (a) D 2(0, T) > 0.04σ2, (b) D 2(99T, T) > 0.04σ2, (c) D 2(199T, T) > 0.04σ2, and (d) D 2(999T, T) > 0.04σ2. The sample was initially annealed with the cooling rate of 10−2 ε/k Bτ and then subjected to thermal cycling with the maximum temperature of 0.35ε/k B.

Positions of atoms with large nonaffine displacements (a) D 2(0, T) > 0.04σ2, (b) D 2(99T, T) > 0.04σ2, (c) D 2(199T, T) > 0.04σ2, and (d) D 2(999T, T) > 0.04σ2. The maximum temperature of thermal oscillations is 0.35ε/k B. The binary glass was initially prepared with the cooling rate 10−5 ε/k Bτ.
Altogether, the analysis of nonaffine displacements suggests that during the first few hundred cycles, the thermal treatment induces collective, irreversible rearrangements of atoms during each cycle that leads to progressively lower potential energies. Once a steady state with a certain energy level is attained, the particle dynamics becomes nearly reversible. In other words, after a certain number of transient cycles, the glass is represented by a particular configuration of atoms that expand on heating but return to their cages after each cycle. This situation is similar to the so-called limit cycles reported in athermal quasistatic simulations of amorphous solids, where the particle trajectories become exactly reversible after one or more shear cycles [Reference Fiocco, Foffi and Sastry18, Reference Regev, Lookman and Reichhardt19, Reference Leishangthem, Parmar and Sastry24].
We next examine the effect of thermal cycling on mechanical properties of binary glasses by applying a tensile strain with the rate of  ${\dot{\varepsilon }_{xx}} = {10^{ - 5}}{\tau ^{ - 1}}$ at T LJ = 0.01ε/k B and P = 0. After the time interval 5 × 10⁶ τ = 1000T, all thermally cycled and aged samples were strained along the
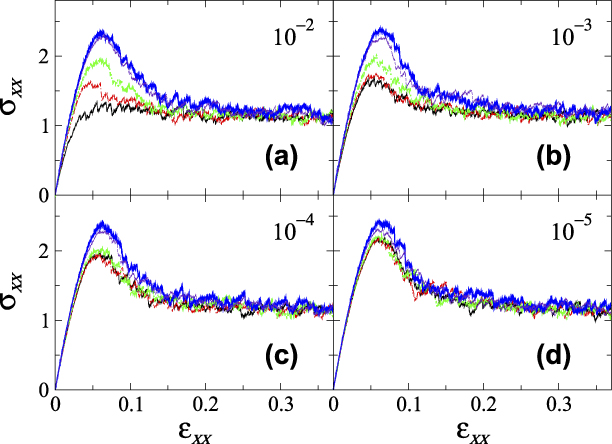
 $\hat{x}$ direction up to εxx = 0.5. The stress–strain response is summarized in Fig. 9 for four cooling rates and selected values of the thermal cycling amplitude. It can be seen that glasses that are more slowly annealed and then aged at T LJ = 0.01ε/k B exhibit a more pronounced yield stress peak (black curves in Fig. 9). With increasing maximum temperature up to T LJ = 0.35ε/k B, the yielding peak increases in all four cases shown in Fig. 9. Note also that the maximum stress is approximately the same for all cooling rates when T LJ = 0.35ε/k B. Similar conclusions were obtained in the previous study, despite that simulations were performed for fewer values of the thermal cycling amplitude and the steady state was not reached [Reference Priezjev30].
The tensile stress σxx (in units of εσ−3) versus strain for glasses prepared with cooling rates (a) 10−2 ε/k Bτ, (b) 10−3 ε/k Bτ, (c) 10−4 ε/k Bτ, and (d) 10−5 ε/k Bτ. The data for glasses aged at T LJ = 0.01ε/k B are indicated by solid black curves. The stress–strain response for glasses thermally cycled with the maximum temperature 0.1ε/k B (dashed-dotted red), 0.2ε/k B (dotted green), 0.35ε/k B (dark solid blue), and 0.4ε/k B (dashed indigo). The samples were strained with the rate  ${\dot{\varepsilon }_{xx}} = {10^{ - 5}}{\tau ^{ - 1}}$ at T LJ = 0.01ε/k B and P = 0.
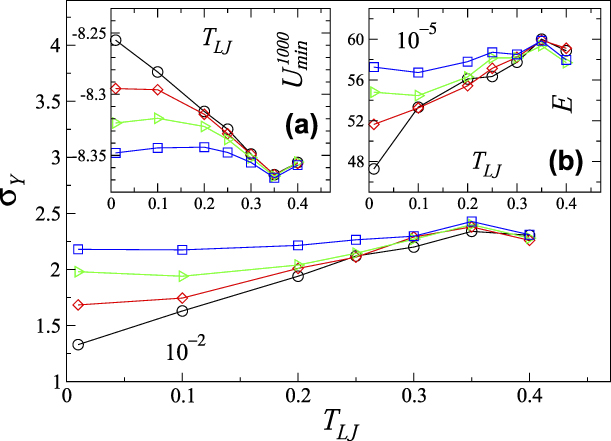
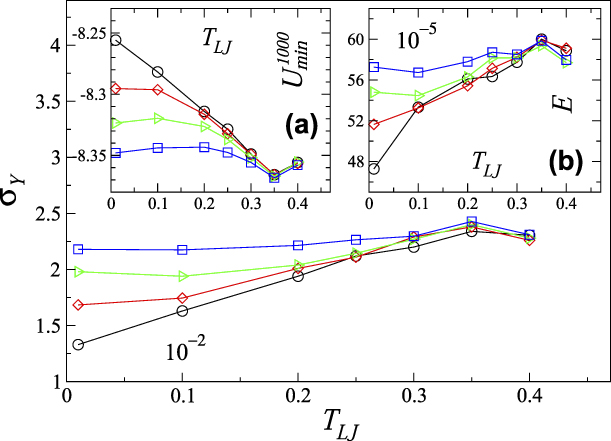
We finally plot the values of the yielding peak, elastic modulus, and the minima of the potential energy after 1000 thermal cycles in Fig. 10 as a function of the maximum temperature. It can be observed that with increasing thermal cycling amplitude, both σY and E increase, except for the case T LJ = 0.4ε/k B. Thus, the maximum of the yield stress and elastic modulus is acquired in glasses thermally cycled with the amplitude T LJ = 0.35ε/k B. These trends are inversely correlated with the variation of the potential energy minima shown in the inset (a) in Fig. 10. The origin of a slight upward curvature in U(1000T) for the well-annealed glass at small T LJ is at present not clear. Given that the potential energy in all samples in Fig. 6 saturates to a constant level after several hundred cycles, we conclude that the results for mechanical properties presented in Fig. 10 should be independent of the cycle number.
The yielding peak σY (in units of εσ−3) as a function of the thermal amplitude for cooling rates 10−2 ε/k Bτ (○), 10−3 ε/k Bτ (◊), 10−4 ε/k Bτ (⊳), and 10−5 ε/k Bτ (□). The inset (a) shows the potential energy minima after 1000 thermal cycles. The inset (b) displays the elastic modulus E (in units of εσ−3) versus the thermal amplitude for the same samples and cooling rates.
Conclusions
In summary, the effect of periodic thermal treatment on structural relaxation and mechanical properties of binary glasses was investigated using MD simulations. We considered the Kob–Andersen binary mixture annealed across the glass transition with different cooling rates and subjected to repeated heating and cooling cycles at constant pressure. It was found that during a few hundred transient cycles, the potential energy minima gradually decrease toward a steady state with the lowest energy level, which depends on the thermal cycling amplitude. Moreover, with increasing thermal amplitude up to a certain value, the number of transient cycles decreases and the level of the potential energy is reduced. The structural relaxation proceeds by collective, nonaffine displacements of atoms that are organized into clusters. In contrast, the particle dynamics in steady state becomes nearly reversible and the system returns to the same energy state after each thermal cycle. The results of tensile tests after one thousand cycles revealed that the maximum values of the elastic modulus and yielding peak occur at the same thermal cycling amplitude regardless of the annealing history.
In the future, it might be instructive to investigate whether the details of thermal treatment, such as the reference temperature, oscillation period, system size, and choice of atomistic model, will affect the main conclusions regarding the potential energy states and mechanical properties of amorphous materials. One of the findings of this study is the appearance of well-defined steady states with particular energy levels and nearly reversible dynamics. This, in turn, opens the question of memory formation in such systems similar to memory effects reported in periodically driven glasses [Reference Keim, Paulsen, Zeravcic, Sastry and Nagel39]. For example, thermally cycled glasses with a particular thermal amplitude might continue to expand and contract reversibly if the thermal amplitude is reduced or instead undergo structural relaxation if the thermal amplitude is increased.
Supplementary material
To view supplementary material for this article, please visit https://doi.org/10.1557/jmr.2019.145.
Acknowledgments
Financial support from the National Science Foundation (CNS-1531923) is gratefully acknowledged. The article was prepared within the framework of the HSE University Basic Research Program and funded in part by the Russian Academic Excellence Project 5-100. The molecular dynamics simulations were performed using the LAMMPS numerical code developed at Sandia National Laboratories [Reference Plimpton34]. Computational work in support of this research was performed at Wright State University’s Computing Facility and the Ohio Supercomputer Center.