Several studies have demonstrated an effect of age and gender on electrocardiographic tracings.Reference Bacquer, Backer and Kornitzer1 Remarkably few studies, however, have explored the range of electrocardiographic parameters in children.Reference Davignon, Rautaharju, Boiselle, Soumis, Megelas and Chougette2–Reference Rijnbeek, Witsenbeurg, Schrama, Hess and Kors7 Moreover, there is no comprehensive study concerning changes in the electrocardiogram in Turkish children. In this study, we aimed, using a computer program for measurement and analysis, to demonstrate the differences, if any, due to age and gender on the electrocardiographic measurements in a large cohort of Turkish children.
Material and methods
All individuals were recruited from 15 nursery schools, one primary school, one secondary school, three child health centers, and one maternity hospital in Bursa and its surrounding areas. The ages explored ranged from 1 day to 16 years. The population generally was drawn from families in the middle socioeconomic level. All the children were examined by a pediatrician. To be included in the study, individuals had to:
• Have no history of cardiovascular disease, or any other abnormality known to affect the cardiovascular system
• Have systolic and diastolic blood pressures within the normal range for that age
• Have no murmur on physical examination.
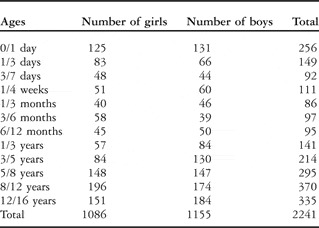
We recruited a total of 2241 children fulfilling these criterions. For each child, we measured weight, height, and blood pressure prior to the electrocardiogram recordings. The data for height and weight were compared with the standards for Turkish children. We divided the population into 12 groups according to age:Reference Davignon, Rautaharju, Boiselle, Soumis, Megelas and Chougette2 0–1 day, 1–3 days, 3–7 days, 1–4 weeks, 1–3 months, 3–6 months, 6–12 months, 1–3 years, 3–5 years, 5–8 years, 8–12 years, and 12–16 years. Table 1 shows the number of male and female children in each of the groups. Written informed consent was obtained from all parents and all children aged 12 or older. The study was approved by the Ethical Committee of the Uludag University.
The distribution of those studied according to age and gender.

Standard simultaneous 12-lead electrocardiograms were recorded at a sampling rate of 500 Herz with the use of an acquisition system using a personal computer (Cardioline Delta 60 Plus 3.0 Version). The frequency response of this recorder was between 0.05 and 150 Herz. All recordings were made by the same technician. 12-lead precordial and limb derivations were recorded and, with the guidance of the study of Rijnbeek and colleaguesReference Rijnbeek, Witsenbeurg, Schrama, Hess and Kors7, lead V3R was used instead of V3, and V7 instead of V5. The QT interval was corrected with Bazett’s formula.Reference Bazett8 The electrocardiograms were processed by the Modular Electrocardiogram Analysis System.
In the distribution of the measured values, the ones that met the second and 98th percentiles were accepted as the bottom and the upper limits of the normal range, respectively. In some tables and figures, the data was given as mean, 2nd and 98th percentiles, and in the others only mean and 98th percentiles. The zero amplitude values, at which point that there are no Q, R, or S waves, were omitted from the statistical analysis. We used the SPSS statistics programme for analysis of the data.
Results
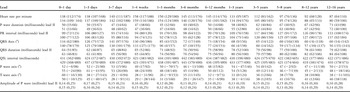
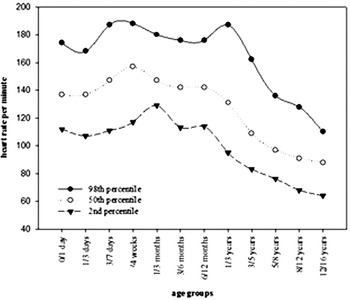
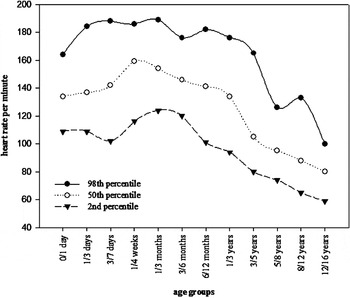
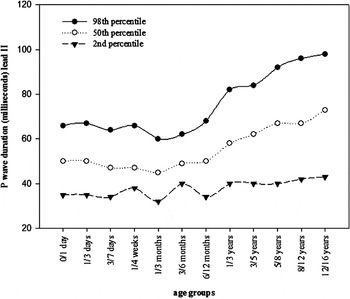
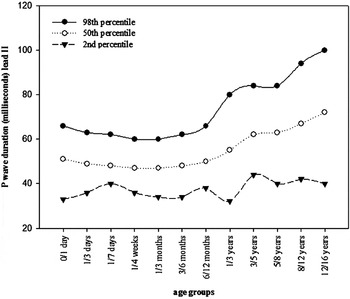
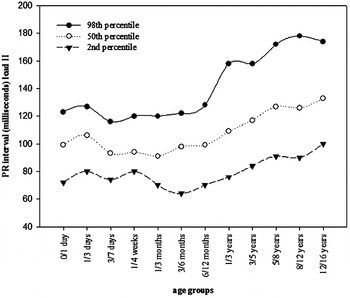
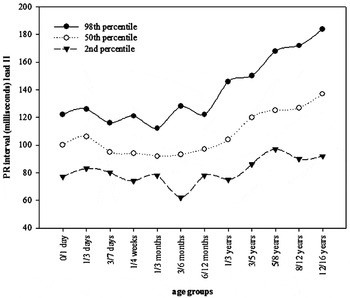
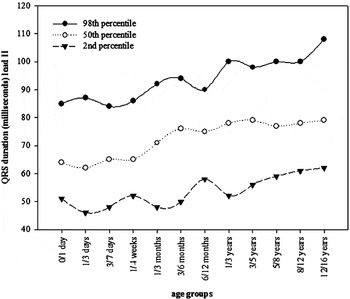
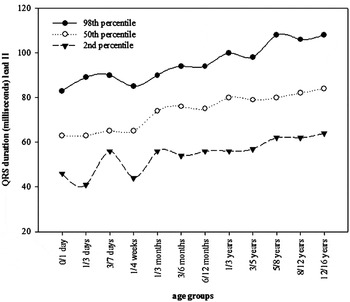
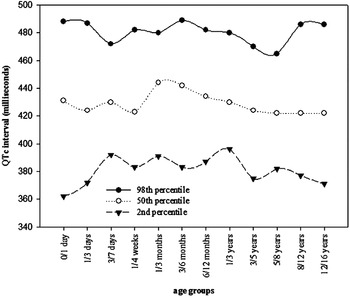
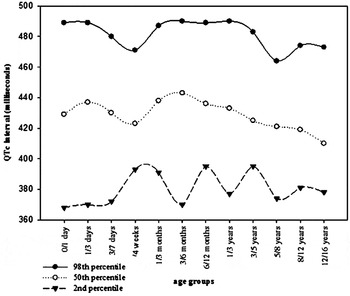
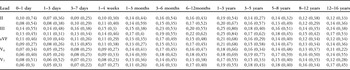
We enrolled a total of 2241 healthy children, 49% female and 51% male. The distribution according to age and gender is shown in Table 1. The mean centile, and the range of 2nd and 98th centiles of heart rate, duration of P wave, PR interval, QRS axis, duration of QRS, QTc interval, P wave axis, T wave axis, and the amplitude of P wave at lead II according to age and gender are shown in Table 2 (available in electronic format only). For all age groups, heart rate showed an extensive dispersion (Figs 1 and 2). The heart rate increased after birth, and reached its maximal level at from 1 to 4 weeks, at 158 beats per minute for girls, and 159 beats per minute for boys. The rate then gradually decreased. The upper limit of normal for the heart rate was slightly higher for girls than for boys from the age of 3 years onward. P wave and QRS duration, as well as PR intervals, varied according to the alterations in heart rate. The mean P-wave duration ranged from 45 to 73 milliseconds for girls, and 47 to 72 milliseconds for boys, with a small but consistent difference between the genders (Figs 3 and 4). The mean P wave duration showed a slight decrease until 3 months of age, and increased afterwards. The mean PR interval in lead II was longer at 1–3 days than 0–1 day, showed a decrease at 3–7 days, and then increased with age (Figs 5 and 6). The mean QRS axis was directed to the right in the first 1 to 4 weeks of life, reflecting increased right ventricular mass in that period, and then gradually shifted to the normal axis. P wave axis and, T wave axis, with the exception of the first day of life at which T wave axis reached the highest mean values for both girls and boys, proved relatively stable throughout childhood and adolescence. The mean QRS duration showed an increase with age in both girls and boys, without any significant difference between the two groups (Figs 7 and 8). The mean QTc interval ranged between 422 and 444 milliseconds for girls and 410 and 443 milliseconds for boys (Figs 9 and 10). P-wave amplitude in lead II was not significantly affected by age or gender. The highest upper limit of P-wave amplitude was 0.30 millivolts for girls and 0.29 millivolts for boys.
Heart rate, duration of P wave, PR interval, QRS axis, duration of QRS, QTc interval, P wave axis, T wave axis, and amplitude of P wave in lead II for girls (upper row) and for boys (lower row) according to the ages: mean (2nd percentile/98th percentile, and only 98th percentile for amplitude of P wave in lead II).

Heart rate versus age in girls.

Heart rate versus age in boys.

P wave duration in lead II versus age in girls.

P wave duration in lead II versus age in boys.

PR interval in lead II versus age in girls.

PR interval in lead II versus age in boys.

QRS duration in lead II versus age in girls.

QRS duration in lead II versus age in boys.

QTc versus age in girls.

QTc versus age in boys.

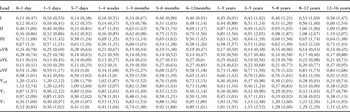
The Q-wave amplitude is presented for clinically important leads according to age and gender in Table 3 (available in electronic format only). The upper limit of the Q-wave amplitude in the 0–1 day group was maximal in all leads presented, with the highest value in lead II for girls, which was 0.74 millivolts. It showed a decrease until to 1 to 3 months, and then again started to increase, showing a second peak value in all leads at 1 to 3 years, after which a decrease was seen towards the initial values. In those aged from 12 to 16 years, girls had significantly lower upper limits of normal for the Q-wave amplitude in V6 and V7.
Q-wave amplitudes (millivolt) for girls (upper row) and boys (lower row) according to ages: mean (98th percentile).

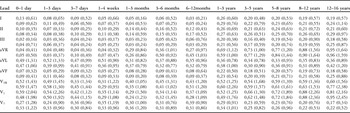
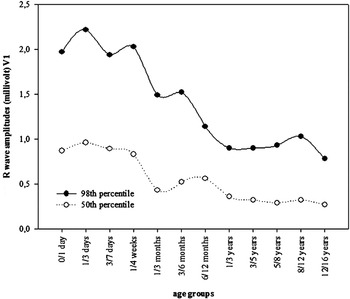
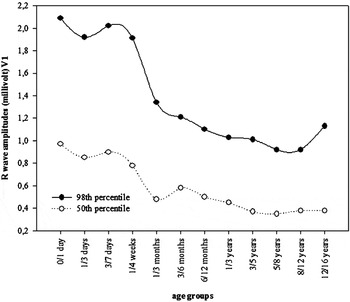
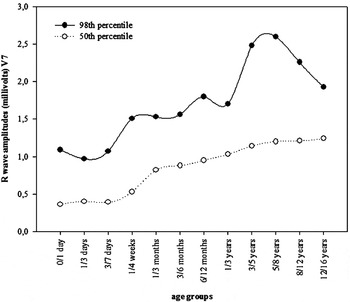
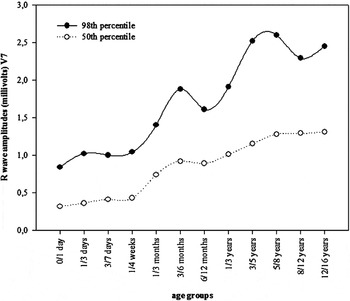
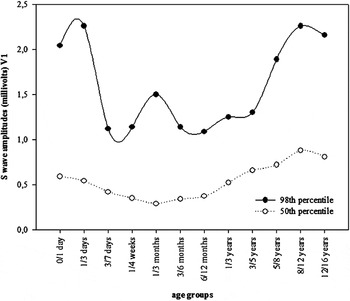
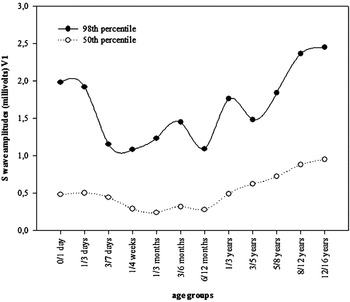
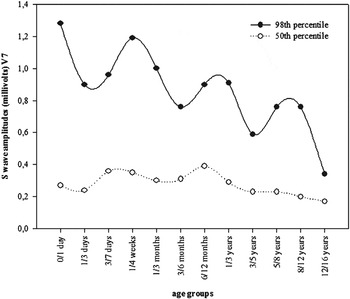
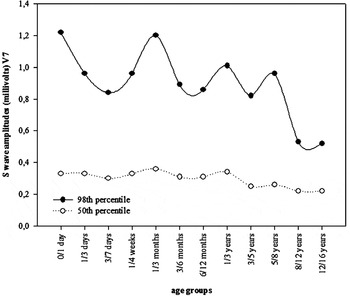
The normal range for R- and S-wave amplitudes, as well as R/S ratio, are shown in Tables 4–6 (available in electronic format only). R-wave amplitude decreased with age in both girls and boys in lead V3R and V1, and increased in lead V7 (Figs 11–14). S-wave amplitude showed a similar but inverse pattern (Figs 15–18). A steady decrease in R/S ratio was observed in V3R and V1, and an increase in V6 and V7.
R-wave amplitudes (millivolt) for girls (upper row) and boys (lower row) according to ages: mean (98th percentile).

S-wave amplitudes (millivolt) for girls (upper row) and boys (lower row) according to ages: mean (98th percentile).

R/S ratio in precordial leads for girls (upper row) and boys (lower row) according to ages: mean (98th percentile).

R wave amplitudes in lead V1 versus age in girls.

R wave amplitudes in lead V1 versus age in boys.

R wave amplitudes in lead V7 versus age in girls.

R wave amplitudes in lead V7 versus age in boys.

S wave amplitudes in lead V1 versus age in girls.

S wave amplitudes in lead V1 versus age in boys.

S wave amplitudes in lead V7 versus age in girls.

S wave amplitudes in lead V7 versus age in boys.

Discussion
In order to be able to evaluate the electrocardiogram in children, we should know the normal standards for both age and gender. As far as we know, ours is the first extensive study of these variables in Turkish children. We have determined the normal electrocardiogram limits, and stratified them according to age and gender. Recent comprehensive reports on normal limits based on apparently healthy children population are those emanating from Davignon et al.,Reference Davignon, Rautaharju, Boiselle, Soumis, Megelas and Chougette2 Macfarlane et al.,Reference Macfarlane, Coleman, Pomphrey, McLaughlin, Houstin and Aitchison3 and Rijnbeek et al.Reference Rijnbeek, Witsenbeurg, Schrama, Hess and Kors7 We have made only a limited comparison with these studies, but suggest that the paucity of data on normal limits in different racial groups warrants further investigation and documentation.
Previous studies that have determined normal limits for the electrocardiogram in children have had their imperfections.Reference Davignon, Rautaharju, Boiselle, Soumis, Megelas and Chougette2, Reference Macfarlane, Coleman, Pomphrey, McLaughlin, Houstin and Aitchison3, Reference Rijnbeek, Witsenbeurg, Schrama, Hess and Kors7 In our study, we based the normal limits on computerized analysis of a large set of electrocardiograms recorded at a relatively high sampling rate, thus obviating some of the limitations of the previous studies. We divided our total population into 12 age groups, as did Davignon et al.Reference Davignon, Rautaharju, Boiselle, Soumis, Megelas and Chougette2 Rijnbeek et al.Reference Rijnbeek, Witsenbeurg, Schrama, Hess and Kors7 also used this system but, since their number of children up to one month was relatively small, they combined them in one group, and divided their population into 9 groups instead of 12. Here, we will especially discuss P-wave and QRS durations, PR interval, QTc, QRS, P-wave and T-wave axes, P-wave amplitude, R and S waves, and R/S ratios with respect to age and gender, and also compare our results with those reported previously.
Our lower limit for P-wave duration was 32 milliseconds for girls aged from 1 to 3 months, as it was for boys aged from 1 to 3 years, the upper limit being 98 milliseconds for girls, and 100 milliseconds for boys, both at the ages of 12 to 16 years. In the study of Rijnbeek et al.,Reference Rijnbeek, Witsenbeurg, Schrama, Hess and Kors7 the lower limit for girls was 62 milliseconds aged from 1 to 3 months, and from 1 to 3 years, and was 63 milliseconds for boys when aged from 1 to 3 years. The upper limit for P-wave duration was 122 milliseconds for girls, and 118 milliseconds for boys, both when aged from 12 to 16 years. These findings suggest that the established criterions for left atrial abnormalities should be adjusted for Turkish children.
The mean and upper limits of the PR interval gradually increase with age in both genders. Generally, PR interval increases with decreasing heart rate, as seen in our study and others.Reference Davignon, Rautaharju, Boiselle, Soumis, Megelas and Chougette2, Reference Macfarlane, Coleman, Pomphrey, McLaughlin, Houstin and Aitchison3, Reference Rijnbeek, Witsenbeurg, Schrama, Hess and Kors7 Our upper normal limits are comparable to those established by Rijnbeek et al.Reference Rijnbeek, Witsenbeurg, Schrama, Hess and Kors7 Mean QRS duration was found to be 86 milliseconds for children aged from 13 to 14 years in the study of Macfarlane et al.,Reference Macfarlane, Coleman, Pomphrey, McLaughlin, Houstin and Aitchison3 and median QRS duration was 91 milliseconds for boys, and 87 milliseconds for girls, in those aged from 12 to 16 as studied by Rijnbeek et al.Reference Rijnbeek, Witsenbeurg, Schrama, Hess and Kors7 In our study, the mean QRS values were 79 milliseconds for girls, and 84 milliseconds for boys, when aged from 12 to 16 years, endorsing these findings.Reference Macfarlane, Coleman, Pomphrey, McLaughlin, Houstin and Aitchison3, Reference Rijnbeek, Witsenbeurg, Schrama, Hess and Kors7 The median QRS duration in the study of Rijnbeek et al.Reference Rijnbeek, Witsenbeurg, Schrama, Hess and Kors7 was greater for boys than for girls in most age groups, but the differences in upper limits of normal were small, ranging from 2 to 7 milliseconds. In our study, the mean QRS duration was also found to be greater for boys than for girls in most age groups, the differences in upper limit of normal ranging from 2 to 8 milliseconds. Our normal limits for the QRS duration, however, are substantially higher than those reported by Davignon et al.Reference Davignon, Rautaharju, Boiselle, Soumis, Megelas and Chougette2
According to Bazett’s formula, the QTc should not exceed 440 milliseconds, except in infants.Reference Bazett8 A corrected time of up to 490 milliseconds may be normal for the first six months of life.Reference Park and Guntheroth9 In our data, the upper limit ranged from 465 milliseconds in girls aged from 5 to 8 years to 489 milliseconds in those aged from 3 to 6 months, and from 464 for boys aged from 5 to 8 years to 490 when boys were aged from 3 to 6 months, or 1 to 3 years. We found that mean values for QTc remained equal or lower than 440 milliseconds in all age groups, but our upper limits were from 24 to 46 milliseconds higher than the values accepted as normal for boys, and 25 to 49 milliseconds higher for girls. Rijnbeek et al.Reference Rijnbeek, Witsenbeurg, Schrama, Hess and Kors7 had found that the QTc interval remained relatively constant over the years, with an upper limit of normal of approximately 450 milliseconds, which is higher than the commonly used criterion of 440 milliseconds.
The QRS axis changes from the right and anterior direction in infants, to the left and posterior direction in adults. The marked anterior deviation of the T vector in newborn infants disappears within a few days. During childhood, it remains intermediate. Beginning at 8 to 10 years, the T vector gradually moves to anterior. The mean and upper limit of QRS axis was 134 and 180, respectively for girls, and 140 and 179 for boys, both in the first day of life in our study. In contrast, in the study of Rijnbeek et al.,Reference Rijnbeek, Witsenbeurg, Schrama, Hess and Kors7 the median and upper limit of QRS axis was 110 and 155, respectively for girls, and 97 and 140 respectively for boys, these values being much lower than ours. The P axis was found to be stable over the total age range in both our study and that of Rijnbeek et al.Reference Rijnbeek, Witsenbeurg, Schrama, Hess and Kors7 We also observed that the T wave axis proved relatively stable over the total age range, except for the first few days of life.
For the diagnosis of right atrial hypertrophy, the normal value for the P wave amplitude should be higher than 0.25 or 0.30 millivolts.Reference Park and Guntheroth9 In the study of Davignon et al.,Reference Davignon, Rautaharju, Boiselle, Soumis, Megelas and Chougette2 this value was found to be higher than 0.30 millivolts. In our study, the highest upper limit of P-wave amplitude was 0.30 millivolts for girls, and 0.29 for boys, these being aged from 8 to 12 years, and 12 to 16 years, respectively. Rijnbeek et al.Reference Rijnbeek, Witsenbeurg, Schrama, Hess and Kors7 found the largest P-wave amplitude to be 0.25 millivolts in lead II, while in V1 and V2 substantially lower upper limits of normal were found, suggesting that the criterion of amplitude when used in the diagnosis of right atrial hypertrophy should be lead dependent.
The Q wave is produced primarily by depolarization of the ventricular septum, and commonly present in leads I, II, and aVF, and is almost always present in V5 and V6. The maximal Q amplitude in leads aVF, V5, and V6 is usually less than 0.5 millivolts in children of any age. The maximal Q wave amplitude in lead III may be as large as 0.5 to 0.8 millivolts in children between 1 month and 3 years of age.Reference Park and Guntheroth9 We found the upper limit of Q wave amplitude in V6 to be higher than reported by Davignon et al.,Reference Davignon, Rautaharju, Boiselle, Soumis, Megelas and Chougette2 but nearly similar to the value found by Rijnbeek et al.Reference Rijnbeek, Witsenbeurg, Schrama, Hess and Kors7 A possible reason for this difference might be due to the fact that, as did Rijnbeek et al.,Reference Rijnbeek, Witsenbeurg, Schrama, Hess and Kors7 we only included non-zero values in computing the centiles. Since Q wave is defined as a negative wave, we believe that it is an appropriate choice.
There is progressive increase in the amplitude of the R wave toward V5, and a progressive decrease in the amplitude of the S wave toward V6. In infants in the first month of life, there may be complete reversal of the R/S progression, with a dominant R in V4R, V1, and V2 and a dominant S in V5 and V6. In children between 1 month and 2 to 3 years of age, partial reversal is usually present, with a dominant R in V1 as well as in V5 and V6.
Considerable differences were found in R- and S-wave amplitudes when we compared our study with the others. For example, in our study, the mean and upper limit of R wave in lead V7 was 1.21 millivolts, and 2.26 millivolts for girls aged from 8 to 12 years, respectively, and 1.29, and 2.29 for boys of the same age using the same lead. The median and upper limits of the R wave as measured in lead V7 in the study of Rijnbeek et al.Reference Rijnbeek, Witsenbeurg, Schrama, Hess and Kors7 were 1.35 millivolts and 2.10 millivolts for girls, and 1.38 millivolts and 2.24 millivolts for boys, these being similar with ours.
We found that the mean amplitudes, and upper limits, of the Q-, R- and S wave were higher for boys than for girls in most leads in most age groups, these findings being more significant in precordial leads during adolescence, again endorsing the study of Rijnbeek et al.Reference Rijnbeek, Witsenbeurg, Schrama, Hess and Kors7 The reasons for the significant differences between girls and boys in the precordial leads and in the period of adolescence are the increase in fatty tissue over the chest during growth, and the growth of breast tissue for girls during this period.Reference LaMonte and Freiman10 These differences might be a reflection of the boys being greater than girls of reproductive age.Reference Strong, Downs, Liebman and Liebowitz11 Since the differences in amplitude are important for evaluation of ventricular hypertrophy, these differences related to gender should always be noted, especially during adolescence.
In their study, Rijnbeek et al.Reference Rijnbeek, Witsenbeurg, Schrama, Hess and Kors7 digitized their electrocardiograms at a sampling rate of 1200 Herz. When they downsampled the signals to 500 Herz, as used in our study and in the study of Macfarlane et al.,Reference Macfarlane, Coleman, Pomphrey, McLaughlin, Houstin and Aitchison3 and repeated the analyses, they had found that normal limits remained essentially the same, but when downsampled to 333 Hz, as used in the study of Davignon et al.,Reference Davignon, Rautaharju, Boiselle, Soumis, Megelas and Chougette2 they had found lower amplitudes. We think that, therefore, that the similarity between our study and the study of Rijnbeek et al.,Reference Rijnbeek, Witsenbeurg, Schrama, Hess and Kors7 and the difference between our study and the study of Davignon et al.Reference Davignon, Rautaharju, Boiselle, Soumis, Megelas and Chougette2 might be attributed to the differences in sampling rate. Other factors, such as differences in population and physiological changes in children, however, cannot be excluded.
In conclusion, marked differences exist in the normal electrocardiographic limits found in Turkish children. This merits the definition of a set of age- and sex-specific electrocardiogram criterions specifically for use in Turkish children. Our study has provided the necessary tables and figures showing these values.