1. INTRODUCTION
Wireless communication applications play a pivotal role in location-based services (LBSs). Indoor positioning is an indispensable part of LBSs and has huge potential in indoor navigation services, Internet of Things (IOT) and public safety. Nowadays, the Global Positioning System (GPS) has been widely used in the outdoor environment. Owing to complex indoor environments and weak satellite signals, which are blocked by buildings and walls, GPS is not suitable for indoor environments (Jing et al., Reference Jing, Pinchin, Hill and Moore2016). In particular, buildings and walls are too thick for the satellites signal so they can barely reach the indoor areas. Against this background, other techniques using wireless techniques have been developed for the indoor positioning, such as ultrasonic systems (Choi et al., Reference Choi, Ra, Park and Jin2013), radio frequency identification (RFID) (DiGiampaolo et al., Reference DiGiampaolo and Martinelli2014), LED visible light (Jung et al., Reference Jung, Hann and Park2012), magnetic fields (Wu et al., Reference Wu, Liang, Fu and Geng2017) and wireless local area network (WLANs). With the widespread deployment of WLAN infrastructure, most smart devices are equipped with hardware modules for detecting the WLAN signals, which motivated the idea of indoor positioning based on WLAN technology with the first indoor positioning system proposed in 2000 (Bahl et al., Reference Bahl and Padmanabhan2000).
In the existing indoor positioning systems based on WLAN, the received signal strength indicator (RSSI) of the wireless fidelity (Wi-Fi) signal is commonly adopted as an indicator of WLAN performance (Yang et al., Reference Yang and Shao2015). There are two factors that can degrade the RSSI of the Wi-Fi signals: multipath interference and non-line-of-sight (NLOS) (Cai et al., Reference Cai, Li, Yuan and Hei2015). To address these two issues, the fingerprint technique has been proposed, which has two stages: the offline stage and the online stage.
In the offline stage, at each reference point (RP), the Wi-Fi signal from the access point (APs) can be detected and quantified by the Wi-Fi collector. The fingerprint of an RP is constructed with the Wi-Fi signal strength from each AP and the spatial coordinate of the RP. After collecting the fingerprint of each RP, the fingerprint database can be established. In the online stage, the real-time RSSI values of APs are collected to match with the RSSI data in the fingerprint database, then the current position can be obtained with the help of the matching algorithm. One of the most commonly used matching algorithms in recent years is the Weighted K-Nearest Neighbor (WKNN) algorithm.
In the fingerprint algorithm, the real-time measured RSSI data need to be compared with the RSSI data in the fingerprint database one by one in the online stage. On the one hand, the size of fingerprint database and the computational complexity of the matching algorithm are determined by the number of APs. A greater number of APs means a larger fingerprint database and a more complicated algorithm. On the other hand, the accuracy of fingerprint algorithm improves as the number of APs increases. However, some APs may not contribute to the final positioning result owing to obstacles and multipath interference, which would reduce the accuracy of indoor positioning in the online stage. Therefore, an AP selection strategy is necessary to screen out such APs for the positioning algorithm. In general, the AP selection strategy has two key points (Zhang et al., Reference Zhang, Hua, Yu, Qiu and Zhang2016): reduce the positioning error by removing the APs that have a degrading effect on the positioning accuracy and reduce computational complexity by selecting a subset of APs to estimate the position.
In recent years, fingerprint algorithms for indoor positioning have been studied extensively. Jhuang et al. (Reference Jhuang, Hung, Tuan, Wu and Leu2015) used the standard deviation of the APs' RSSI samples to describe the stability of APs and selected the top-N APs with the smallest standard deviation to match. Chang et al. (Reference Chang, Chen, Hou and Wang2015) considered the maximum value of APs' RSSI samples as the initial cluster centre to classify APs and used the APs in a subclass for matching. Chen et al. (Reference Chen, Yang, Yin and Chai2006) made use of the location information gain to measure the spatial discriminating ability of the APs and selected the APs with larger location information gain for comparison and matching. Zou et al. (Reference Zou, Luo, Lu, Jiang and Xie2015) considered the dependence between the APs and presented the online mutual information to describe the dependence between two APs. In addition, they utilised the top-N APs with the smallest online mutual information for matching. Although some criteria for the AP selection have been proposed by the fingerprint algorithms mentioned previously, the problem of performance degradation caused by a large fingerprint database has not been properly addressed.
Although the existing FP algorithms can provide acceptable positioning services, the workload of collecting fingerprint data in the offline stage is still high, the fingerprint database size is still relatively large and the positioning accuracy is not high enough. To solve this problem, an improved fingerprint algorithm with AP selection strategy and RP selection strategy is proposed, the variance-based AP selection strategy is designed to reduce the fingerprint database size, and an RP selection strategy based on the spatial subregion is adopted to improve the positioning accuracy. The experiments were conducted on two different smartphones in the Physics Building in Central South University. To test the effectiveness of the proposed algorithm, the traditional FP algorithm and two existing improved fingerprint algorithms were compared with the proposed algorithm to verify the performance of the AP and RP selection strategies. Experimental results show that the variance-based AP selection strategy and the RP selection strategy have better performance in improving positioning accuracy than the other three algorithms.
The remainder of this paper is organised as follows. The FP algorithm is provided in Section 2. In Section 3, an improved fingerprint algorithm is proposed. Section 4 presents the experimental environment and the analysis of experimental results. Finally, a conclusion is summarised in Section 5.
2. RELATED WORK
The FP algorithm is commonly used in indoor positioning services. The traditional FP algorithm and some existing improved FP algorithms are introduced in this section.
2.1. Fingerprint positioning algorithm
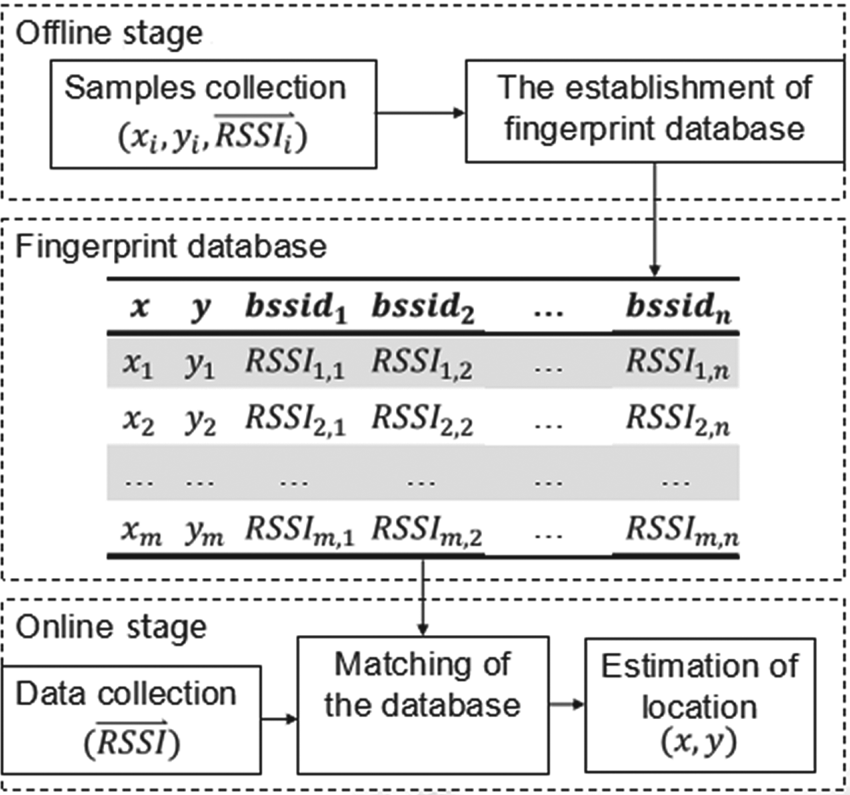
The Wi-Fi fingerprinting method is the most widely used and most practical algorithm of all the indoor positioning algorithms, and is mainly dependent on the RSSI data and the spatial coordinate of the RP. Figure 1 shows the framework of the FP algorithm.
Framework of the FP algorithm.

In the offline stage, the main task is to establish a fingerprint database. First, some points in the location area are selected as the RPs and the spatial coordinates of these RPs are known. At each RP, some information of the AP is recorded by utilising the Wi-Fi signal collector, including the basic service set identifier (BSSID) and RSSI. The BSSID of an AP can be used to distinguish different signal sources, the RSSI vector with length q received from APj at RPi is indicated by  $\{ \mbox{rssi}_{i, j} ( t), \; \ t=1, \; 2, \; \ldots, \; q, \; q\ge 1\}$. The mean value of AP's RSSI vector tends to be stable when q ≥ 30 (Kaemarungsi and Prashant, Reference Kaemarungsi and Krishnamurthy2012). To obtain an appropriate number of samples, different numbers of fingerprints are collected at each RP. Through experiments, the conclusion can be obtained that when q = 60, the positioning error is the lowest. Therefore, the value of q is set to 60 in this paper.
The coordinates of all RPs and the average value of all APs' RSSI vectors  $\mbox{RSSI}_{i, j} =( 1/q) \sum_{t=1}^{q} {\mbox{rssi}_{i, j} ( t) }$ are saved into the fingerprint database. Here DB m, n is used to represent the fingerprint database created in the offline stage and the fingerprint database DB m, n can be expressed as
 $$DB_{m,n} =\left[ {{\begin{matrix} {(x_1,y_1 )} & {\mbox{RSSI}_{1,1} } & {\mbox{RSSI}_{1,2} } & \cdots & {\mbox{RSSI}_{1,n} } \\ {(x_2,y_2 )} & {\mbox{RSSI}_{2,1} } & {\mbox{RSSI}_{2,2} } & \cdots & {\mbox{RSSI}_{2,n} } \\ \vdots & \vdots & \vdots & \ddots & \vdots \\ {(x_m,y_m )} & {\mbox{RSSI}_{m,1} } & {\mbox{RSSI}_{m,2} } & \cdots & {\mbox{RSSI}_{m,n} } \\ \end{matrix} }} \right]$$
Suppose that there are m RPs and n APs in the location area,  $( {x_{i}, \; y_{i} } ) $ represents the spatial coordinate of RPi. Here
 $\mbox{RSSI}_{i, j}$ denotes the average value of the RSSI vector of APj detected at RPi. When the APj cannot be detected at RPi (i.e. the signal of APj is too weak to detected), a minimum fixed value is assigned to
 $\mbox{RSSI}_{i, j} $ and the fixed value is set to −100 (dBm).
In the online stage, the real-time RSSI values of APs are collected and matched with the RSSI vector in the fingerprint database, then the current position can be calculated by the matching algorithm, e.g., the WKNN algorithm.
In the WKNN algorithm, the characteristic distance is used to indicate the positioning distance between the target point and each RP, and the characteristic distance between the real-time measured RSSI vector and the RSSI vector in the fingerprint database can be expressed as
 $$L_i =\left( {\sum\limits_{j=1}^n {\vert {\mbox{rssi}_j -\mbox{RSSI}_{i,j} } \vert^p} } \right)^{1/p}$$
where L i is the characteristic distance, also called the characteristic distance between the target point and the RPi. Here rssij represents the real-time measured RSSI value of APj. When p = 1 and 2, L i represents the Manhattan distance and Euclidean distance, respectively.
After calculating the characteristic distance between the target point and the RPs in the fingerprint database, the first k RPs with the smallest characteristic distance are selected for positioning, the target point's coordinate can be calculated from the weighted average of the k RPs' coordinates, given by
 $$( {\hat {x},\hat {y}} ) =\frac{\sum_{i=1}^k {W_i \cdot ( {x_i,y_i } ) } }{\sum_{i=1}^k {W_i } }$$
where  $( {\hat {x}, \; \hat {y}} ) $ is the estimation coordinate of the target point and W i denotes the weighting coefficient of RPi. In general, W i is equal to the reciprocal of the characteristic distance in most fingerprint algorithms.
The positioning accuracy of the WKNN algorithm is dependent on the value of k: different values of k lead to different positioning accuracies. In fact, it has been shown that the WKNN algorithm has the smallest positioning error when k = 5 (Shin et al., Reference Shin, Lee, Lee and Kim2012). As such, we choose k = 5 when using the WKNN algorithm for positioning.
2.2. Fingerprint algorithm with segment characteristic distance
The Euclidean distance is mostly used in the fingerprint algorithms, but the Manhattan distance can also be used to calculate the characteristic distance. Li et al. (Reference Li, Qiu and Liu2017) simulated the effect of the Manhattan distance and Euclidean distance on the accuracy of the WKNN algorithm and discussed the relationship between the RSSI and the actual distance. Finally, a fingerprint algorithm with segment characteristic distance was proposed to improve the positioning accuracy. The characteristic distance can be expressed as
 $$L_i =\begin{cases} \displaystyle\sum_{j=1}^n {\gamma \cdot \vert {\mbox{rssi}_j -\mbox{RSSI}_{i,j} } \vert, \vert {\mbox{rssi}_j -\mbox{RSSI}_{i,j} } \vert \ge d} \\ \noalign{\vskip6pt} \displaystyle\sum_{j=1}^n {\frac{1}{\gamma }\cdot \vert {\mbox{rssi}_j -\mbox{RSSI}_{i,j} } \vert, \vert {\mbox{rssi}_j -\mbox{RSSI}_{i,j} } \vert < d} \end{cases}$$
where γ and d are the undetermined variables. For each AP, when the difference between the real-time RSSI vector measured at the target point and the RSSI vector in the database is greater than the constant d, the difference is expanded by γ times. In contrast, when the RSSI difference is less than or equal to the constant d, the difference is reduced by γ. Some simulations have been performed in different indoor environments and the mean error of the WKNN algorithm was the smallest when γ = 5, d = 3.
Although the fingerprint algorithm with segment characteristic distance (FP-SCD) performs well in terms of positioning accuracy, the impact of the AP on the positioning accuracy in the offline stage has not been considered by researches, so the FP-SCD requires complicated calculations and the time spent for positioning would be long. The idea of improving the characteristic distance has been adopted in our proposed algorithm and the FP-SCD was used for comparison with the proposed algorithm.
3. PROPOSED ALGORITHM
In this section, a new fingerprint algorithm based on RP selection strategy and AP selection strategy is proposed. As mentioned in the introduction, the size of the fingerprint database is still not sufficiently streamlined in the offline stage, which would affect the accuracy of the final positioning and the time required for positioning. To tackle this issue, a variance-based AP selection strategy and an RP selection strategy based on the spatial subregion are proposed in this section. Note that the data used in this section for analysis and discussion are all from the real experiments of Section 4: the experiments were conducted on the sixth floor of the Physics Building in Central South University, Changsha city, Hunan province, China.
3.1. AP selection strategy
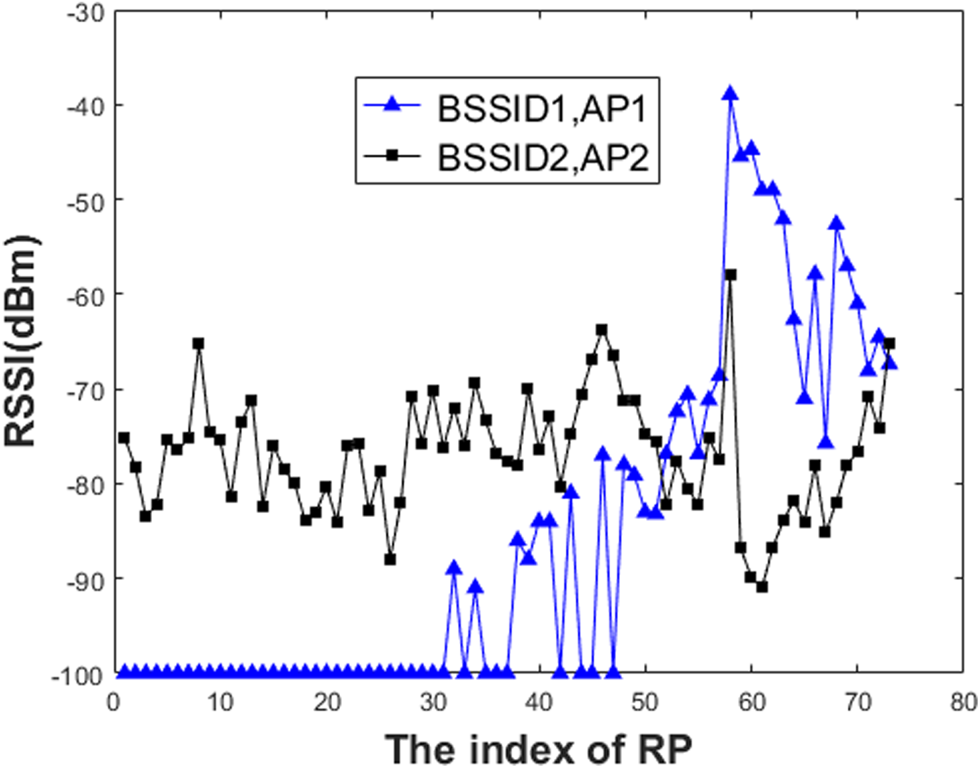
Each AP in the experimental area generates wireless signals that radiate outwards. When the signals propagate in space, they gradually decline owing to multipath effects. The signal distribution of each AP in space is different because of the complex indoor environment. Figure 2 shows the distribution of wireless signals from two different APs.
RSSI distribution curves of two different APs at each RP.

As shown in Figure 2, the RSSI values of AP1's wireless signal is widely distributed in the range of [−90, −40] (dBm) and may not be detected at some RPs, which means that the wireless signal of AP1 decays rapidly in the experimental area. At different RPs, the RSSI values detected by the Wi-Fi signal collector are different, so the spatial location can be distinguished with the wireless signal of AP1. While the RSSI values of AP2 are concentrated in the range of [−90, −60] (dBm), this implies that the attenuation of AP2's wireless signal in the experimental area is lower than AP1's. At different RPs, the RSSI values are similar, so it is difficult to distinguish different spatial positions by using the RSSI value of AP2.
The spatial distributions of wireless signals at different APs are different. The space difference between the wireless signals of some APs is obvious, whereas the space difference between the wireless signals of some other APs is not obvious. Therefore, it is unreasonable to distinguish different APs according to the values of the signal strength. In the AP selection strategy, the variance of RSSI values is selected to describe the spatial discrimination of APs.
For an AP, the variance of RSSI represents the variance of the signal strength at all RPs. It represents the degree of dispersion of the signal strength at all RPs and it can be used to indicate the amount of position information provided by the AP.
The signal strength of AP j at all RPs can be expressed as
 $$V_j =[\mbox{RSSI}_{1,j},\mbox{RSSI}_{2,j},\ldots,\mbox{RSSI}_{i,j},\ldots,\mbox{RSSI}_{M,j}],\quad i=1,2,\ldots,M$$
where M denotes the number of RPs and  $\mbox{RSSI}_{i, j}$ represents the average signal strength of APj at RPi. Then the variance
 $\sigma_{Vj}^{2} $ can be expressed as
 $$\sigma _{Vj}^2 =\frac{(\mbox{RSSI}_{1,j} -\overrightarrow {\mbox{RSSI}} )^2+(\mbox{RSSI}_{2,j} -\overrightarrow {\mbox{RSSI}} )^2+\cdots +(\mbox{RSSI}_{M,j} -\overrightarrow {\mbox{RSSI}} )^2}{M}$$
where  $\overrightarrow {\mbox{RSSI}}$ indicates the average signal strengths of APj at all RPs and the variance of APj can be calculated by formula (6).
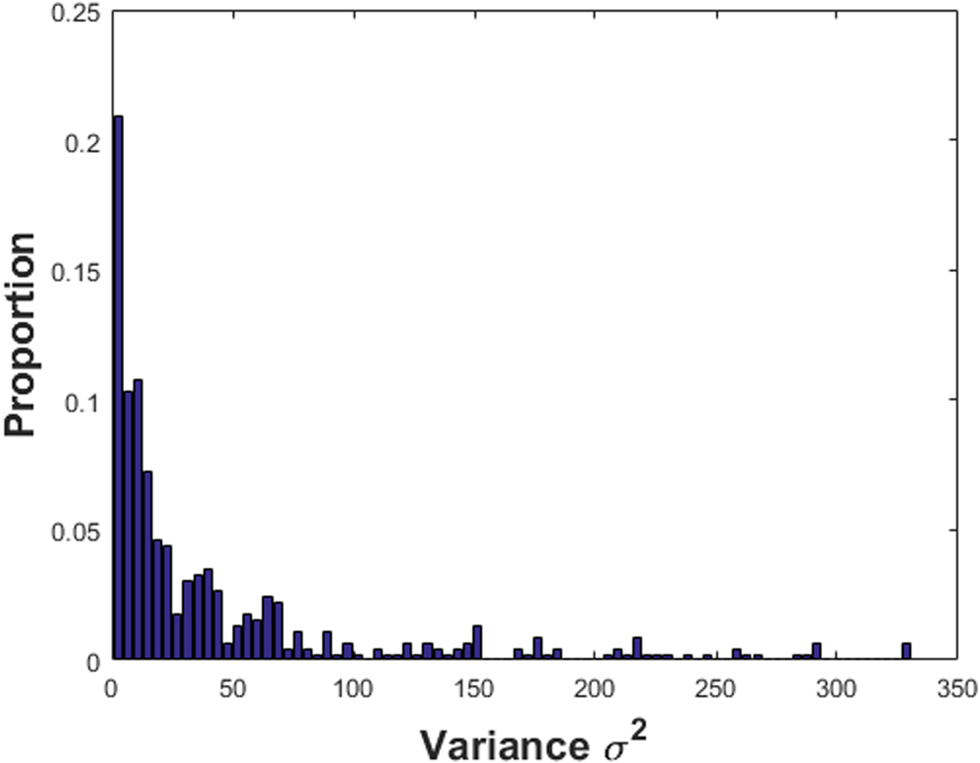
The variance of an AP can be obtained by calculating the signal strength of the AP at all RPs, after calculating the variance of all APs, and the variance distribution of all APs is shown in Figure 3. Table 1 shows the signal strength variance distribution of all APs. The variance of most APs is low, this means that spatial discrimination of most APs is low. The ratio of the signal strength variance being less than 50 is 73·19%, which means that if the AP whose signal strength variance is less than 50 is screened out, the total number of APs in the fingerprint database can be reduced by 73·19%.
The variance distribution of all APs.

The variance distribution of all APs.

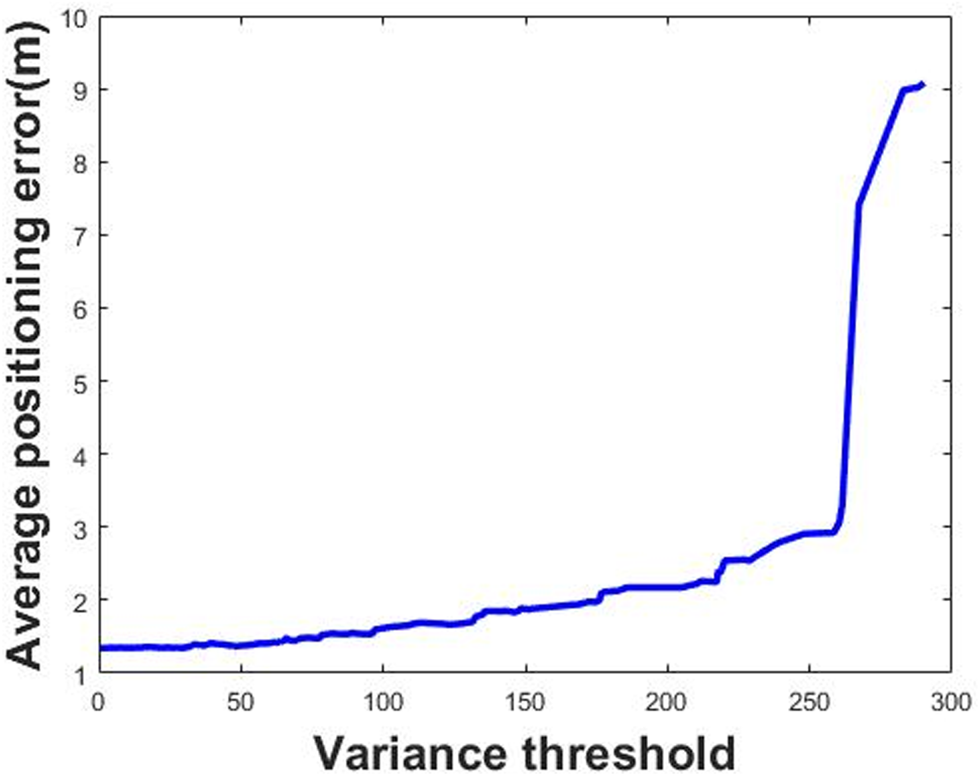
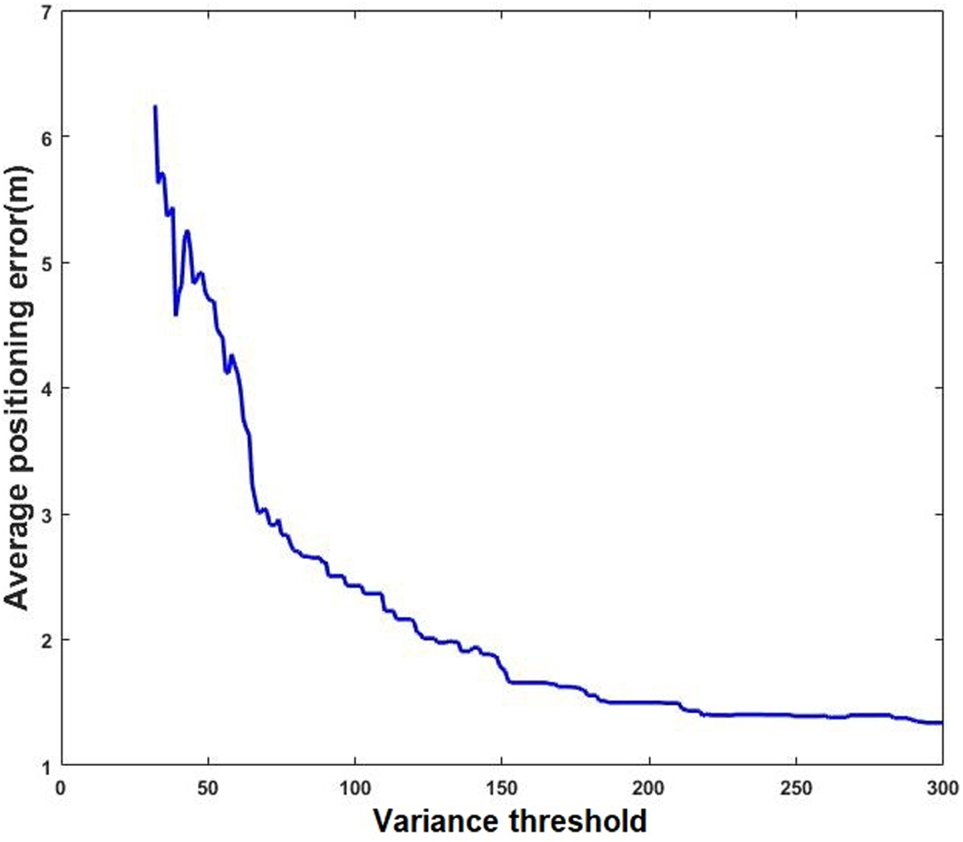
Figure 4 shows the positioning error of fingerprint algorithm after screening out the AP whose variance is less than the variance threshold σ2. Any point on the curve in Figure 4 indicates that the average estimation error of the WKNN algorithm is the value corresponding to the ordinate after screening out the APs with variance less than the value corresponding to the abscissa. As the variance threshold σ2 increases, the average estimation error of the algorithm increases. The greater the number of APs screened out, the higher the positioning error. Figure 5 shows the average positioning error of fingerprint algorithm after screening out the APs the variance beyond the variance threshold σ2. Any point on the curve in Figure 5 indicates that the average estimation error of the WKNN algorithm is the value corresponding to the ordinate after screening out APs with variance exceeding the value corresponding to the abscissa. As the variance threshold σ2 increases, the average estimation error of the algorithm decreases.
The positioning effect of the fingerprint algorithm after screening out the APs with variance below a certain threshold.

The positioning effect of fingerprint algorithm after screening out the APs with variance beyond a certain threshold.

If the APs with low spatial discriminability were screened out, they would not be saved into the fingerprint database, the number of APs used to calculate the characteristic distance in the online stage would decrease, and the amount of location information provided by these APs would also decrease. That is why the positioning error increases. On the other hand, if these APs were screened out, the final positioning result would not change too much. This is why the positioning error grows so slowly as the variance threshold increases. The same observations can be made in Figure 5.
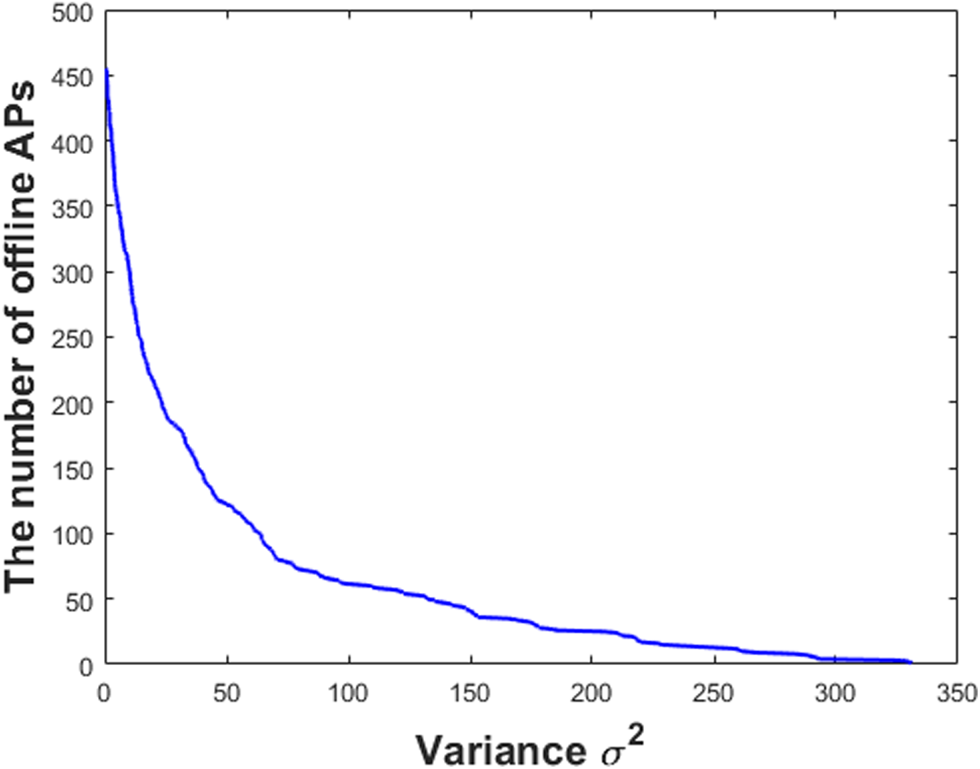
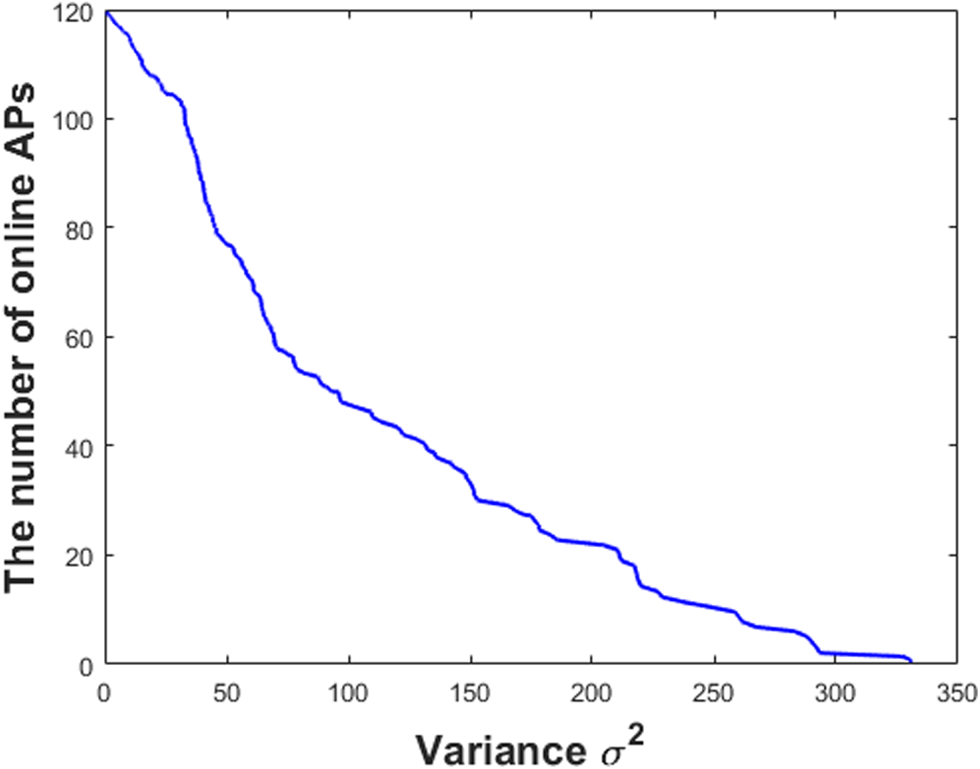
The APs saved into the database in the offline stage are referred to as the offline APs: the higher the number of offline APs, the larger the database. The APs used to calculate the characteristic distance in the online stage are referred to as the online APs. Figures 6 and 7 show the relationship between the number of offline/online APs and the variance threshold.
The relationship between the variance threshold and the number of offline APs.

The relationship between the variance threshold and the number of online APs.

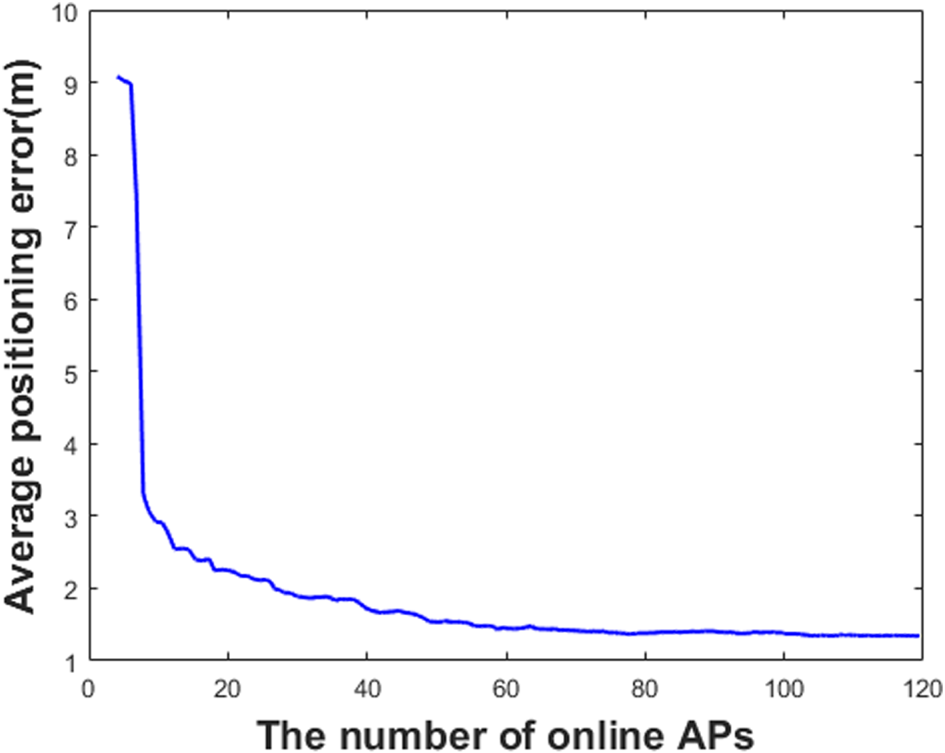
As shown in Figures 6 and 7, the number of offline APs and online APs decrease gradually as the variance threshold increases. Any point on the curve in Figures 6 and 7 indicates that the number of offline/online APs is the value corresponding to the ordinate after screening out APs with variance lower than the value corresponding to the abscissa and the fingerprint database is reconstructed. As the variance threshold increases, the stricter the conditions for screening APs become and the fewer APs remain. The relationship between the number of online APs 2 and the positioning error is shown in Figure 8.
The relationship between the number of online APs and the average positioning.

Figure 8 shows that the average positioning error decreases gradually as the number of online APs increases. This is because a large number of online APs and a longer RSSI vector lead to higher accuracy of the positioning matching. As the number of online APs increases, the more location information these APs can provide, the more accurate the positioning result can be obtained. However, when the number of online AP reaches a certain level, the positioning accuracy of the fingerprint algorithm approaches a fixed value. The reason is that the location information provided by online APs is sufficient for positioning. The fixed value and the number of APs can be obtained from Table 3. The fixed average positioning error is 1·34 m and the number of online APs is 104.
From the above analysis, the larger the variance threshold, the fewer online APs remain after the AP selection strategy. Correspondingly, the fingerprint database would be smaller and the positioning error would be higher. Therefore, it is necessary to find a suitable variance threshold to balance the database size and the positioning accuracy.
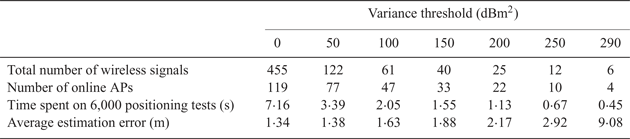
Figure 4 and Table 2 show that when the variance threshold changes from 0 dBm2 to 50 dBm2, the positioning error of the fingerprint algorithm is almost unchanged. When the positioning error of the fingerprint algorithm is a constant, the maximum variance threshold is selected as the suitable variance threshold in the AP selection strategy. This ensures that the minimum positioning error can be achieved and the APs are filtered out as much as possible to reduce the size of the fingerprint database. To obtain a suitable variance threshold, 60 sets of data collected at each test point in the online stage were used in this experiment. At each test point, each set of data corresponds to one positioning result and there are 100 test points in the experiment area. Therefore, a total of 6,000 tests were carried out. The average positioning error was obtained by 6,000 tests. The relationship between the variance threshold and the average positioning error is listed in Table 3.
The result after the AP selection strategy.

The variance threshold and the average positioning error data.

Table 3 lists the maximum value of the variance threshold as 29 dBm2 when the average positioning error achieves its minimum, 1·34 m. When the variance threshold is 29 dBm2, the positioning error is minimal and the size of the fingerprint database can be reduced. Therefore, the variance threshold in the AP selection strategy is set to 29 dBm2.
3.2. The Kalman filter algorithm
The Kalman filter algorithm is an algorithm for optimally estimating the state of the system by inputting and outputting observation data on the basis of the state equation of the linear system. Each iteration includes two stages of prediction and correction, and each iteration only needs to record the last system state and error covariance, thus the Kalman filter algorithm has a better denoising effect than the other filter algorithms. Therefore, the Kalman filter algorithm has been widely used.
For a linear system, it can be described by an equation of state and observation equation. At time k,  $x( k ) $ represents the system state,
 $u( k ) $ denotes the control amount,
 $w( k ) $ represents the process noise,
 $z( k ) $ indicates the observation value of the system and y(k) represents the measurement noise. Here A and B are the system parameters and H is the parameter of the measurement system. The state equation and observation equation can be expressed as
 $$\begin{aligned} x(k)&=A\bullet x(k-1)+B\bullet u(k)+w(k) \\ z(k)&=H\bullet x(k)+y(k) \end{aligned}$$
In the prediction stage,  $\hat {x}( k\vert k-1) $ represents the state variable at time k,
 $\hat {P}( k\vert k-1) $ denotes the predicted value of the error covariance at time k and
 $P( {k-1} ) $ indicates the error covariance at time k − 1. The entire prediction process can be expressed as
 $$\begin{cases} {\hat {x}(k\vert k-1)=A\bullet x(k-1)+B\bullet u(k)} \\ {\hat {P}(k\vert k-1)=A\bullet P(k-1)+Q} \end{cases}$$
In the correction stage, the process of entire predication can be expressed as
 $$\begin{cases} K(\mbox{k})=\hat {P}(k\vert k-1)\bullet H^T\bullet ((H\bullet \hat{P}(k\vert k-1)\bullet H^T+R)^{-1} \\ {x(k)=\hat {x}(k\vert k-1)+K(k)\bullet (z(k)-H\bullet \hat {x}(k\vert k-1))} \\ {P(k)=(I-K(k)\bullet H)\bullet \hat {P}(k\vert k-1)} \end{cases}$$
where  $K( k ) $ represents the Kalman gain at time k, and I represents the identity matrix. This paper considers the use of the Kalman filter algorithm to process the RSSI values collected in the online stage. The Kalman filter algorithm can be simplified according to the actual situation. In indoor positioning, when the experimenter collects data at the target point, their positioning is basically unchanged, so the control amount can be set to 0. In addition, when the Kalman filter algorithm is only used to process single-signal data, A and H can be set to 1. Then, the formula in the prediction and correction stage can be expressed as
 $$\begin{cases} {K(x)=\hat {P}(k\vert k-1)/\hat {P}(k\vert k-1)+R} \\ {x(k)=x(k-1)+K(k)\bullet (z(k)-x(k-1))} \\ {\hat {P}(k+1\vert k)=(1-K(k))\bullet \hat {P}(k\vert k-1)+Q} \end{cases}$$
The Minkowski distance is mainly used to calculate the distance between two points. Assuming that the coordinate of point P is  $( {x_{1}, \; x_{2}, \; \ldots, \; x_{n} } ) $ and the coordinate of point Q is
 $( {y_{1}, \; y_{2}, \; \ldots, \; y_{n} } ) $, then the distance between two points can be expressed as
 $$D=\left( {\sum_{i=1}^n {\vert {x_i -y_i } \vert^p} } \right)^{1/p}$$
When p = 1 and 2, D represents the Manhattan distance and Euclidean distance, respectively. In the WKNN algorithm, the Minkowski distance is used to calculate the characteristic distance of two points. When the parameter p takes different values, the characteristic distance between two points is different, then the positioning result would be different.
In the WKNN algorithm, the Kalman filter algorithm is used to process signal strength data in the online stage. The average estimation error before and after filtering is listed in Table 4. When the value of p is 1·5 or 2, the positioning error is minimal, when p is equal to 1·5, the calculation of characteristic distance on computer would be very complicated, so the Euclidean distance is chosen as the characteristic distance for the positioning in this paper.
The average estimation error before and after filtering.

Table 4 demonstrates that after the signal strength data are processed by the Kalman filter algorithm, the average estimation error becomes lower. We conclude that it is feasible to use the Kalman filter algorithm in the online stage.
3.3. RP selection strategy
For the selection strategy of the RPs, Xue et al. (Reference Xue, Hua, Li, Yu and Qiu2018) showed that the k RPs with the smallest characteristic distance were not the k RPs closest to the target point and an improved neighbouring RPs selection method for Wi-Fi-based indoor localisation was proposed. To avoid selected RPs being on one side of the test point, the physical distances between the neighbouring RPs and the test point were exploited for clustering these KNNs. However, the selection process is too simple and the effect of the selection strategy is imperfect.
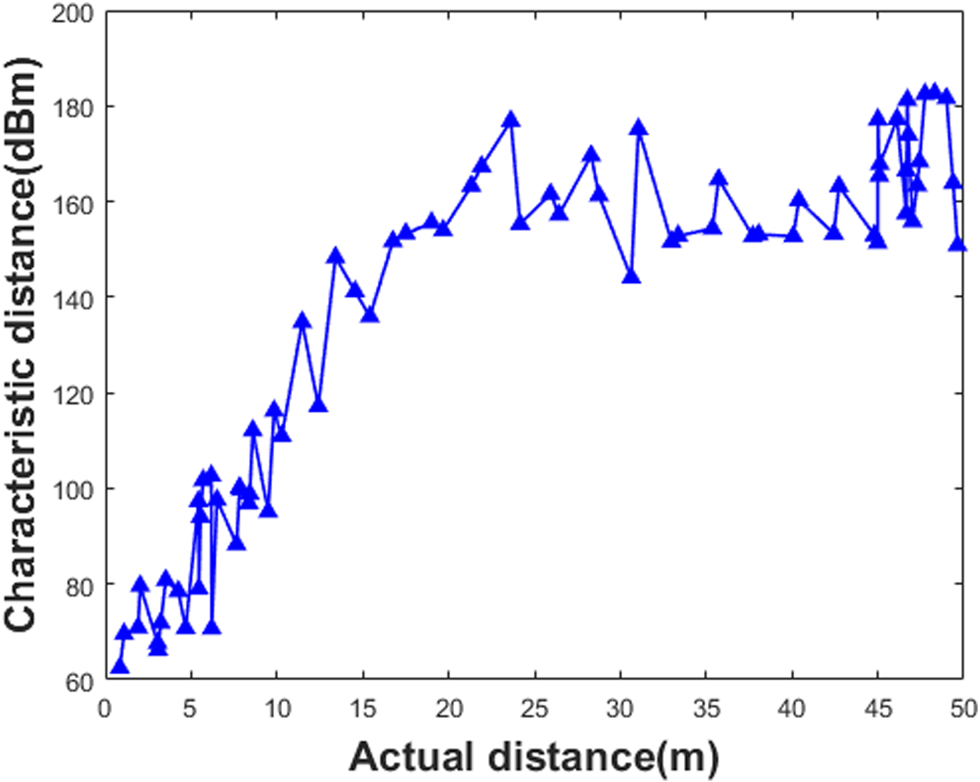
In the fingerprint algorithm, the actual distance between the target point and each RP can be expressed by the characteristic distance. However, the actual distance and the characteristic distance are not linearly correlated. Figure 9 shows the relationship between the actual distance and the characteristic distance in a positioning process.
The relationship between the actual distance and the characteristic distance.

Figure 9 shows that the actual distance and the characteristic distance are not strictly positively related: some RPs with large actual distance have small characteristic distance. If these RPs are selected for positioning, the estimated position would deviate greatly from the true position of the target point. To solve this problem, an RP selection strategy based on spatial subregions and regional characteristic distances is proposed.
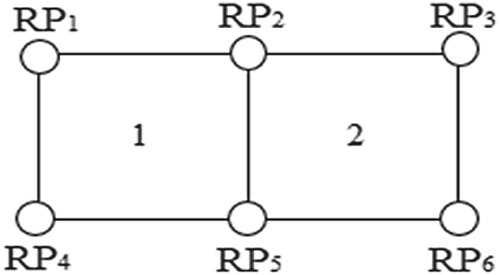
In the offline stage, the target area here is square with RPs distributed uniformly. A square area is defined as a spatial subregion and the regional characteristic distance of the spatial subregion can be calculated by adding the characteristic distances of the four RPs that make up the spatial subregion.
Figure 10 shows the structure of the spatial subregion. The spatial subregion 1 is surrounded by RP1, RP2, RP4 and RP5, the regional characteristic distance of spatial subregion 1 can be calculated by the formula  $RL_{1} =L_{1} +L_{2} +L_{4} +L_{5} $, where L 1, L 2, L 4 and L 5 denote the characteristic distance of RP1, RP2, RP4 and RP5, respectively.
Spatial subregion.

After calculating the regional characteristic distance of each spatial subregion, one or more spatial subregions with the smallest regional characteristic distance are selected as a result of the regional estimation. After the test points are determined into one or more spatial subregions, the RPs outside these spatial subregions are filtered out and the k RPs with smallest characteristic distance from the remaining RPs are selected for positioning. Finally, the position of the target point can be calculated by the WKNN algorithm.
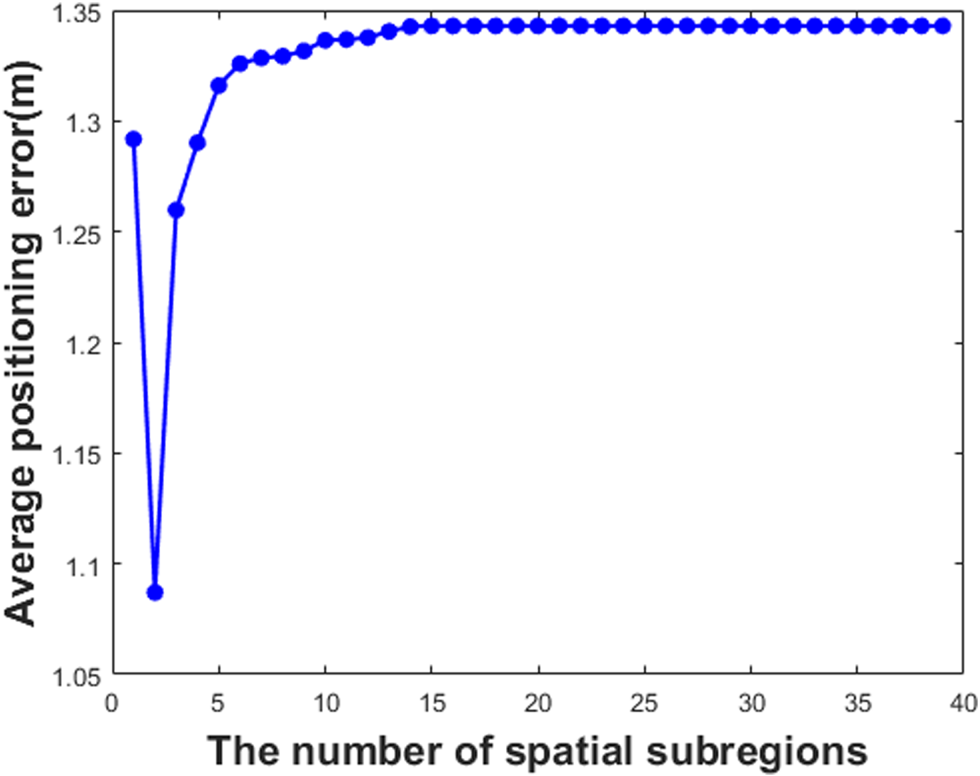
In the RP selection strategy, the final positioning error is dependent on the number of spatial subregions contained in the regional estimation, Figure 11 shows the relationship between the positioning error and the number of spatial subregions contained in the regional estimation.
The relationship between positioning error and the number of spatial subregions.

Figure 11 shows that the average positioning error first decreases then increases as the number of spatial subregions increases. When the number of spatial subregions is 2, the positioning error is the lowest. This indicates that the effect of the RP selection strategy is best when the number of subregions is 2. The explanation for this observation is as follows. The WKNN algorithm has the smallest positioning error when k = 5 (Shin et al., Reference Shin, Lee, Lee and Kim2012). When the number of subregions is 1, only 4 RPs are left after the other RPs are screened out, and the positioning accuracy is not improved significantly. When the number of subregions is 2, 6 RPs can be left after the other RPs are screened out. Since the WKNN algorithm has the lowest positioning error when k = 5, when the number of subregions is 2, the positioning error is the lowest. To verify the accuracy of this conclusion and make it more convincing, the same experiment was repeated 60 times in the real experimental scenario, but, in the end, the same conclusion was obtained: when the number of subregions is 2, the positioning error is the lowest. Therefore, the number of spatial regions contained in the regional estimation is set to 2 in the RP selection strategy.
3.4. The proposed FP algorithm
The proposed FP algorithm is as follows:

4. EXPERIMENT AND ANALYSIS
The experimental results and analysis are presented in this section.
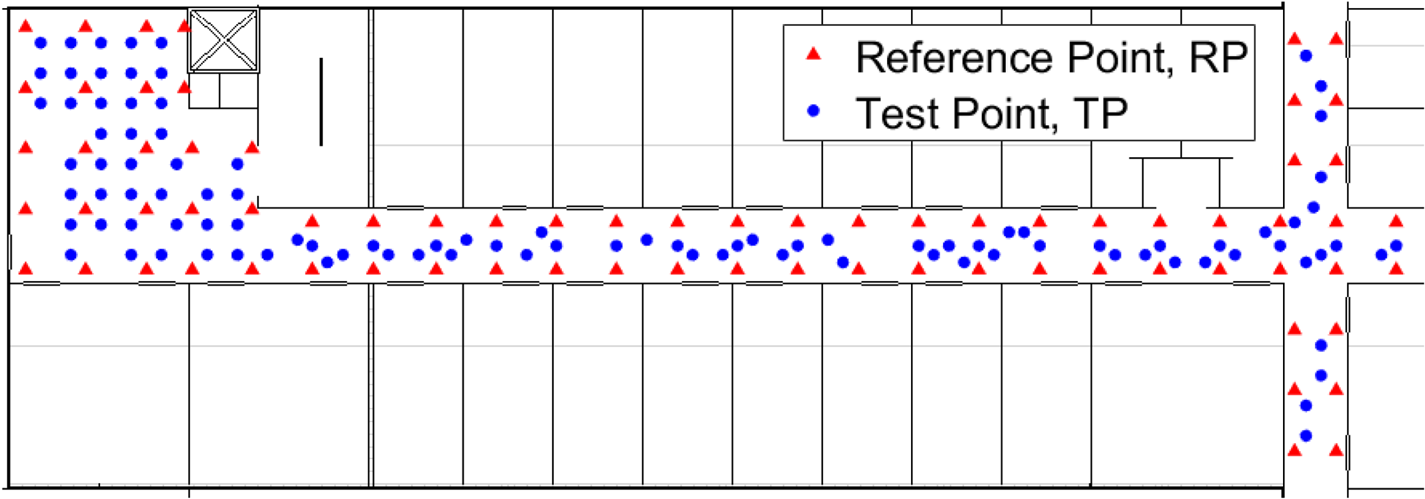
To evaluate the performance of our proposed algorithm, the experiments were conducted on the sixth floor of the Physics Building in Central South University with the dimensions of  $50\, {\rm m}\times 16\, {\rm m}$. The RPs were separated by 2·4 m, marked with red triangles. The test points (TPs) were chosen randomly in the experimental area and marked with blue dots. An application named Wi-Fi signal collector was developed and installed on smartphones to collect the RSSI data. To test the performance of our proposed algorithm, two different smartphones were used to collect RSSI data separately. The specific experimental scenarios, the location of the offline RPs and the online test points are shown in Figure 12.
Deployment of RPs and TPs.

There were 73 RPs in the experimental environment and 60 sets of RSSI samples at a sampling frequency of 1 Hz were collected at each RP, and the average value of 60 sets of RSSI samples was used to establish a fingerprint database. There were 100 TPs in the experiment environment and 60 sets of RSSI samples at a sampling frequency of 1 Hz were collected at each TP.
In the offline stage, the variance-based AP selection strategy was used to filter out the APs that contribute little to the final positioning result and the variance threshold in the AP selection strategy was set to 29 dBm2. The number of APs before and after using the AP selection strategy is shown in Table 5.
The number of APs

The total number of APs collected by phone 1 was 455 and the total number of APs collected by phone 2 was 401. The reason for this difference is that different smartphones are equipped with different sensors and the capabilities of these sensors are different. However, the number of APs for both smartphones were reduced by at least 42·64% by using the AP selection strategy showing that the size of the fingerprint database is greatly reduced after screening out some APs. This would greatly reduce the size of the fingerprint database and reduce the time required for positioning.
In the online stage, the data collected from two different smartphones were used for the positioning experiments, with each smart phone collecting Wi-Fi signals at 100 TPs and 60 sets of signal strength data collected at each TP. That is, each smart phone has  $100\times 60=6, \; 000$ sets of test data and the experimental results in this section were obtained from 6,000 sets of data on 100 TPs.
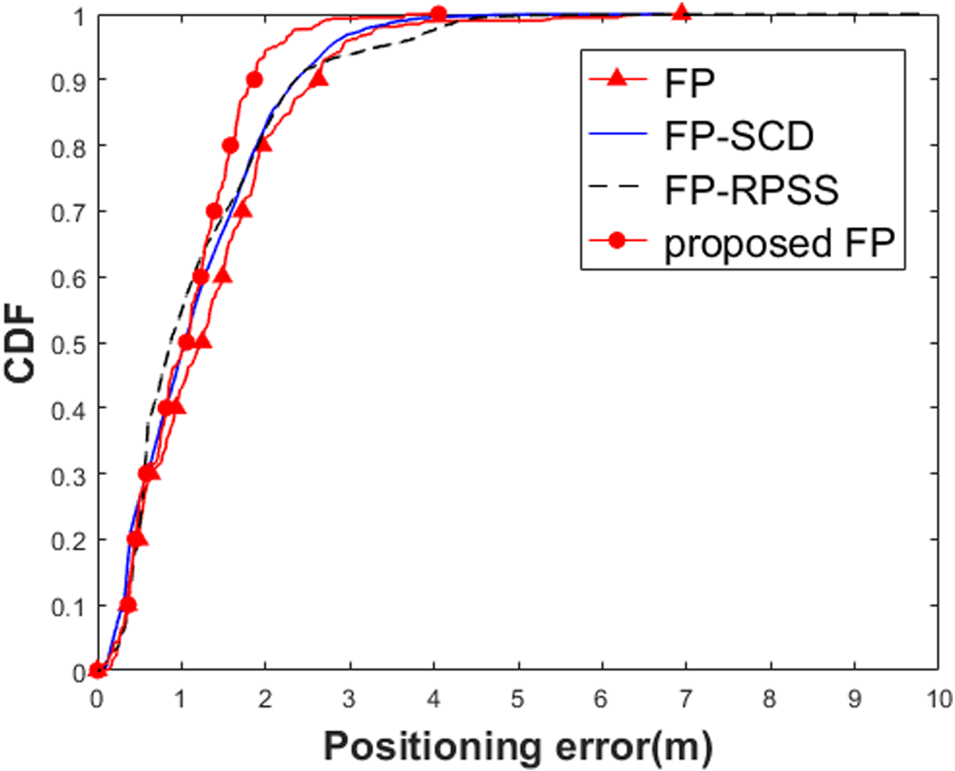
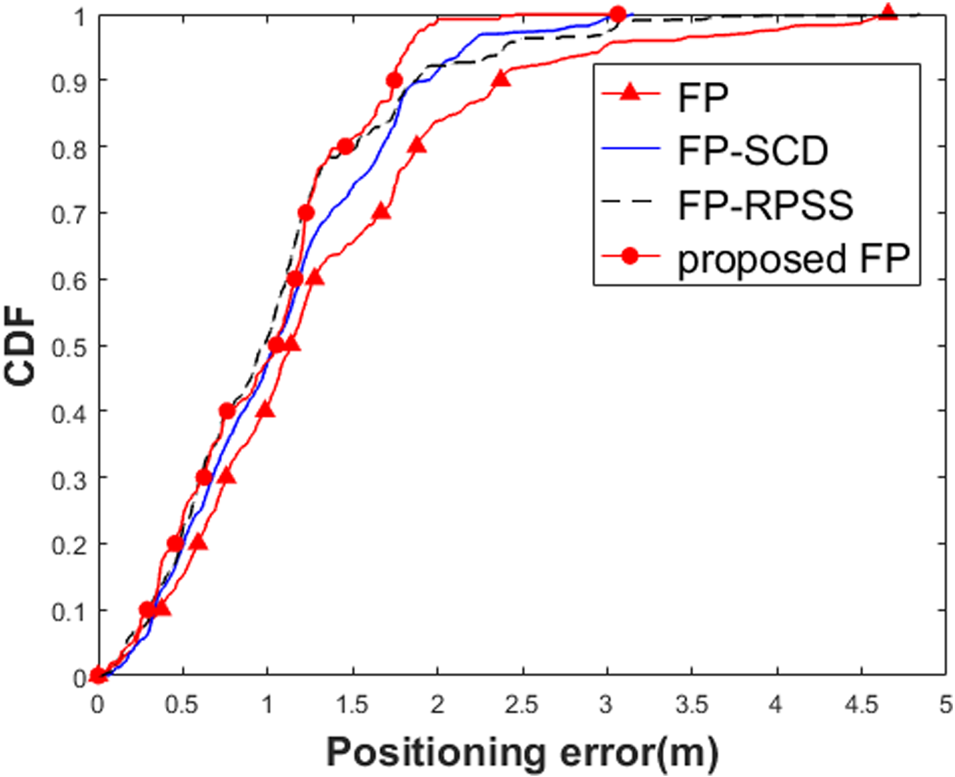
In particular, FP-SCD is a fingerprint algorithm with segment characteristic distance, and was proposed by Li in 2017. In this algorithm, they simulated the effect of the Manhattan distance and Euclidean distance on the accuracy of the WKNN algorithm and discussed the relationship between the RSSI and the actual distance. However, the effect of the AP on the positioning accuracy in the offline stage has not been considered. Simultaneously, the fingerprint algorithm with RP selection strategy (FP-RPSS) is an improved FP algorithm based on the actual distance RP selection strategy and was proposed by Xue in 2018. In this algorithm, they pointed out that the k RPs with the smallest characteristic distance were not the k RPs closest to the target point and an improved neighbouring RPs selection method for Wi-Fi-based indoor localisation was proposed. However, the selection strategy was too simple and the effect of the selection strategy was imperfect. In this paper, an improved fingerprint algorithm with AP selection strategy and RP selection strategy is proposed. To test the performance of our proposed algorithm, the FP, FP-SCD and FP-RPSS are compared with our proposed algorithm. Figures 13 and 14 show the cumulative distribution function (CDF) of positioning errors with different algorithms on the two phones.
CDF of positioning error with different algorithms on phone 1.

CDF of positioning error with different algorithms on phone 2.

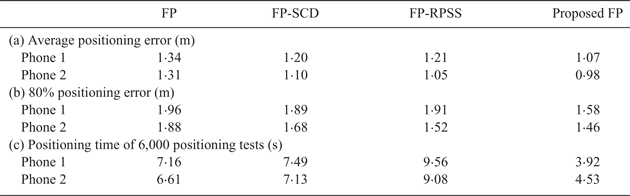
Figures 13 and 14 show the proposed FP algorithm can achieve the lowest positioning error and the highest positioning accuracy compared with the other three algorithms. This shows that the AP selection and RP selection strategies are effective for improving the indoor positioning accuracy. To show the performance of our proposed algorithm in more detail, the average positioning error, 80% positioning error and the positioning time of 6,000 positioning tests of different algorithms are listed in Table 6.
The positioning performance.

Table 6 demonstrates the performance of different algorithms on two smartphones. Three important conclusions can be drawn. First, the average positioning error of our proposed algorithm on phone 1 is reduced by 20·15% and 10·83% compared with the FP algorithm and FP-SCD. This demonstrates that our proposed algorithm outperforms the FP algorithm and FP-SCD, because the RP selection strategy can effectively screen out RPs that are far from the target point but with a small characteristic distance, so the positioning error can be reduced. Second, the positioning time of 6,000 positioning tests of our proposed algorithm on phone 1 is reduced by 45·25%, 47·66% and 59·00% compared with the FP, FP-SCD and FP-RPSS, respectively. The reason for this result is that the variance-based AP selection strategy can filter out the APs that contribute little to the final positioning result, so the size of the fingerprint database and the amount of real-time positioning calculation required are reduced. Third, the average positioning error of our proposed algorithm on phone 1 is reduced by 10·83% and 11·57% compared with FP-SCD and FP-RPSS. This demonstrates that our proposed algorithm outperforms the FP-SCD and FP-RPSS, because the RP selection strategy and the AP selection strategy work well separately. Simultaneously, the same conclusion can also be drawn on phone 2.
In a word, the average positioning error and the 80% positioning error of the proposed algorithm are smaller than with the other three fingerprint algorithms. In addition, the number of APs and the total calculation required in the online stage are reduced, leading to the fact that the positioning time of 6,000 positioning tests of the proposed algorithm is shorter than with the other three algorithms. The average positioning error of the proposed algorithm on phone 1 is 1·07 m. Compared with the other three fingerprint algorithms, it decreased by 20·15%, 10·83%, and 11·57%, respectively, and the positioning time of 6,000 positioning tests of the proposed algorithm decreased by 45·25%, 47·66% and 59·00%, respectively. The average positioning error of the proposed algorithm on phone 2 is only 0·98 m, which reached the decimetre level. Compared with the other three fingerprint algorithms, the average positioning error of the proposed algorithm decreased by 25·19%, 10·91%, and 6·67%, respectively, and the positioning time of 6,000 positioning tests of the proposed algorithm decreased by 31·47%, 36·47% and 50·11%, respectively.
To make our experimental results more convincing, the same experiment was conducted on the second floor of the Physics Building in the Central South University, Changsha city, Hunan province, China. Table 7 lists the average positioning error and the positioning time of 6,000 positioning tests of different algorithms.
The positioning performance of different algorithms.

Table 7 demonstrates that our proposed algorithm outperforms the FP algorithm and FP-SCD and FP-RPSS, both in the average positioning error and the positioning time of 6,000 positioning tests. This conclusion is also applicable in other localisation scenarios. Therefore, our proposed algorithm has a good application in real positioning scenarios.
5. CONCLUSION
The fingerprint algorithm is the most commonly used algorithm in indoor positioning, but it suffers from the problem that the fingerprint database can be too large and the positioning accuracy is still unsatisfactory. An improved fingerprint algorithm with the AP and RP selection strategies has been proposed in this paper. The proposed algorithm can be divided into two stages, the offline stage and the online stage. In the offline stage, for an AP, the variance of the signal strength at all RPs is used to evaluate the amount of location information provided by this AP. The APs with signal strength variance beyond the variance threshold are filtered out and the size of the fingerprint database is thus reduced. In the online stage, a Kalman filter algorithm is used to process the real-time RSSI data to reduce the influence of noise on the positioning accuracy. The concepts of spatial subregion and regional characteristic distance were proposed, and some RPs that are far from the target point but with a small characteristic distance are screened out to improve the positioning accuracy.
To evaluate the performance of the proposed algorithm, experiments were carried out on the sixth floor of the Physics Building in Central South University, Changsha city, Hunan province, China. Experimental results showed that the proposed algorithm outperforms the FP, FP-SCD and FP-RPSS algorithms, with regards to both the average positioning error and the positioning time of 6,000 positioning tests. In particular, the proposed algorithm reduced the size of fingerprint database by more than 42·64% and reduced the average positioning error by 20·15%, 10·83% and 11·57% compared with the three existing algorithms, respectively. In addition, the positioning time of 6,000 positioning tests of the proposed algorithm was reduced by 45·25%, 47·66% and 59·00% compared with the three existing fingerprint algorithms, respectively.
The proposed algorithm significantly reduces the size of fingerprint database and the total calculation of the online stage and improves the positioning accuracy. However, the workload of data collection in the offline stage is still large. Future work can be done to further reduce the workload of data collection.
ACKNOWLEDEGMENTS
This work was supported by Science and Technology Planning Project of Hunan Province, China (Project Number: 2015GK3003) and the Fundamental Research Fund for the Central South University (Grant NO. 2018zzts341).
CONFLICT OF INTEREST
None.