Introduction
Posttraumatic stress disorder (PTSD) is a common psychiatric disorder characterized by the presence of four symptom clusters: re-experiencing, avoidance, negative cognitions and mood, and arousal. These symptoms are associated with the traumatic event(s), followed by exposure to a variety of stressors, including military combat, physical or sexual assault, accident, and natural disasters.
Many neuroimaging studies have revealed that many potential structural abnormalities of the human brain are implicated in the pathogenesis of PTSD. Furthermore, hippocampus and amygdala are the two key regions. Specifically, a smaller hippocampal volume has been reported in PTSD relative to trauma-exposed subjects without PTSD and/or non-exposed controls in many studies (Bromis, Calem, Reinders, Williams, & Kempton, Reference Bromis, Calem, Reinders, Williams and Kempton2018; Karl et al., Reference Karl, Schaefer, Malta, Dorfel, Rohleder and Werner2006; O'Doherty, Chitty, Saddiqui, Bennett, & Lagopoulos, Reference O'Doherty, Chitty, Saddiqui, Bennett and Lagopoulos2015). For example, Karl et al. (Reference Karl, Schaefer, Malta, Dorfel, Rohleder and Werner2006) found that the bilateral hippocampal volumes were significantly lower in PTSD subjects compared with trauma-exposed subjects without PTSD. However, only the smaller right hippocampus was detected in the PTSD group than the traumatized control group (Bromis et al., Reference Bromis, Calem, Reinders, Williams and Kempton2018). In the meta-analyses by Smith, PTSD patients had a 6.9% smaller left hippocampal volume and a 6.6% smaller right hippocampal volume compared with control subjects exposed to similar levels of trauma (Smith, Reference Smith2005). Moreover, other studies have failed to detect hippocampal volume reduction in PTSD (Jatzko et al., Reference Jatzko, Rothenhofer, Schmitt, Gaser, Demirakca, Weber-Fahr and Braus2006; Yehuda et al., Reference Yehuda, Golier, Tischler, Harvey, Newmark, Yang and Buchsbaum2007). These inconsistent findings might be due to different experimental approaches, heterogeneity of patients' trauma, distinct comparison groups and small sample size.
Usually, PTSD subjects are commonly compared to either trauma-naive controls or trauma-exposed subjects without PTSD (Patel, Spreng, Shin, & Girard, Reference Patel, Spreng, Shin and Girard2012). Thus, it is uncertain whether the identified brain function abnormalities are specific to this disorder. Emerging evidence suggests that traumatic stress is associated with similar brain function alterations as seen in PTSD (Stark et al., Reference Stark, Parsons, Van Hartevelt, Charquero-Ballester, McManners, Ehlers and Kringelbach2015). Furthermore, PTSD symptoms caused by various trauma types are associated with different patterns of psychopathology (Kelley, Weathers, McDevitt-Murphy, Eakin, & Flood, Reference Kelley, Weathers, McDevitt-Murphy, Eakin and Flood2009). A meta-analysis indicated that PTSD patients with distinct types of trauma may differ in cerebral deficits (Meng et al., Reference Meng, Qiu, Zhu, Lama, Lui, Gong and Zhang2014). To overcome these problems, the present study investigates volume changes in recent-onset PTSD patients in comparison with two control groups.
Granger causality (GC) analysis can delineate information flow by detecting whether neural activity in a region precedes and allows prediction of the activity in another region. Being time-dependent, GC analysis had been widely used in resting-state functional data analysis for several neuropsychiatric diseases such as epilepsy (Fan et al., Reference Fan, Yan, Shan, Shang, Wang, Wang and Zhao2016; Klugah-Brown et al., Reference Klugah-Brown, Luo, Peng, He, Li, Dong and Yao2019), schizophrenia (Chen et al., Reference Chen, Jiang, Chen, He, Dong, Hou and Luo2017) and stroke (Zhao et al., Reference Zhao, Wang, Fan, Yin, Sun, Jia and Gong2016). When morphometric data are sequenced with given temporal information according to progression information such as disease symptom scores, GC analysis can be utilized to evaluate the causal relationships of structural alterations among brain regions. This so-called causal structural covariance network (CaSCN) analysis had been successfully used in a recent epilepsy study (Zhang et al., Reference Zhang, Liao, Xu, Wei, Zhou, Sun and Lu2017) and schizophrenia (Jiang et al., Reference Jiang, Luo, Li, Duan, He, Chen and Yao2018).
Thus, we hypothesized that the CaSCN could be used to characterize the progressive alterations of the structural brain network in PTSD patients. This study aimed to explore the progressive profiles of the structural network throughout the symptoms of the illness and to further evaluate the causal effect of structural changes in patients with PTSD using CaSCN analysis.
Methods
Participants and clinical assessment
On 18 July 2014, a category 5 super typhoon – Typhoon Rammasun struck Wenchang city of the Hainan Province, China. The residents were heavily affected by this typhoon, which caused at least 14 deaths. Particularly, in Luodou farm of Wenchang city, more than 1000 people were trapped and almost drowned by the storm tide induced by this destructive typhoon. We recruited 70 typhoon-exposed subjects from this area. Among them, 36 had PTSD (9 males and 27 females) and 34 had no PTSD (trauma-exposed control, TEC; 7 males and 27 females), who were all screened with the PTSD Checklist-Civilian Version (PCL). The PCL is a 17-item self-report questionnaire that measures the severity of DSM-IV-defined PTSD symptoms on a 5-point ordinal scale ranging from 1 (not at all) to 5 (extremely). The PTSD diagnosis was based on the DSM-IV diagnostic criteria for current PTSD and symptoms were assessed with the Clinician-Administered PTSD Scale (CAPS) (Weathers, Keane, & Davidson, Reference Weathers, Keane and Davidson2001). The CAPS for DSM-IV is a structured interview assessing the frequency and intensity of each PTSD symptom using behaviourally anchored ratings (from 0 to 4). This scale assesses the 17 core PTSD symptoms listed in DSM-IV and provides information regarding symptom onset, duration and functional impact. The absence or presence of comorbid disorders was determined via the Structural Clinical Interview for DSM-IV. Furthermore, 32 healthy controls (HCs, 9 males and 23 females) who did not meet DSM-IV Criterion A1 for PTSD were recruited via an advertisement in Haikou, a city approximately 35 km from Wenchang city. For all participants, the Self-Rating Anxiety Scale (SAS) (Zung, Reference Zung1971) and Self-Rating Depression Scale (SDS) (Zung, Reference Zung1965) were administered to assess anxiety and depression symptoms, respectively. All the above procedures took place between November 2014 and January 2015.
The general exclusion criteria included age <18 years or >65 years, left-handedness, a history of head injury or loss of consciousness, significant medical and neurological conditions, comorbid lifetime or current psychiatric disorders other than depression and anxiety, alcohol or drug abuse/dependence, use of psychiatric medication, and contraindications to MRI, such as claustrophobia, pregnancy, and ferromagnetic implants. In the PTSD group, complete MR images were not available for three female subjects, and six were removed due to denture-related artifacts (one female, one male), a brain infarction revealed by conventional MRI (1 female), pregnancy (one female) and excessive movement during MRI scanning (translation >1.5 mm or rotation >1.5° in any direction, one male and one female). Additionally, we excluded one female TEC for excessive movement and two male HCs for brain infarction. All traumatized subjects including PTSD and TEC had not undergone any psychological therapy or medication at the time of the study. Thus, 27 PTSD patients, 33 TECs and 30 HCs were finally included in the statistical analysis. The study was in accordance with the declaration of Helsinki and was approved by the ethics committee of Hainan General Hospital and the Second Xiangya Hospital of Central South University. All participants provided written informed consent after receiving a detailed description of this study.
MRI data acquisition
Magnetic resonance imaging scans were conducted at Hainan General Hospital on a 3 Tesla MR scanner (Skyra, Siemens Medical Solutions, Erlangen, Germany) equipped with a 32 channel standard head coil. Subjects' heads were immobilized using a foam pad and a Plexiglas head cradle. High resolution T1-weighted 3D anatomical images were first acquired with a sagittal magnetization-prepared rapid gradient echo (TR/TE = 2300/1.97 ms, flip angle = 9°, FOV = 256 × 256 mm2, matrix = 256 × 256, 176 slices, slice thickness = 1 mm) for subsequent co-registration and normalization. Each T1-weighted 3D scan lasted for 353 s.
Data preprocessing
High-spatial-resolution T1-weighted MR images were processed with standard voxel-based morphometry using the Computational Anatomy Toolbox (CAT12; http://dbm.neuro.unijena.de/cat12/) of statistical parametric mapping software (SPM12; http://www.fil.ion.ucl.ac.uk/spm/). First, all images were checked for the presence of artifacts and reoriented to adjust image origins at the anterior commissure. Second, T1-weighted images were normalized to Montreal Neurologic Institute space; segmented into GM, white matter, and cerebrospinal areas; and resampled to an isotropic image resolution of 2 × 2 × 2 mm3. After the image quality and sample homogeneity were checked, the segmented GM images were smoothed with an 8-mm full width at half maximum Gaussian kernel. Finally, the GM optimal threshold mask, created with images of all subjects, was applied to eliminate non-GM voxels (Ridgway et al., Reference Ridgway, Omar, Ourselin, Hill, Warren and Fox2009). The generated smoothed GM images were used as the GM volume for subsequent group comparisons.
Voxel-based morphometric analysis: overall atrophy patterns in PTSD
To estimate the overall GM volume alterations in patients with PTSD patients, the ANVOA test implemented in SPM12 was performed among the GM images of PTSD, TEC, and HC subject groups (voxel p < 0.001, cluster p < 0.05, GRF corrected). In addition, to explore the relationship between atrophy magnitude and PTSD symptoms, voxel-wise Spearman correlation analysis was performed (p < 0.05, Bonferroni corrected).
Mapping causal effect of GM atrophy pattern in PTSD using seed-based CaSCN
The analysis pipeline for the CaSCN was similar to that used in the original study by Zhang et al. (Reference Zhang, Liao, Xu, Wei, Zhou, Sun and Lu2017) and is only briefly described here. The GM volume data of all PTSD patients were sequenced according to the ranks of the PTSD symptoms from low to high. This data sequencing was analogous to time-series information for characterizing the progressive property of PTSD on the basis of cross-sectional data. Subsequently, similar to the GC analysis applied in functional MR imaging data analysis, the pseudo–time series was used to construct seed-based CaSCN. The seed region was selected from the previously mentioned voxel-based morphometric analysis. Signed-path coefficient GC analysis implemented with rsHRF (https://www.nitrc.org/projects/rshrf) was performed on a voxel-wise basis for all the voxels in the masked brain areas with reduced GM volume. The signed-path coefficient GC analysis has been used previously to investigate directed influences between two regions and has been used in patients with schizophrenia undergoing functional MR imaging (Chen et al., Reference Chen, Jiang, Chen, He, Dong, Hou and Luo2017; Palaniyappan, Simmonite, White, Liddle, & Liddle, Reference Palaniyappan, Simmonite, White, Liddle and Liddle2013). Similarly, the CaSCN could allow assessing the causal effect of GM volume alteration of a region on other regions. As the seed exhibited the reduction of GM volume in PTSD, a positive GC value indicated that the same GM volume alteration (reduced) in the regions lagged behind the seed atrophy, which may suggest the reduction is driven by the seed. A negative GC value denoted that regions with an opposite alteration (increased) lagged behind the seed atrophy, which may imply a compensatory effect. Sex, age, total intracranial volume, and the time interval between two pseudo-time points were regressed as covariates in conducting CaSCN analysis. To present statistical significance, the GC map was transformed to a z score map and the threshold was presented at a corrected minus log p than 2.3. This corresponded to a p value of 0.05, false discovery rate corrected (Zhang et al., Reference Zhang, Liao, Xu, Wei, Zhou, Sun and Lu2017). To further investigate the causal effect among the regions of interest (ROI) obtained from CaSCN analysis, we also calculated an ROI-to-ROI GC analysis, as originally proposed by Zhang et al. (Reference Zhang, Liao, Xu, Wei, Zhou, Sun and Lu2017). The signed-path coefficient GC analysis was performed to construct an ROI-wise causal network that characterized causal relationships among ROIs. To maintain consistency with the voxel-wise CaSCN analysis, the same threshold was set as a corrected minus log p than 2.3. The binary (weighted) ‘out-degree’ and ‘in-degree’ values (in-degree value = the number of head ends adjacent to a node, out-degree value = number of tail ends adjacent to a node) of each ROI were computed separately. The binary (weighted) in-degree value of an ROI represents the sum of the number (strength) of paths projecting to the ROI. The binary (weighted) out-degree value of a node refers to the sum of the number (strength) of paths projecting to other nodes. In addition, the out-in degree was also calculated as the subtraction between out-degree and in-degree values to identify the causal targets or causal source levels.
Results
Demographic and clinical variables
The demographic and clinical characteristics are demonstrated in Table 1. There are no significant differences in age (F = 0.317, p = 0.729) and the gender distribution (p = 0.912) among the PTSD, TEC, and HC groups. Significant differences were found in the education level among the three groups (F = 8.396, p < 0.001). Post hoc analyses revealed that the education level of the HC group was higher than that of the PTSD group (p < 0.001) and the TEC group (p = 0.001). No significant differences were found between the PTSD and TEC groups (p = 0.518). The mean CAPS total score of the PTSD group was 78.2 ± 19.3 and the PCL scores were higher in this group compared with the TEC group (p < 0.001). Ten PTSD patients had current psychiatric co-morbidities: nine with depression (two males and seven females) and one with an anxiety disorder (one female). No one in the control groups was diagnosed of depression. Significant differences were also found among the three groups in regard to the SAS (F = 81.864, p < 0.001) and SDS scores (F = 101.915, p < 0.001). Post hoc analyses revealed that the SAS (p = 0.025) and SDS (p = 0.003) scores in the TEC group were significantly higher than those in the HC group, but were significantly lower compared with those in the PTSD group (All p < 0.001).
Demographic and clinical data of traumatized individuals and healthy controls

PTSD, post-traumatic stress disorder; TEC, trauma-exposed control; HC, healthy control; SAS, Self-Rating Anxiety Scale; SDS, Self-Rating Depression Scale; PCL, PTSD Checklist; CAPS, Clinician-Administered PTSD Scale.
Values are given as mean ± s.d. except for gender, which is presented as a number.
a p value obtained with χ2 test.
b P value obtained with one-way analysis of variance.
c P value obtained with independent t test for continuous variables.
GM atrophy pattern
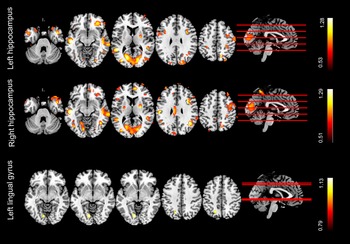
Compared with the HC subjects, the PTSD and TEC showed reduced GM volume in the bilateral hippocampus and left lingual gyrus (p < 0.05, Bonferroni corrected, Fig. 1). No significant difference was observed between the PTSD and the TEC group (p < 0.05, Bonferroni corrected). Correlation analysis demonstrated that PCL scores are associated with reduced GM volume (p < 0.05, Bonferroni corrected, Fig. 2).
VBM differences revealed by analysis of variance. (a) The bilateral hippocampus and left lingual gyrus show difference among the three groups (voxel p < 0.001, cluster p < 0.05, GRF corrected). (b) Post hoc analyses reveal that both the PTSD group and the TEC group show decreased VBM in the left (a) and right (b) hippocampus and left lingual gyrus(c) relative to the HC group (p < 0.05, Bonferroni corrected). No significant difference was found between PTSD and TEC group. VBM, voxel-based morphometry; PTSD, post-traumatic stress disorder; TEC, trauma-exposed control; HC, healthy control.

Results of correlation analyses between reduced VBM in left lingual gyrus, right hippocampus and PTSD symptom severity across all traumatized subjects. The PCL score is positively correlated decreased VBM in left lingual gyrus but is negatively correlated with reduced VBM in right hippocampus (p < 0.05, Bonferroni corrected). PTSD; post-traumatic stress disorder; PCL, PTSD checklist.

Mapping causal effects of GM atrophy pattern in patients with PTSD
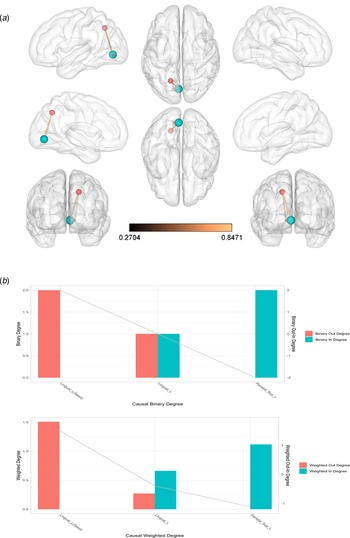
To explore the causal effect of GM volume atrophy in patients with PTSD, the CaSCN was constructed with the bilateral hippocampus and left lingual gyrus as the seed. They were selected from an ANOVA test of a whole-brain voxel-based morphometric comparison among all traumatized patients and HC subjects. CaSCN results exhibited positive GC from the seed in the hippocampus to the frontal lobe, precuneus, temporal-parietal junction, angular and temporal gyrus, occipital gyrus (Fig. 3 and online Supplementary Tables S1, S2). This suggests that the hippocampus may be the hub of the directional network in terms of out-degree values, and may exert positive causal effects to other regions, thus potentially leading a damaging effect to them. These regions were extracted for the ROI-to-ROI CaSCN analysis. No negative GC was detected from the seed to other regions. Meanwhile, no causal effects from other regions to the seed in the hippocampus were found. CaSCN results exhibited positive GC from the seed in the lingual gyrus to the superior parietal gyrus (Fig. 3 and online Supplementary Table S3). No negative GC was detected from the seed to other regions and no causal effects from other regions to the seed in the lingual gyrus were found.
Causal networks show causal effects of gray matter atrophy pattern in patients with PTSD. Causal networks were constructed by applying Granger causality (GC) analysis to sequenced morphometric data according to the ranks of CAPS scores from low to high. The left hippocampus, right hippocampus, and lingual gyrus were used as the seed regions on the basis of voxel-based morphometric analysis. Considering the reduction in the gray matter volume of bilateral hippocampus and left lingual gyrus in patients with PTSD, regions with positive GC values indicate the same gray matter volume alteration (reduction) lagged behind bilateral hippocampus and left lingual atrophy, which may suggest that it is driven by the bilateral hippocampus and left lingual atrophy. GC values were transformed to z values.

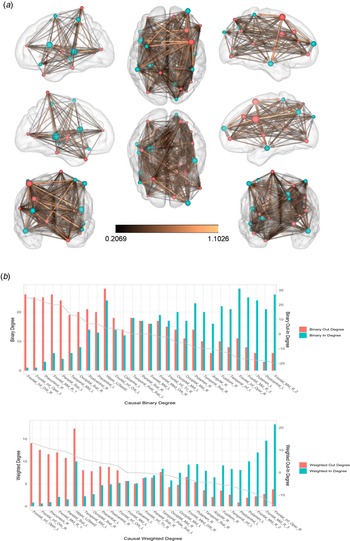
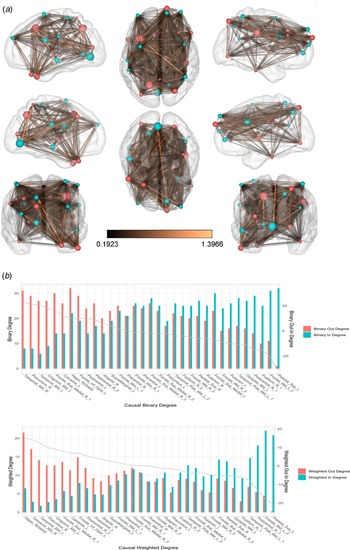
The ROI-to-ROI results demonstrated a directional network that revealed an interregional causal relationship (Figs. 4– 6). The nodes in hippocampus, orbital inferior frontal gyrus, precuneus, middle frontal gyrus, superior parietal gyrus, middle temporal gyrus, superior occipital gyrus and postcentral gyrus mainly projected causal effects to the frontal lobe, occipital lobe, temporal regions, and the parietal lobe (ie, out-degree hubs), and received causal effects from the hippocampus, which were identified to be transition points. The nodes in the frontal lobe, occipital lobe, temporal regions, and the parietal lobe received more causal effect from other nodes (i.e., in-degree hubs), which were identified as the causal targets.
Region-of-interest (ROI)-based causal structural covariance network analysis shows a causal relationship among ROIs. A, Bivariate signed-path coefficient Granger causality analysis was performed to construct an ROI-wise causal network to characterize causal relationships among ROIs. B, The binary (weighted) out- and in-degree value of each ROI was computed separately. In detail, the binary (weighted) in-degree value of a ROI represents the sum of the number (strength) of paths that project to itself. The binary (weighted) out-degree value of a node refers to the sum of the number (strength) of paths that project to other nodes. In addition, the out-in degree value was also calculated as the subtraction between out-degree and in-degree values to identify the causal targets or causal source levels.

Region-of-interest (ROI)-based causal structural covariance network analysis shows a causal relationship among ROIs. A, Bivariate signed-path coefficient Granger causality analysis was performed to construct an ROI-wise causal network to characterize causal relationships among ROIs. B, The binary (weighted) out- and in-degree value of each ROI was computed separately. In detail, the binary (weighted) in-degree value of a ROI represents the sum of the number (strength) of paths that project to itself. The binary (weighted) out-degree value of a node refers to the sum of the number (strength) of paths that project to other nodes. In addition, the out-in degree value was also calculated as the subtraction between out-degree and in-degree values to identify the causal targets or causal source levels.

Region-of-interest (ROI)–based causal structural covariance network analysis shows a causal relationship among ROIs. A, Bivariate signed-path coefficient Granger causality analysis was performed to construct an ROI-wise causal network to characterize causal relationships among ROIs. B, The binary (weighted) out- and in-degree value of each ROI was computed separately. In detail, the binary (weighted) in-degree value of a ROI represents the sum of the number (strength) of paths that project to itself. The binary (weighted) out-degree value of a node refers to the sum of the number (strength) of paths that project to other nodes. In addition, the out-in degree value was also calculated as the subtraction between out-degree and in-degree values to identify the causal targets or causal source levels. Parietal_Sup_L = left superior parietal gyrus, Lingual. L = left lingual gyrus.

Discussion
In this study, we assessed the causal relationship among brain regions with morphometric alterations in patients with PTSD using the CaSCN analysis on T1-weighted structural images. Symptoms of illness were correlated with GM volume reductions in the hippocampus and lingual gyrus. A directional network revealed that the hippocampus was its hub; changes in the hippocampus were potentially causally associated with all other nodes. These nodes include temporal and frontal cortices, subcortical structures, and occipital regions, implying detrimental effects in the extra-hippocampal structures corresponding to hippocampal atrophy in PTSD.
Importantly, as the hub of the directional network, the hippocampus exhibited positive causal effects on frontal areas, the temporal lobe, and occipital regions. The hippocampus is essential in the bidirectional flow of neuronal signals between distinct cortical areas and subcortical regions and has been extensively involved in declarative, episodic, contextual, spatial learning and memory, and regulation of the hypothalamic-pituitary-adrenocortical axis (Woon et al., Reference Woon, Sood and Hedges2010). These functions are abnormal in patients with PTSD. This was supported by our previous study which found that both traumatized groups exhibited decreased dorsal anterior cingulate cortex functional connectivity with the right hippocampus relative to the HC group (Chen et al., Reference Chen, Zhang, Ke, Qi, Xu, Zhong and Chen2019). More decreased dorsal anterior cingulate cortex functional connectivity with the right hippocampus was found in the PTSD group. Importantly, the abnormalities in hippocampus were associated with PTSD symptoms. The positive causal value might indicate that regional GM volume reduction of the hippocampus precedes that of other regions. The hippocampus connects to different cortical areas; GM reduction in the hippocampus may consecutively result in neuronal damage in other regions. Previous study has found that PTSD is associated with abnormalities in multiple frontal-limbic system structures (Lui, Zhou, Sweeney, & Gong, Reference Lui, Zhou, Sweeney and Gong2016). This highlighted the crucial role of the frontal-limbic in the pathology of PTSD and reported that a reduction of GM volume in the prefrontal lobe was associated with cognitive and emotional dysfunction (O'Doherty et al., Reference O'Doherty, Tickell, Ryder, Chan, Hermens, Bennett and Lagopoulos2017). In addition, diffusion tensor imaging reported a connectivity disequilibrium between the salience and default-mode networks (Lei et al., Reference Lei, Li, Li, Suo, Huang, Lui and Gong2015). Previous functional studies also found that the PTSD including typhoon-related PTSD was involved in multiple regions in the salience, central executive and default mode networks (Bruce et al., Reference Bruce, Buchholz, Brown, Yan, Durbin and Sheline2012; Ke et al., Reference Ke, Zhang, Qi, Xu, Zhong, Liu and Chen2018; Patel et al., Reference Patel, Spreng, Shin and Girard2012; Weng et al., Reference Weng, Qi, Chen, Ke, Xu, Zhong and Lu2018, Reference Weng, Qi, Zhang, Luo, Ke, Xu and Lu2019) as well as with the sensorimotor, auditory and visual networks (Chen et al., Reference Chen, Ke, Qi, Xu, Zhong, Liu and Lu2018; Shang et al., Reference Shang, Lui, Meng, Zhu, Qiu, Gong and Zhang2014). Overall, our study results revealed a potential causal relationship from the hippocampus and frontal lobe to further regions with GM atrophy. However, we could not neglect the fact that hippocampal atrophy was not found in all PTSD patients, perhaps due to varied traumatic events.
Unexpectedly, there is no significant difference in the hippocampal volumes between the PTSD and the trauma-exposed controls. This may suggest that no significant additional neuropathological process occurs beyond trauma exposure. The above results may imply that the bilateral hippocampal volume reductions in the PTSD patients with reference to the HCs, other than the trauma-exposed subjects without PTSD, were trauma-related. Previous study had indicated that hippocampal atrophy was both disease- and trauma-related (Woon et al., Reference Woon, Sood and Hedges2010), the inconsistency may be due to the trauma. There is a possibility that the trauma exposure itself was enough to result in hippocampal volume reductions, thus increasing the vulnerability of developing PTSD in the trauma-exposed subjects. On the other hand, the trauma-exposed duration was relatively short in our study. It might not be long enough to cause the difference between the two groups. Taken together, hippocampal volume deficits are associated with trauma exposure regardless of PTSD diagnosis. Attention should also be paid to those trauma exposure subjects without PTSD.
As a component of the visual association cortex, the lingual gyrus is engaged in visual association and the processing of visual images closely associated with the formation of autobiographical memory and is involved in verbal declarative memory (Yin et al., Reference Yin, Jin, Eyler, Jin, Hu, Duan and Li2012). Previous studies have reported decreased function in the visual cortex of PTSD subjects (Bremner et al., Reference Bremner, Narayan, Staib, Southwick, McGlashan and Charney1999, Reference Bremner, Vermetten, Vythilingam, Afzal, Schmahl, Elzinga and Charney2004). Particularly, two previous studies had found decreased gray matter volume in lingual gyrus (Nardo et al., Reference Nardo, Högberg, Lanius, Jacobsson, Jonsson, Hällström and Pagani2013; Tavanti et al., Reference Tavanti, Battaglini, Borgogni, Bossini, Calossi, Marino and De Stefano2012). Reduced volume in the lingual gyrus is in line with the hypofunction of autobiographical and declarative memory in patients with PTSD. Moreover, the correlation between PCL score and decreased VBM in left lingual gyrus indicated that the PTSD symptoms were associated with abnormalities in lingual gyrus. Our findings provide further evidence for deficits in the visual cortex of recent-onset PTSD patients.
Our study had several limitations. First, the relatively small sample size limited the validity of our findings. Larger cohort should be recruited in the future study. Second, this was a cross-sectional study and longitudinal studies must be performed to further clarify whether VBM reductions were definitively related to the PTSD rather than to previous risk factors for the disorder. Third, typhoon-related PTSD patients were included in this study, the findings might not be generalized to PTSD caused by other etiology. Fourth, the subject may differ in levels of exposure to the typhoon and past trauma histories which may influence the result of the study. They should be considered in future study. Fifth, the validation of CaSCN analysis results should be verified through replication samples. Last but not least, the significant educational level differences among the three groups might confound the results though we used the educational level as a covariate to minimize the influences.
The CaSCN analysis results indicate that the hippocampus is the hub of the directional network; the hippocampal atrophy in PTSD may exert a damaging effect on the frontal, the occipital lobe, and the temporal regions. GM volume reductions in the hippocampus and lingual gyrus is associated with PTSD symptoms. These results suggest a hierarchy of structural brain damage and a crucial role of the hippocampus in disease. Our work provides further evidence to indicate that PTSD is correlated with reduced GM abnormalities.
Supplementary material
The supplementary material for this article can be found at https://doi.org/10.1017/S0033291720003281.
Acknowledgements
The authors would like to thank all participants for their time and effort. This work was supported by the National Nature Science Foundation of China [grant number 81971602; 81760308; 81801684; 81871344; 81701669]; the Chinese KeyGrant [grant number BWS11J063,10z026]. This work was also supported by Hainan Provincial Natural Science Foundation of China [grant number 818MS124], the Program of Hainan Association for Science and Technology Plans to Youth R & D Innovation [grant number QCXM201919] and the Nature Science Foundation of Jiangsu Province [grant number BK20170368].
Conflict of interest
The authors declare that there is no conflict of interest.