For much of the last generation, economists have been saying that the adoption of the tractor was “too slow.” We contend that this perception is in part the result of an incorrect application of Paul David's 1966 threshold model. That model plausibly assumes that producers will switch to the most efficient (least cost) technology for accomplishing a task or set of tasks. Previous studies have focused on only one part of farming—raising crops. In this article we develop a model that incorporates the opportunity cost of the farmer's time and we apply the model to farmers in Iowa in the interwar period, a time when tractors came to resemble the machines we now recognize by that name. That is, we model the tractor adoption decision not as a horses or tractor decision, but rather as a horse farming versus horse and tractor farming decision. We show that an important reason why farmers switched to tractors was because they provided farmers with more time for noncrop activities, such as raising livestock, improving the farm infrastructure, or working off the farm. In fact it is more accurate to say that the tractor, by freeing up a farm owner's time to raise livestock or work off the farm, increased the opportunity cost of growing crops. With these results, explanations such as market imperfections and “lumpiness” of the inputs are not needed. The imperfect capital market explanation seems particularly suspect: farmers in fact bought cars, a purchase of comparable expense to tractors. In 1920, 74 percent of Iowa farms reported automobiles, even though only 13 percent reported tractors. In 1930, 85 percent of Iowa farms had cars, but only 27 percent had tractors.1
McKibben and Griffin, “Changes,” table E-5, p. 106.
Among the first economists to apply the threshold model to tractors was Robert Ankli.2
Ankli, “Horses.”
Clarke, “New Deal Regulation.”
William White argues that Clarke's threshold acreage is actually too high.4
White, “Unsung Hero.”
Lew, “Diffusion.”
Alan Olmstead and Paul Rhode develop a simultaneous equation model and apply it to state-level data to test the impact of the tractor on cropland acres per farm.6
Olmstead and Rhode, “Reshaping the Landscape.”
In his classic 1960 article on tractor adoption, Zvi Griliches, using national data, found investment in tractors to be dependent on the price of crops.7
Griliches, “Demand.
Griliches, “Hybrid Corn,” pp. 501–22.
We believe the shortcoming common to this previous research is that it investigates only the cost of growing crops. Although researchers have often mentioned that tractors saved time, this aspect of production has not been specifically incorporated into the models. The tractors did not necessarily result in the farmers having a larger corn crop; output was constrained by the land and the farm technology at the time. But farmers also generated income by raising livestock, improving the farm, and working off the farm. By saving time using a tractor, farmers could generate additional income through these other activities, or simply consume greater leisure.
Although we and others construct average costs and average technical coefficients of production, these are not necessarily any one farm's marginal costs or benefits. The marginal benefits of using some technology varied from farm to farm depending on the other inputs the owners had available, especially the farmer's human capital related to the use of horses. A 1935 farm study found that younger farmers were more likely to adopt tractors than their older colleagues.9
Hopkins, “Changing Technology,” p. 63.
We restrict our analysis to Iowa farms in the interwar period. National-level data obscure many important influences and variations in the diffusion of tractors. The diffusion of the tractor was not uniform across the United States. As the tractor developed, various farming systems found them useful, albeit in different decades. Very roughly, the small grain region and Far West were the earliest adopters. This farming system has an annual cycle of plow, plant, and reap. Although the planting was usually done with horses, plowing and reaping could be done with tractors. The huge power needs of these tasks made the tractor a valuable addition to the farm and reduced the number of horses needed. The more complicated farming system of the Corn Belt has a cycle of plow, plant, cultivate, and hand harvest for crops. Because of smaller acreages and cultivation between the rows of corn, tractors did not displace many horses until the introduction of the Farmall tractor in 1924.10
The Farmall was the first tractor with the modern set-up of two small front wheels close together and large rear wheels on a high axle. This permitted tractors to cultivate crops (turn over the soil, weed) until the crops reached the height of the rear axle.
THE MODEL
In order to investigate the incentives that farmers faced affecting the rate of substitution of tractors for horses, we need a tractable (no pun intended) model of farms that captures the changing costs and technology that led to this substitution. We analyze those incentives using a multi-year linear programming (LP) model. To capture the dynamic aspects of farming technology, we repeat LP models over the years 1922, 1930, 1936, and 1940. Each LP model generates a Lagrange multiplier (“shadow price”) for tractors and horses and a value of the objective function for each period. In this manner we can see how these net incomes and shadow prices change over time. We show that these values are consistent with the slow adoption of tractors in this period.
We posit that farmers maximize their net income by choosing the proper levels of corn, oats, and hay (x1, x2, x3) with a fixed coefficient technology, using priced and unpriced inputs and fixed resources, subject to resource constraints. The technical coefficients, the aijs, are the amounts of input i necessary to produce one unit of output j. We define one unit of corn or oats to be 100 bushels; one unit of hay is one ton. We use the subscripts i (1,2,3,4) for the inputs land, man-hours, horse-hours, and tractor-hours, respectively, and j (1,2,3) for the outputs corn, oats, and hay, respectively. The farmer's net income is the income he receives from sale of the crops less the cost of the inputs used. Here, the priced inputs are horses and tractors only.
In our model we do not include labor as a priced input. It seems most likely that the farmers on 160 acre farms used family labor almost exclusively. Shaw reports that there were approximately three unpaid family workers for every hired worker in 1930.11
Shaw et al., “Trends,” table H-2, p. 154.
U.S. Bureau of the Census, “Fifteenth Census,” vol. 3, table 20, p. 789.

Denoting the unit prices of horse and tractor hours as w3 and w4 respectively, the cost of each input is the sum of the amounts of that input used in each crop times its respective input price. The net income the farmer receives is thus

The resource constraints simply state that the amount of each input used cannot exceed the total amounts of those inputs that are available, represented by the right-hand side coefficients:

This simple model, however, ignores important constraints the Iowa farmers faced. When this model is solved with actual data, it says that farmers would plant only corn on every available acre. In fact, farmers planted corn, oats, and hay in fairly persistent proportions year after year. This seemingly non-wealth-maximizing behavior has two explanations: land fertility considerations and the episodic nature of the labor requirements of corn.13
Hopkins, “Crop System,” p. 287, table vii. Thomas and Hopkins, “Seven Iowa Counties,” figure 3.
Crop Rotation
Crop rotation was a way for farmers to keep their yields of corn high. Data from records kept by the Iowa Agricultural Experiment Station on fields that had been kept in corn for three or four years indicated that corn yields dropped by 12.3 percent in the second year, by 15.2 percent in the third year, and 32.7 percent in the fourth year.14
Hopkins, “Crop System,” table 7, p. 287.
Chen and Arny, “Crop Rotation Studies,” p. 4.
With chemical fertilizers not generally available in this time period, farmers dealt with this loss of yield by rotating oats and hay with the corn. The typical rotation was to divide the farm into four sections, and grow corn in sections 1 and 2, oats in 3, and hay in 4. The next year the farmer would grow the same crops but start with section 2, and so on. Thus, although the crop rotation process is a chronologically sequential one for a particular farm, the proportions of land on the farm in various crops remained the same. Although a more complete, multiyear model would generate this crop rotation as part of the solution, we simplify the model by requiring the farm to have the same acres in oats and hay as did the average farm for that year. Because the solution will always fill all available land with corn production, constraining the number of oat and hay acres is all that is needed.
The Crop Rotation Constraints are thus:

Seasonality
Although the farmer had approximately 3,120 work hours per person available to him (10 hours per day × 6 days per week × 52 weeks), bad weather, the uneven distribution of labor requirements throughout the year, and the physical limit to a work day of 10–12 hours meant that at no time did the farmer have all of his annual labor available to him. Labor hours become very constraining at the times of the year during spring planting and fall harvesting. Of these two, the spring planting time was the most demanding because there was a narrow window of opportunity to get the crops planted. According to H. L. Thomas and John A. Hopkins, doing the needed work at just the right time seems to be one of the most important influences in obtaining a satisfactory yield at the least cost.16
Thomas and Hopkins, “Seven Iowa Counties,” pp. 23–24.
Richey, “What and How of Hybrid Corn,” p. 17
Pond, “Study,” p. 44.
In the fall the crop must be harvested as soon as it is ripe so that an early winter does not prevent the crop from being harvested. Once there is snow on the ground the horses and machines cannot get into the fields to harvest.
We capture the intertemporal nonsubstitutability of labor by dividing the year into three important windows of time and matching the labor available to the power needs for each set of tasks. Because the amount of labor used for plowing cannot be substituted for the harvesting of grain and there are definite dates between which specific tasks must be performed, for each crop we calculate three season-specific technical coefficients for each labor constraint, each horse hour constraint, and each tractor constraint. Only one technical coefficient per crop is needed for the land because land is allocated only once a year.
The seasons are: Winter: This is the month of April when the oats can be planted. The oats germinate in colder wetter soil than corn so they can be planted even when there is still a threat of frost. Spring: This is the corn seedbed preparation and planting period. This period is bounded by the last day of frost and June 1. As mentioned, the farmers planned about 21 workdays to accomplish the preparation and planting on the number of acres designated for corn. Summer & Fall: This is the period from June 1 through the end of harvest. The tasks done are cultivating the corn in June and July, harvesting the oats in July and harvesting the corn from late September on.
We add a third subscript k(1,2,3) to indicate the season. For example, a223 is the technical coefficient for the man-hours used for oats in the Summer & Fall. Note that

, i = 1,2,3,4, and j = 1,2,3.
The Opportunity Cost of Labor
As we have stressed, the major benefit of using tractors was that the labor input dropped dramatically. If the farmer spent less time raising crops he would have more time for noncrop activities such as raising livestock, improving the farm infrastructure, or working off the farm. There is an implicit cost of the farmer's labor that must be considered. We have modeled this opportunity cost of the farmer's time by modifying the objective function.
Let

be the endowment of all the hours the farmer has available to him, and let w2 represent the opportunity cost of this labor. Recall that a21, a22 and a23 represent the labor hours summed over all seasons for raising a unit of each crop. Then the amount of time the farmer has to work in activities other than crops is

Multiplying this quantity by the alternative wage represents foregone earnings in livestock, infrastructure improvements, or off-farm employment.
The final model in its entirety is thus:

subject to resource, seasonality, crop rotation, and non-negativity constraints:

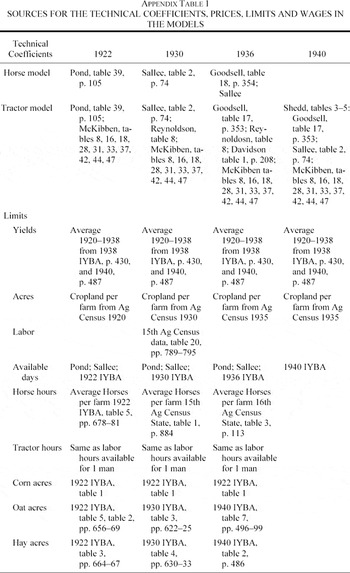
All parameters were derived from reports in the literature of the time. The technological coefficients were derived at the task level, as indicated in the Appendix. The principal sources were the Agricultural Experiment Station (AES) Reports of Iowa, Minnesota, and Illinois, Iowa Year Book of Agriculture (IYBA) for each year, and the various publications (Farmer's Bulletins, Department Bulletins, Miscellaneous Publications and Technical Bulletins) of the United States Department of Agriculture (USDA). Specific citations are available from the authors upon request.
Structural Stability, 1920–1940
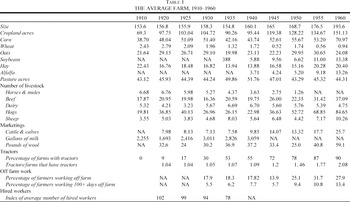
We assume throughout that yields (bushels per acre), farm size, price, and wages were constant. By 1940, 55 percent of the farms had tractors, but the manner or scale of farming had not changed, as the data in Table 1 clearly show. Farm size varied by only 3.3 acres over the period, corn acres fluctuated between 104.72 in 1930 to 90.28 in 1935 but over the period remained virtually flat. The same agronomic techniques prevailed—the crop rotation system and the numbers of times operations were performed remained unchanged, and the yields per acre all remained constant.
Although the period of study is 1920 to 1940, Table 1 covers 1910–1960 so that the period of study can be seen within the longer-term trends. Comparing across the columns one can see that the farm size changed little over the first four decades of the twentieth century. After 1940 the size begins to climb and by the 1960s the average farm size was almost 200 acres. The proportion of acres in corn oats and hay vary slightly, but with no discernible trend between 1920 and 1940; the proportion allocated to corn begins to rise through the 1950s. Although the number of horses declined by almost 50 percent over the period, the proportion of oats, usually considered to have been grown for horse feed, surprisingly did not change, and pasture acres increased 13 percent. The data on livestock are ambiguous: The number of beef remains flat but the dairy cows rise during the period. Of note, however, is the increase in the number of cattle marketed and the number of gallons of milk sold. The increase in marketing quantities suggests the farmers were spending more time and assets in livestock operations. Hogs decline during the period of study but not over the longer haul. This hog decline was due in part from the policies of the New Deal but swine cholera was also a major problem of the day. Finally, the number of sheep on farms fluctuates but the amount of wool produced rises.
A very interesting and important indicator for the purposes of this study is the rising trend of farmers working more than 100 days off their farms and the steady decline in the index of average number of hired workers. The most important effect of tractor technology was to reduce the labor input required for field crops. The upward trend of work off-farm illustrates one of the ways that farmers used the hours released from farming to increase their total annual income.
Isolating the Effects of Technical Change
Tractors improved throughout the interwar period. The Fordson tractor in 1918 could plow but not cultivate, and it had a tendency to flip backwards onto the operator when it hit obstructions or very soft ground. The Farmall in 1924 was the first tractor that could cultivate young corn plants. Over the next 15 years, manufacturers developed better metal alloys and tractor designs. Other developments included an expanding array of specialized implements culminating with Harry Ferguson's three point hitch in 1939, hydraulics for lifting implements, and rubber tires. Only with the advent of the Ford Ferguson 9N circa 1940 were all of the basic elements of modern tractors introduced.
Exogenous effects such as variations in weather can obscure these technological changes. For example, if yields are low because of weather, the aijks for the inputs will be higher, obscuring the advances in tractor design that would lower the aijks. Removing these exogenous effects is critical to drawing accurate conclusions from the results. We therefore apply the model to each observation period as if the same farmer worked the same farm using the same farming method with horses or with horses and a tractor at each observation point. In this case, because we are interested in the effects of technological change, we hold the yields, farm size, prices, and alternative wages constant.19
There is a slight upward trend in corn and hay yields due to the introduction of hybrid corn and alfalfa hay in the last years of the period. Oat production remained flat.
In addition to weather, there are three other important exogenous effects at work that can affect the implicit prices of tractors and horses from one year to the next: the evolution of agriculture towards greater efficiency in the use of the inputs (learning effects), severe macroeconomic shocks to the economy, and scale effects. Throughout the two decades of our study, the Iowa Agricultural Experiment Station (and others like it) conducted studies and promoted greater efficiency in farming, in terms of, for example, the number of times various tasks had to be done. This secular growth in knowledge is largely a separate issue from the choice of tractors vs. horses, and so in this study we use the same set of tasks for each period.
During this period, there were some important macroeconomic shocks, one of which was the drop in real agricultural wages in the 1930s.20
See U.S. Bureau of the Census, Historical Statistics, especially Series E 113–139, pp. 125–26, Consumer Price Indexes (BLS) by Major Groups and Subgroups: 1890 to 1957, Series K 73–82, p. 280; Farm Employment, Wages, and Man-Hours Used for Farmwork: 1866–1957; Series D 626–634, p. 92, Hours and Earnings for Production Workers in Manufacturing: 1900 to 1957. It is clear that nominal farm and manufacturing wages fell, but real farm wages fell absolutely, whereas real manufacturing wages remained steady from 1929 through 1933 and then rose slightly for the rest of the 1930s.
Lastly, we ignore the minor effects of economies of scale in this period in our model. In fact farm size changed very little over the period as Table 1 shows. The crop acres average 100.13 and so 100 acres has been used in all the models as the land limit. We use the actual average acres of oats and hay in each period.
THE EMPIRICAL MODELS
Linear programming models generate positive shadow values only for those constraints that are binding.21
The number of binding constraints cannot exceed the number of decision variables, in this case, three. (See, for example, Silberberg and Suen, Structure, especially section 17.2 & ff.) If a constraint is binding, it is easy to calculate the increase in the objective function value (net income) that would occur if, say, one more acre of land were available. This increase in income represents the value of the marginal product (VMP) of land, and thus the implied competitive price of this resource. If a constraint is not binding, meaning there is an excess of the resource over what the solution requires, then the VMP, or shadow price of that resource is zero, even though its average value is obviously not zero. These “shadow prices” or “Lagrange multipliers” are generated as part of the solution.
When the models are run, the tractor and horse-hours constraints turn out to be nonbinding, producing zero shadow prices. The number of hours theoretically available for tractor and horse-hours does not adequately reflect the peak time constraints the farmers faced. We therefore parametrically reduce the Spring right-hand side time limits for horse and tractor-hours until these constraints became just binding. That is, after the model determines how many Spring horse or tractor hours the solution requires, we reset the horse or tractor constraint to that level. This procedure allows the model to generate positive shadow values for these resources without changing the solution, so that a comparison of the marginal productivities of these two power sources becomes possible.
It is a fair criticism of the model that—because there can be only three binding constraints, one of which is obviously the land constraint, and the two others turn out to be the crop rotation constraints for oats and hay (until we parametrically lower the Spring power source constraint until it becomes just binding, replacing the crop rotation constraint for hay)—the solution is in a real sense pre-ordained to have the farmer plant approximately half of his acreage in corn, and approximately 25 percent in oats and the remainder in hay. These elementary predictions of the model in fact accord with reality—this is what these farmers actually planted, with only very small deviations, every year (see Table 1). Though the model is framed to derive the optimal crop mix, this is not its real purpose—Iowa farmers in the interwar period had very little choice about this due to the necessity for crop rotation. Rather, our purpose is to derive the shadow prices of the two alternative power sources, to see how changing technology affected their relative prices and farm income, and to investigate the role of the opportunity cost of labor. Moreover, once the model determines which three constraints are binding, we can analyze the technical coefficients of those constraints to gain a better understanding of exactly what is driving the results.
We run several comparative statics experiments using various hourly real wages the farmer might have had in 1910–1914 dollars to examine the incentive farmers had to switch to tractors: zero alternative wage, an average farm wage, and the average manufacturing wage (w = 0, $0.27, $0.55 per hour, respectively). We assume the annual time available to farmers is

= 3,120 hours (10 hours per day × 6 days per week × 52 weeks). However, the seasonal constraints are narrow windows of opportunity, and we use the reduced number of hours available for each season in those constraints. We use a wage of $0 to model the polar case where the farmer had no alternative use for his time. This is the assumption most previous authors have implicitly or explicitly used.
22This would imply that farmers valued their leisure at zero; we do not intend to imply that this is a true reflection of their time value. We simply use this to illustrate the effects of ignoring the farmer's value of time saved.
The real horse-hour cost varied from $0.09 to $0.10 for all the observation periods, while the real tractor cost varied from $0.54 in 1922, to $0.37 in 1930, and $0.41 in 1936.23
Tolley and Reynoldson, “Cost”; Reynoldson et al., “Utilization”; and Goodsell, “Cost.”
U.S. Department of Agriculture, Major Statistical Series, p. 17. These hourly costs are calculated as follows: First the initial cost of the horse or tractor depreciated over its life, then costs for feed, bedding, veterinary fees and a 5 percent interest on the capital investment area added in the case of the horse. For the tractor fuel, oil, grease, repairs, and a 5 percent interest on the capital investment are added to the depreciation for each year. These total are then divided by the number of hours each are used annually. The result is the hourly cost for using the power source. In previous studies, the authors calculated the costs in the same manner.
In order to isolate the effects of technological change, we hold the costs constant in all the models that follow. We use costs of $0.09/horse hour and $0.50 per tractor hour. Because the tractor hour cost declined, the shadow values for tractors are understated, but, again, holding the costs constant has the advantage of isolating the effects of technological change.
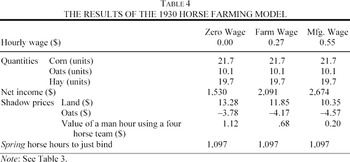
The following pages contain the actual models we ran, with land, yields, farms size prices, and wages held constant. The objective functions and constraints are presented with their numerical coefficients, followed by the LP results. For each time period we run a horse farming model and a tractor-farming model. In the horse farming models we assume that horse teams powered all the tasks throughout the year. In the tractor-farming models, the distribution of tasks varies with the capabilities of the tractors over time. For example, in 1922 tractors only did the seedbed preparation tasks, but by 1940 they were used for all the tasks.
In all the models that follow, the technical coefficients over time decrease for both types of farming. For example, in 1922 it took 51.44 man hours to grow and harvest 100 bushels of corn with horses; in 1930 it took 35.41. With tractors it took 48.06 man-hours in 1922 and 28.78 in 1930. As a result, the number of men and horses required to grow the corn and other crops steadily decreases throughout the period of this study, and indeed, throughout the rest of the century.
The technical coefficients were all derived independently of each other and independently of the resource constraints. Each crop was divided into the tasks that needed to be done to grow and harvest each crop. Then the Agricultural Experiment Station and USDA reports for the length of time each of these tasks took per acre were used to separate the tasks into their appropriate season and to derive the total hours necessary in man, horse, and tractor hours to produce each crop. The resource limits were taken from census data on the resources available. The crop acreages turn out to be the limiting resources. Men, horse, and tractor hours available are in each case greater than the resources necessary to produce the optimum quantities. The Appendix contains citations for these sources.
1922 Horse Farming Model

subject to resource, seasonality, crop rotation, and non-negativity constraints:

where pi = (59,31,10), xi = (x1, x2, x3), w2 = $0, $0.27, $0.55, w3 = $0.09
1922 Tractor Farming Model

subject to resource, seasonality, crop rotation, and non-negativity constraints:

where pi = (59,31,10), xi = (x1, x2, x3), w2 = $0, $0.27, $0.55, w3 = $0.09, and w4 = $0.45
1930 Horse Farming Model

subject to resource, seasonality, crop rotation, and non-negativity constraints:

where pi = (59,31,10), xi = (x1, x2, x3), w2 = $0, $0.27, $0.55, and w3 = $0.09
1930 Tractor Farming Model

subject to resource, seasonality, crop rotation, and non-negativity constraints:

where pi = (59,31,10), xi = (x1, x2, x3), w2 = $0, $0.27, $0.55, w3 = $0.09, and w4 = $0.45
1936 Horse Farming Model

subject to resource, seasonality, crop rotation, and non-negativity constraints:

where pi = (59,31,10), xi = (x1, x2, x3), w2 = $0 $0.27, $0.55, and w3 = $0.09
1936 Tractor Farming Model

subject to resource, seasonality, crop rotation, and non-negativity constraints:

where pi = (59,31,10), xi = (x1, x2, x3), w2 = $0, $0.27, $0.55, w3 = $0.09, and w4 = $0.45
1940 Tractor Farming Model

subject to resource, seasonality, crop rotation and non-negativity constraints:

where pi = (59,31,10), xi = (x1, x2, x3), w2 = $0, $0.27, $0.55, w3 = $0.09, and w4 = $0.45


RESULTS
It is important to understand that it is improving technology that drives the results that follow. In all the models, it turns out that the three constraints that determine the solution are the land constraint and the oats and hay crop rotation constraints. When we reduce the spring power constraint so that it becomes just binding, that constraint replaces the crop rotation constraint for hay. Since the oats crop rotation constraint alone determines the output of oats (which changes little over this period), and the land resource constraint is unchanged in all the models, it is, first, the reduction over time of the technical coefficient for the spring power constraint (a312 for horse farms and a412 for tractor farms), and second, the decrease in the technical coefficients for the over-all man-hours constraint, that produces the changes in shadow values and net incomes that are of interest. For horse farms, the amount of horse-hours needed for planting the acreage to produce 100 bushels of corn falls from 61.67 in 1922, to 50.63 in 1930 and to 44.73 in 1936. For tractor farms, the number of tractor hours needed to plant acreage for 100 bushels of corn falls from 8.63 in 1922 to 6.35 in 1930, to 5.51 in 1936 and to 4.93 in 1940. This is a reduction of 27.5 percent for horse farms and a 37.2 percent reduction for tractor farms between 1922 and 1936, and a 43.9 percent decrease for tractor farms by 1940. Thus there was technological progress for both horse and tractor farms, but the pace of progress was faster for the farms that used tractors. Similarly, on farms using just horses, it took 51.44 man-hours to produce 100 bushels of corn in 1922, and 31.10 man-hours in 1936. By contrast, using tractors, it took 48.06 man-hours to produce 100 bushels of corn in 1922; in 1940, it took only 12.51 hours, an almost four-fold reduction. These reductions came in part from the continuing evolution in tractor design and in the metallurgical advances applied to implements for both methods of farming. For example, the speed of horse farming improved when more efficient implement designs were made with harder and stronger materials. In tractor farming, as the power and versatility improved, more ground could be covered in shorter times.
We now present and analyze the results of these models.
Zero Alternative Wage Value
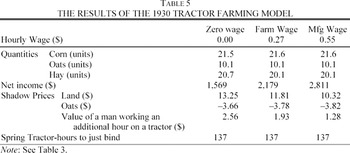
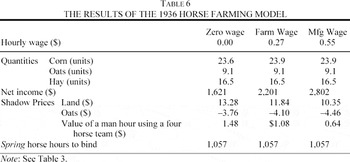
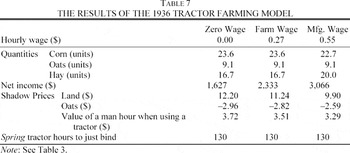
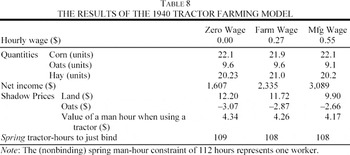
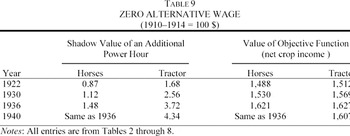
The Zero Alternative Wage experiment produces the shadow values and maximum net income values shown in Table 9. In this table and the ones following, “Horses” refers to a four-horse team, the most common team size in this period.

In every observation year the amount of revenue one man can generate by driving an additional tractor hour is absolutely higher than the value he can produce when driving a horse team for an hour. Additionally, the spread between these shadow values widens over time. The 1922 shadow value of tractor-hours is 93 percent higher than the shadow value of a horse team hour; in 1930 it is 129 percent higher; in 1936 it is 151 percent higher and in 1940 it is 193 percent higher. These are the results that have led previous authors to conclude that if farmers were wealth-maximizers they should have begun adopting tractors in great numbers in the 1920s unless some market imperfection caused delays.
However if farmers made their decisions to substitute technologies based on the total crop income alone, as previous authors implicitly assume, the very small variations in net income found in Table 9 clearly suggest that from the perspective of his annual income, a farmer in fact had little incentive to change. Technological improvements in implements for horse farming allowed farmers to reduce the number of horses used. As late as 1936, the crop income from horse farming was comparable to tractor farming, indicating little incentive to change technologies. As long as a farmer worked with his horses until all the crop acres were planted, he could produce the same level of corn, oats, and hay on the same number of acres, i.e., the same gross crop income, with horses as he could with tractors. There was little incentive to make the outlays for a tractor and take on the uncertainties of a new technology because the hourly cost of the two technologies was quite close.
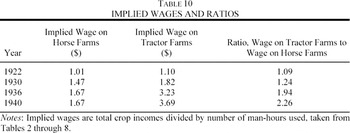
Dividing the total crop income by the number of man-hours used produces the implied average time values of farming crops in these years shown in Table 10.25
We are indebted to an anonymous referee for suggesting these calculations.

Note that the internal wage rate for raising crops increases over time for both horse and tractor farms, but that the ratio of tractor to horse farm wages increases substantially over time. The reason for the increase in this ratio is mainly the substantially greater reduction in hours required to produce all the crops the land could bear when the farmer used tractors versus horses. We can presume the farmer valued these hours saved, either for leisure or for the ability to earn additional income in some other activity. Thus the time saved is an important component of the reason for the switch to tractors. The size of these internal wages are in fact substantially greater than what we find (55 cents) in the manufacturing sector. This would provide an incentive to expand the farm acreage and raise additional livestock. It also should have resulted in increased rents on the specific factor, land, in this period. However we see little of these effects in the interwar period: farm size and livestock levels remained stable, and work off the farm increased only slightly between 1930 and 1940. (Off-farm work may have increased from 1922, but we are not aware of any data for this.) Livestock levels may have remained constant in this period because even with tractors, corn output, used mostly for feed, did not increase.
It is not clear, however, that the farmer had available to him time that had this value at the margin. Without changing the size of the farm, at the margin, the farmer's alternative wage was the greater of the value of his leisure or what he could earn with various chores, i.e., improving the existing capital on the farm, producing livestock, or working off the farm. As we have noted, the technological improvements that occurred in the interwar period did not result in higher crop levels—it just took farmers less time to produce the crops. With the same output of corn (mostly used for feed), there was little added incentive to raise additional livestock. It was only after World War II that these effects become evident in the data, and this is when further innovations, particularly the use of fertilizer, hybrid corn, and soybeans (which were nitrogen fixing and thus reduced the need for crop rotation) do farm sizes and livestock levels increase. Thus, the relevant wage to evaluate the farmer's time should be the farm and manufacturing wages we consider.
We now demonstrate how allowing for a positive alternative wage for farmers resolves some of the mystery regarding the slow pace of tractor adoption.
Average Iowa Farm Wage
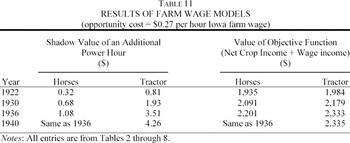
The effect on the shadow values of tractor and horse-hours when there is an alternative use for the farmer's time is shown in Table 11, which utilizes a farm wage of $0.27 per hour for the opportunity cost of the farmer's time.26
U.S. Department of Agriculture, Major Statistical Series, p. 17, table 28, page 80.

Again we see the same pattern. As with the zero alternative wage experiment, we see that the absolute shadow values are higher for a tractor hour than a horse team hour but the relative value between the two widens over time at a faster rate: $0.75/$0.32 = 2.34 in 1922, rising to $4.26/$1.08 = 3.94 in 1940.
More interesting is the relationship of the maximum net income levels. The objective function is the sum of the net value of the field crops and the wages a farmer could earn with the hours of his endowment beyond those needed for the crops. At $0.27 per hour there is a $49 difference between the maximum net income for horse farming or tractor farming in 1922 but in 1936 there is a $132 difference.27
We also ran the model with the actual reported costs of tractor and horse-hours stated above; that model produced an increase in net income of $109.
Williams. Fordson, p. 55.
Hopkins, “Changing Technology,” p. 37.
Note especially how a positive alternative wage causes a larger effect on net income. Rodolfo Manuelli and Ananth Seshadri concluded that the rising manufacturing wage led farmers to adopt tractors because that rise made farm labor more expensive.30
Manuelli and Seshadri. “Frictionless Technology Diffusion,” pp. 24 and 27.
A somewhat surprising result in this experiment is that the absolute values of horse and tractor hours decline when a positive wage is used and wages rise. This happens because the endowment of man-hours is fixed at 3,120 hours. The farmer can either raise crops or do some other work. Every hour he works on crops is one fewer hour he can work elsewhere. The farmer will earn the income from the crops grown, but will lose the income he would have earned but for the extra hour he put into crops. Thus, as the alternative wage rises, the net marginal value of additional inputs into farming declines.
A second unexpected result is the large increase in the shadow values for horses. Throughout the observation period, horse implements got bigger and stronger, partly from some spillover from the work being done on tractors and their implements, and partly the from continuation of the remarkable horse farming innovations, such as the reaper, that had already brought agriculture to a higher level of productivity. This provides an additional reason why the switch to tractors took place slowly over two decades.
The Average U.S. Manufacturing Wage
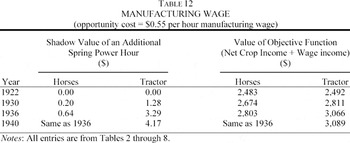
The next experiment uses the average U.S. manufacturing wage of $0.55 during the period.31
U.S. Department of Agriculture, Major Statistical Series.

Again the absolute value of the additional tractor hour is always greater than the additional team hour and the spread widens over time.
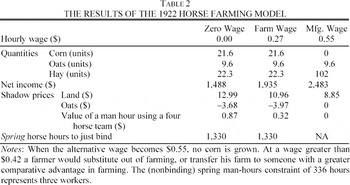
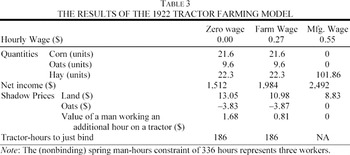
Once more, the marginal tractor hour generates more revenue than the marginal horse-team hour does, but now, the differences in the net income a farmer can generate by using tractors rather than horses becomes significant. In 1922 horse and tractor farming lead to approximately the same income, but by 1936 the farmer's net income is $263 greater if he utilizes tractors as opposed to horses. In 1922 the shadow value for horses and tractors drops so low with this high alternative wage that the optimum quantity of corn is zero. (The model implies that all the land should be put into hay if the alternative wage is above $0.42 or, alternatively, the farmer should leave farming and work in the industrial sector.) Even tractor farming in 1922 did not return as much as the average manufacturing wage of this time. In 1930 any wage over $0.49 would be better than growing corn or oats but by then tractor farming had become efficient enough so that at the $0.55 wage the optimum quantities again include corn and oats.
These results also indicate that, in the extreme case, a high manufacturing wage could encourage farmers to leave the farm, not buy a tractor! If the alternative wage is high enough, then the best solution for the farmer will be to exclusively work off the farm and sell or transfer the farm operation to someone whose comparative advantage in farming was greater.
The similarity of the horse and tractor revenue in 1922 and the widening gap between the two over time makes it easy to see that farmers were not slow to adopt tractors; they adopted them as the spread between the maximum revenue from tractor farming and horse farming grew larger and larger. This pattern is consistent with the pattern in the data: few farmers adopted tractors before 1930, but twice as many adopted them by 1940, and twice again as many adopted them by 1950. So the notion of farmers being slow to change is in reality not true. They only changed when the incentives were positive, not because markets did not function effectively, or because exogenous monetary shocks prevented them from doing so as previous authors have argued.
This last experiment using the manufacturing wage serves to illustrate the motivations for the huge structural changes that have rumbled through American agriculture to the present time: farm size grew, the number of livestock increased and the rural population dropped precipitously. This change was a combination of farmers taking jobs off the farms, or increasing their acreage, or spending more time with livestock. Although only 18.3 percent of farmers reported work off the farm for pay in 1930 (the first year of the record), by 1950, 30 percent did so. The number of farms began falling during the 1940s, and by 1960 there were only 174,707 farms on the same land area that had held 221,986 in 1935.
Hybrid Corn Experiment
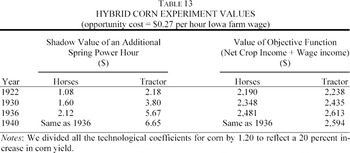
To further test the sensitivity of the model, we ran one last experiment using recalculated aijks to see how biotechnological change affected the shadow values of horses and tractors. Throughout this study we held constant all but the technical coefficients for land use. As previously discussed, the technical coefficients drop as yields rise.
Hybrid corn began to be planted in the late 1930s, principally in Iowa.32
Macy, Arnold, and McKibben, “Changes,” p. 15.
Ryan and Gross, “Acceptance,” p. 668.

CONCLUSIONS
The results from these linear programming models give a simpler and clearer understanding of the motivations for changing technologies. Previous applications of the threshold models, by focusing only on the cost of raising crops, failed to adequately quantify the opportunity cost of the farmer's time. In the 1920s and 1930s tractors did not produce more corn; they produced more time for the farmer. The cost of raising crops with tractors versus horses was not very different. The switch to tractors was a result of giving the farmer more time to engage in productive activities other than crops. With these results explanations such as market imperfections (which can be brought in to explain almost anything) and “lumpiness” of the inputs are not needed. The slow cumulative adoption can be explained by looking at the problem from the perspective of maximizing total net income, not just crop income. To maximize their income in a year, farmers look for the most efficient inputs to their field crop operation and use the saved time to earn greater income in some other activity or off-farm job.
In this article we have not touched on some interesting problems, for example, how the decision to invest in tractor technology might have been influenced by whether the farm was owner-operated or leased, or institutional constraints of that period.34
See, for example, Whatley, “Southern Agrarian,” pp. 45–70.
Appendix: The Technical Coefficients—An Overview35 Details of these calculations are available from the authors. They are published in Dinah Duffy Martini's Ph.D. dissertation, “Technological Change in U.S. Agriculture: The Case of Substitution of Gasoline Tractor Power for Horse Power,” University of Washington, Seattle Washington, 2003.
Details of these calculations are available from the authors. They are published in Dinah Duffy Martini's Ph.D. dissertation, “Technological Change in U.S. Agriculture: The Case of Substitution of Gasoline Tractor Power for Horse Power,” University of Washington, Seattle Washington, 2003.
Each aijk in the model is the amount of input i necessary to produce one unit of output j in a season k. However, there are several tasks in each season. Thus, the inputs must be calculated at the task level and then summed over all the tasks performed in each season to obtain each aijk. Each of these task level calculations requires several data points:
- The tasks in the farming practice
- The machine that was used for the task
- The power source needed to pull that machine
- The time it took that power source to pull the machine across one acre
- The number of times the task was repeated
- The number of acres needed to produce one unit of output
As an example, we calculate the aijk for the labor needed in corn in the Spring using horses. The Spring tasks were plowing, disking harrowing, and planting. In 1930 the most common horse implement for plowing was four horses pulling a two-bottom plow.36
McKibben, Hopkins and Griffin, “Changes,” table 8, p. 22.
Reynoldson et al., “Utilization,” table 8.
To find the horse-hours needed for corn in the spring, the man-hours per acre for each task are multiplied by the number of horses in the team pulling the implement for each task.
THE RESOURCE LIMITS
In general, these limits were the same for horse and tractor farming because at the time the farmer makes the decision to switch he has all the inputs available for horse farming. The literature reports over and over that farmers did not reduce the number of horses or labor until they had operated the tractor for a year or more. Most of the input limits in farming are time based: the number of man-hours, the number of horse-hours, the number of tractor-hours. Because the length of time available to complete a set of tasks is limited to certain periods in the year and days are limited to 24 hours, no matter the power source, the hourly input limits will be the same in all the models.
We derive the first three limits (man-hours, horse-hours, and tractor-hours) mainly from issues of the Iowa Year Book of Agriculture (IYBA) for 1920 through 1940 and the Agriculture Censuses for 1920–1940.38
Iowa State Department of Agriculture. “Iowa Year Book of Agriculture,” vols. 20–41.
MAN-HOURS AVAILABLE CALCULATION
As mentioned earlier, the farmer has a very definite period during which a group of tasks must be completed. Tasks left undone or performed too late cause yields to drop or, worst case, the loss of the crop. This means that when the farmer is planning what crops and how much of each to plant he knows that he must be able to complete, say, the plowing and planting between 15 April and 25 May. He must be able to do all the necessary work himself or he must be able to hire the help to do it. To capture this complex relationship in the model we derive the number of hours available per worker in each season and the number of available workers. The number of hours available depends on:
- the length of the period in which the tasks must be done
- the number of days in that period on which work in the fields can be done
- the number of hours per day
- the number of workers
The general calculation for the man-hours available in any period is: the number of work days in the season × the hours in a work day × the number of workers.
The number of workdays in a season is the total days in the performance period less the number of days it rains. If there are delays, weekend days could become workdays (for the farmer and his family). In the months of May in the years from 1890 to 1922 there were between five and 16 days with more than 0.01 inches of rain in the month.39
Ibid., applicable years.
Thomas and Hopkins, “Costs,” p. 17.
Hopkins et al. reported that most farmers work 12 hours a day and their paid or unpaid helpers work 11. Because all the farmers also raised livestock for market, 3–4 hours per day of chores must be done.41
Hopkins, Goodsell, and Buck, “Economic Study,” p. 38.
Holmes, “Wages,” p. 74.
HORSE-HOURS AVAILABLE CALCULATION
Horses could work eight to ten hours a day. They usually worked for four hours in the morning had an hour or two midday rest and then worked another four. If the days were hot, the work time was reduced to avoid killing the horses with heat exhaustion.
In 1930, a heat wave in July during the grain harvest killed 10,000 horses in just a few days.43
Iowa State Department of Agriculture, “Iowa Year Book,” vol. 30, p. 569.
TRACTOR-HOURS AVAILABLE
The tractor-hours are calculated by multiplying the workdays in the season times 10–12 hours in a day. Generally the tractor-hours are very close to the man-hours. The tractors could theoretically be worked 24 hours a day, but because they require a man to operate them, the available hours are constrained by the available labor hours. We assume one tractor on each tractor farm because very few farms had more than one as shown in Appendix Table 1.44
U.S. Bureau of the Census, “Sixteenth Census,” Agriculture table 11, p. 119.

We are grateful to Doug Allen, Yoram Barzel, Levis Kochin, Jeremy Atack, and two anonymous referees for their insightful comments. Any remaining errors are of course the authors' responsibility.