

1 Introduction
The particle-laden flows through vertically oriented channels, pipes or ducts are commonly encountered in industrial settings, such as circulating fluidized beds, pneumatic transport lines and the drilling industry. Over the past decades, there have been numerous experimental investigations on the vertical wall-bounded turbulent flows laden with spherical particles. Depending on the carrier phase, the experimental works on the interactions between spherical particles and the vertical turbulent flow can be classified into two categories: gas–solid flows (Lee & Durst Reference Lee and Durst1982; Tsuji, Morikawa & Shiomi Reference Tsuji, Morikawa and Shiomi1984; Fessler, Kulick & Eaton Reference Fessler, Kulick and Eaton1994; Kulick, Fessler & Eaton Reference Kulick, Fessler and Eaton1994; Borée & Caraman Reference Borée and Caraman2005; Hadinoto et al. Reference Hadinoto, Jones, Yurteri and Curtis2005; Fong, Amili & Coletti Reference Fong, Amili and Coletti2019) and liquid–solid flows (Alajbegović et al. Reference Alajbegović, Assad, Bonetto and Lahey1994; Hosokawa & Tomiyama Reference Hosokawa and Tomiyama2004; Kameyama et al. Reference Kameyama, Kanai, Kawashima and Ishima2014; Shokri et al. Reference Shokri, Ghaemi, Nobes and Sanders2017). Tsuji et al. (Reference Tsuji, Morikawa and Shiomi1984) measured the air and solid-particle velocities in an upflow vertical pipe by the use of a laser Doppler velocimeter, and observed that large particles increased air turbulence throughout the pipe section, while small particles reduced it. Kulick et al. (Reference Kulick, Fessler and Eaton1994) investigated the interactions between small heavy particles and fluid turbulence in a fully developed downflow channel. Their results showed that the fluid turbulence was attenuated by the addition of particles and the degree of attenuation increased with particle Stokes number, particle mass loading and distance from the wall. The experimental results of Hadinoto et al. (Reference Hadinoto, Jones, Yurteri and Curtis2005) indicated that relatively small particles in a downward pipe flow weakened the turbulence at low Reynolds numbers and enhanced the turbulence at high Reynolds numbers, whereas relatively large particles generally increased the turbulence. Alajbegović et al. (Reference Alajbegović, Assad, Bonetto and Lahey1994) investigated the particle concentration distribution for solid/fluid upflow in a pipe and observed that, at low flow rates, the ceramic particles had an almost uniform distribution, while increasing the flow rate caused coring, and in contrast, the phase distribution of the light polystyrene particles had wall peaking for both the low and high flow rates. It was shown that the solid mean velocity was smaller than the fluid mean velocity in the channel bulk region, and larger than the fluid counterpart for the case of heavy particles in an upflow pipe (Tsuji et al. Reference Tsuji, Morikawa and Shiomi1984; Shokri et al. Reference Shokri, Ghaemi, Nobes and Sanders2017). The results of Shokri et al. (Reference Shokri, Ghaemi, Nobes and Sanders2017) indicated that the lift force on the particles near the wall drove the particles away from the wall, and the slip velocity of the glass bead at the pipe centreline was in good agreement with the calculated terminal velocity. Kameyama et al. (Reference Kameyama, Kanai, Kawashima and Ishima2014) reported that the slip velocity of glass beads in water flow was smaller than the particle terminal velocity. Hosokawa & Tomiyama (Reference Hosokawa and Tomiyama2004) measured the velocities of solid–liquid two-phase dispersed upflows in a vertical pipe and found that the turbulence modification was better correlated with the ratio of the eddy viscosity induced by the dispersed phase to the shear-induced eddy viscosity. No experimental works on a vertical turbulent channel flow laden with non-spherical particles have been reported, to our knowledge.
Numerical studies have been devoted to elucidating the mechanisms of the interactions between spherical particles and vertical turbulent flows, based on the point-particle model (Yamamoto et al. Reference Yamamoto, Potthoff, Tanaka, Kajishima and Tsuji2001; Marchioli, Picciotto & Soldati Reference Marchioli, Picciotto and Soldati2007; Wang Reference Wang2010a,Reference Wangb; Nilsen, Andersson & Zhao Reference Nilsen, Andersson and Zhao2013; Vreman Reference Vreman2015; Milici Reference Milici2018; Wang et al. Reference Wang, Fong, Coletti, Capecelatro and Richter2019). Yamamoto et al. (Reference Yamamoto, Potthoff, Tanaka, Kajishima and Tsuji2001) conducted large-eddy simulations of turbulent gas-particle downward flow in a vertical channel, and their results indicated that the particles attenuated the turbulence for small Stokes numbers, and the profiles of particle mean velocity, particle wall-normal fluctuation velocity and number density were flattened as a result of inter-particle collisions. Marchioli et al. (Reference Marchioli, Picciotto and Soldati2007) investigated the effects of gravity and lift on the dispersion and deposition of heavy particles in a vertical channel with a one-way point-particle model, and concluded that, for the particle Stokes numbers examined, gravity and lift did not influence the qualitative behaviour of the particles even though the velocity profiles and deposition coefficients were modified in a non-monotonic fashion, reaching an optimum for particle Stokes numbers larger than 15. Wang (Reference Wang2010a,Reference Wangb) performed large-eddy simulations with a point-force two-way coupling model to investigate the inter-phase interactions in a vertical downward turbulent channel flow loaded with heavy particles. Their results showed that the particle preferential distribution was attenuated by particle modifications of turbulence (Wang Reference Wang2010a), and the particle addition resulted in a decrease of turbulence fluctuation anisotropy (Wang Reference Wang2010b). Nilsen et al. (Reference Nilsen, Andersson and Zhao2013) examined the effects of gravity on the preferential concentration of inertial particles in a vertical channel flow at a Reynolds number of 395 with a three-dimensional Voronoï analysis and a one-way point-particle direct numerical simulation, and the results indicated that gravity increased the drift of particles towards the walls in an upward flow, while in the downward flow, more particles were transported to the centre of the channel, when the Saffman lift force on the particles was neglected. The mutual interactions between point particles and turbulence in a vertical channel bounded by rough walls were investigated numerically by Milici (Reference Milici2018), and the results showed that the streamwise turbulence intensity increased, whereas the velocity fluctuations in the wall-normal directions were damped, along with substantial attenuation of the Reynolds shear stress due to the particle effects.
Numerical studies based on interface-resolved direct numerical simulations have provided new insights into the interactions between finite-size spherical particles and vertical turbulent flows for the case where the particle settling velocity is comparable to the fluid bulk velocity (Kajishima et al. Reference Kajishima, Takiguchi, Hamasaki and Miyake2001; Uhlmann Reference Uhlmann2008; Garcia-Villalba, Kidanemariam & Uhlmann Reference Garcia-Villalba, Kidanemariam and Uhlmann2012). Kajishima et al. (Reference Kajishima, Takiguchi, Hamasaki and Miyake2001) observed an increase in the turbulence due to the strong wake structures of the particles. Uhlmann (Reference Uhlmann2008) observed the formation of large-scale elongated streak-like structures with streamwise dimensions of the order of eight channel half-widths and cross-stream dimensions of the order of one half-width. They found that the mean fluid velocity profile tended toward a concave shape (roughly flat in the channel bulk region), and the turbulence intensity and the normal stress anisotropy were strongly increased. Like the mean fluid velocity, the particle volume fraction was almost constant in the channel centre region, with a peak in the near-wall region (Uhlmann Reference Uhlmann2008). The effects of the computational domain length, the particle spatial distribution, the particle acceleration statistics and the flow around the particles were investigated by Garcia-Villalba et al. (Reference Garcia-Villalba, Kidanemariam and Uhlmann2012). The essential features of the interface-resolved methods are that the interfaces between the particles and the fluid are resolved and the hydrodynamic forces on the particles are determined from the solution of the flow fields outside the particle boundaries. We note that such methods have been applied to simulations of particle-laden isotropic homogeneous flows (Lucci, Ferrante & Elghobashi Reference Lucci, Ferrante and Elghobashi2010; Gao, Li & Wang Reference Gao, Li and Wang2013), pipe flow (Wu, Shao & Yu Reference Wu, Shao and Yu2011; Peng & Wang Reference Peng and Wang2019), channel flows (Uhlmann Reference Uhlmann2008; Shao, Wu & Yu Reference Shao, Wu and Yu2012; Do-Quang et al. Reference Do-Quang, Amberg, Brethouwer and Johansson2014; Picano, Breugem & Brandt Reference Picano, Breugem and Brandt2015; Wang et al. Reference Wang, Peng, Guo and Yu2016; Yu, Vinkovic & Buffat Reference Yu, Vinkovic and Buffat2016a; Ardekani et al. Reference Ardekani, Costa, Breugem, Picano and Brandt2017; Costa et al. Reference Costa, Picano, Brandt and Breugem2018; Peng, Ayala & Wang Reference Peng, Ayala and Wang2019), duct flows (Lin et al. Reference Lin, Yu, Shao and Wang2017a,Reference Lin, Shao, Yu and Wangb; Fornari et al. Reference Fornari, Kazerooni, Hussong and Brandt2018) and Couette flows (Wang, Abbas & Climent Reference Wang, Abbas and Climent2017).
The dynamics of non-spherical particles is more complicated due to anisotropy of the particle shape. The sedimentation of non-spherical particles in quiescent fluid and the rotation of non-spherical particles in laminar shear flow have been extensively studied (Russel et al. Reference Russel, Hinch, Leal and Tieffenbruck1977; Huang, Feng & Joseph Reference Huang, Feng and Joseph1994; Yu, Phan-Thien & Tanner Reference Yu, Phan-Thien and Tanner2007; Xia et al. Reference Xia, Connington, Rapaka, Yue, Feng and Chen2009; Huang et al. Reference Huang, Yang, Krafczyk and Lu2012). The point-particle-based direct numerical simulations have provided much insights into the interactions between non-spherical particles and turbulent channel flows (Zhang et al. Reference Zhang, Ahmadi, Fan and McLaughlin2001; Mortensen et al. Reference Mortensen, Andersson, Gillissen and Boersma2008a,Reference Mortensen, Andersson, Gillissen and Boersmab; Marchioli, Fantoni & Soldati Reference Marchioli, Fantoni and Soldati2010; Marchioli & Soldati Reference Marchioli and Soldati2013; Challabotla, Zhao & Andersson Reference Challabotla, Zhao and Andersson2015a,Reference Challabotla, Zhao and Anderssonb; Zhao, George & van Wachem Reference Zhao, George and van Wachem2015a; Zhao et al. Reference Zhao, Challabotla, Andersson and Variano2015b; Marchioli, Zhao & Andersson Reference Marchioli, Zhao and Andersson2016; Zhao & Andersson Reference Zhao and Andersson2016). It was commonly observed that the non-spherical particles tended to align their long axes with the streamwise direction (Zhang et al. Reference Zhang, Ahmadi, Fan and McLaughlin2001; Mortensen et al. Reference Mortensen, Andersson, Gillissen and Boersma2008a,Reference Mortensen, Andersson, Gillissen and Boersmab; Marchioli et al. Reference Marchioli, Fantoni and Soldati2010). Zhao et al. (Reference Zhao, Challabotla, Andersson and Variano2015b) observed that, in the channel centre region, oblate particles tended to tumble, whereas prolate particles tended to spin, as in homogeneous isotropic turbulence (Ni et al. Reference Ni, Kramel, Ouellette and Voth2015), and inertia reduced the preferential spinning or tumbling and led to a more isotropic rotation. By contrast, near the walls, inertia did not move the rotation of spheroids toward isotropy, but rather reversed the trend, causing oblate spheroids to rotate strongly about their symmetry axes and prolate spheroids to rotate normal to their symmetry axes. The reason why disks tumbled more than spinned and rods spinned more than tumbled for low inertia was attributed to the preferential alignment of the particle long axis with the local fluid vorticity (Ni et al. Reference Ni, Kramel, Ouellette and Voth2015; Zhao et al. Reference Zhao, Challabotla, Andersson and Variano2015b), which was observed to align preferentially with the strongest Lagrangian stretching direction in homogeneous isotropic turbulence (Ni, Ouellette & Voth Reference Ni, Ouellette and Voth2014; Ni et al. Reference Ni, Kramel, Ouellette and Voth2015). Zhao & Andersson (Reference Zhao and Andersson2016) showed that the preferential orientation of the symmetry axis of tracer rods in the streamwise direction and of flat disks in the wall-normal direction was caused by Lagrangian stretching and not by fluid rotation. Zhao et al. (Reference Zhao, George and van Wachem2015a) employed the four-way coupling point-particle method to examine the interactions between the turbulent channel flow and the prolate spheroids, and observed that the prolate spheroids with large inertia (Stokes number being 30) caused turbulence attenuation and drag reduction. The dynamics of point spheroids in vertical turbulent channel flows has been investigated by Challabotla, Zhao & Andersson (Reference Challabotla, Zhao and Andersson2016a), Challabotla, Zhao & Andersson (Reference Challabotla, Zhao and Andersson2016b), Yuan et al. (Reference Yuan, Andersson, Zhao, Challabotla and Deng2017) and Yuan et al. (Reference Yuan, Zhao, Challabotla, Andersson and Deng2018) with one-way direct numerical simulations. Gravity had a negligible effect on fibre orientation and velocity statistics for fibres with modest inertia, i.e. low Stokes numbers, and had a major impact on the fibre dynamics at higher Stokes numbers (Challabotla et al. Reference Challabotla, Zhao and Andersson2016b). The presence of gravity resulted in an increased fibre density in the downward flow but a nearly uniform distribution of fibres in upward flow (Challabotla et al. Reference Challabotla, Zhao and Andersson2016a,Reference Challabotla, Zhao and Anderssonb). Yuan et al. (Reference Yuan, Andersson, Zhao, Challabotla and Deng2017) observed that gravity and particle shape effects on the oblate particle concentration diminished at higher particle inertia.
The interactions between neutrally buoyant finite-size non-spherical particles and turbulent channel flows have been investigated with the interface-resolved direction numerical simulations (Do-Quang et al. Reference Do-Quang, Amberg, Brethouwer and Johansson2014; Ardekani et al. Reference Ardekani, Costa, Breugem, Picano and Brandt2017; Eshghinejadfard, Hosseini & Thévenin Reference Eshghinejadfard, Hosseini and Thévenin2017; Eshghinejadfard, Zhao & Thévenin Reference Eshghinejadfard, Zhao and Thévenin2018; Zhu, Yu & Shao Reference Zhu, Yu and Shao2018; Ardekani & Brandt Reference Ardekani and Brandt2019). It was commonly observed that the non-spherical particles caused a smaller wall friction, compared to the spherical particles. The drag reduction by finite-size oblate particles was first revealed by Ardekani et al. (Reference Ardekani, Costa, Breugem, Picano and Brandt2017) and subsequently observed in the other works (Eshghinejadfard et al. Reference Eshghinejadfard, Zhao and Thévenin2018; Zhu et al. Reference Zhu, Yu and Shao2018; Ardekani & Brandt Reference Ardekani and Brandt2019). The addition of prolate particles was also found to have drag-reduction effects (Zhu et al. Reference Zhu, Yu and Shao2018; Ardekani & Brandt Reference Ardekani and Brandt2019). The results (Ardekani et al. Reference Ardekani, Costa, Breugem, Picano and Brandt2017; Eshghinejadfard et al. Reference Eshghinejadfard, Zhao and Thévenin2018; Zhu et al. Reference Zhu, Yu and Shao2018; Ardekani & Brandt Reference Ardekani and Brandt2019) indicated that the drag reduction by non-spheroidal particles is caused by two effects together: the low particle volume fraction in the near-wall region, which reduces the contribution of the particle inner shear stress, and the relatively small Reynolds stress. Similar to the point spheroids, the finite-size prolate particles preferentially aligned their symmetry axes with the streamwise direction, and the oblate particles preferentially aligned their symmetry axes with the wall-normal direction. Generally, the prolate particles had higher spinning velocities and lower tumbling velocities in the entire channel region, compared to the oblate particles (Zhu et al. Reference Zhu, Yu and Shao2018), in qualitative agreement with the results for the point spheroids in the bulk region (Zhao et al. Reference Zhao, Challabotla, Andersson and Variano2015b).
The interactions between non-neutrally buoyant finite-size non-spherical particles and turbulent channel flows have not been numerically investigated. The aim of the present study is to examine the interactions between the finite-size spheroidal particles and an upward vertical turbulent channel flow. Section 2 presents a brief description of our numerical model. In § 3, the results of the fluid and solid mean velocities and fluctuating velocities, the particle volume fraction distribution, the particle orientation and rotation, the vortex structure and the flow friction are reported and discussed. The concluding remarks are given in § 4.
2 Numerical model
2.1 Fictitious domain method
A parallel direct-forcing fictitious domain method (DF/FD) is employed for the interface-resolved simulations of particle-laden turbulent flows (Yu et al. Reference Yu, Lin, Shao and Wang2016b). The fictitious domain (FD) method for particulate flows was originally proposed by Glowinski et al. (Reference Glowinski, Pan, Hesla and Joseph1999). The key idea of this method is that the interior of the particles is filled with the fluids and the inner fictitious fluids are enforced to satisfy the rigid body motion constraint through a pseudo-body force, which is introduced as a distributed Lagrange multiplier in the FD formulation (Glowinski et al. Reference Glowinski, Pan, Hesla and Joseph1999). In the following, we describe the DF/FD method briefly, and the reader is referred to Yu & Shao (Reference Yu and Shao2007) for the details.
For simplicity of the description, only one particle is considered in the following exposition. Let  $P(t)$ represent the solid domain and
 $\unicode[STIX]{x1D6FA}$ represent the entire domain, including the interior and exterior of the solid body. The bulk velocity of the suspension (i.e. the fluid–solid mixture)
 $u_{b}$ is kept constant in our simulations. We take the channel half-width
 $H$ as the characteristic length and the bulk velocity
 $u_{b}$ as the characteristic velocity for the non-dimensionalization scheme. The bulk Reynolds number
 $Re_{b}$ is defined by
 $Re_{b}=u_{b}H/\unicode[STIX]{x1D708}$, where
 $\unicode[STIX]{x1D708}$ is the fluid kinematic viscosity. The dimensionless FD formulation for the incompressible fluid can be written as follows:
 $$\begin{eqnarray}\displaystyle & \displaystyle \frac{\unicode[STIX]{x2202}\boldsymbol{u}}{\unicode[STIX]{x2202}t}+\boldsymbol{u}\boldsymbol{\cdot }\unicode[STIX]{x1D735}\boldsymbol{u}=\frac{\unicode[STIX]{x1D6FB}^{2}\boldsymbol{u}}{Re_{b}}-\unicode[STIX]{x1D735}p+\unicode[STIX]{x1D740}\quad \text{in }\unicode[STIX]{x1D6FA}, & \displaystyle\end{eqnarray}$$
 $$\begin{eqnarray}\displaystyle & \displaystyle \boldsymbol{u}=\boldsymbol{U}+\unicode[STIX]{x1D74E}_{p}\times \boldsymbol{r}\quad \text{in }P(t), & \displaystyle\end{eqnarray}$$
 $$\begin{eqnarray}\displaystyle & \displaystyle \unicode[STIX]{x1D735}\boldsymbol{\cdot }\boldsymbol{u}=0\quad \text{in }\unicode[STIX]{x1D6FA}, & \displaystyle\end{eqnarray}$$
 $$\begin{eqnarray}\displaystyle & \displaystyle (\unicode[STIX]{x1D70C}_{r}-1)V_{p}^{\ast }\left(\frac{\text{d}\boldsymbol{U}}{\text{d}t}-Fr\frac{\boldsymbol{g}}{g}\right)=-\int _{P}\unicode[STIX]{x1D740}\,\text{d}\boldsymbol{x}, & \displaystyle\end{eqnarray}$$
 $$\begin{eqnarray}\displaystyle & \displaystyle (\unicode[STIX]{x1D70C}_{r}-1)\frac{\text{d}(\boldsymbol{J}^{\ast }\boldsymbol{\cdot }\unicode[STIX]{x1D74E}_{p})}{\text{d}t}=-\int _{P}\boldsymbol{r}\times \unicode[STIX]{x1D740}\,\text{d}\boldsymbol{x}, & \displaystyle\end{eqnarray}$$
where  $\boldsymbol{u}$,
 $p$,
 $\unicode[STIX]{x1D740}$,
 $\boldsymbol{U}$,
 $\unicode[STIX]{x1D74E}_{p}$,
 $\boldsymbol{r}$ represent the fluid velocity, fluid pressure, distributed Lagrange multiplier, particle translational velocity, particle rotational velocity and position vector with respect to the mass centre of the particle, respectively;
 $\unicode[STIX]{x1D70C}_{r}$ is the ratio of the particle density ratio
 $\unicode[STIX]{x1D70C}_{s}$ to the fluid density ratio
 $\unicode[STIX]{x1D70C}_{f}$, i.e.
 $\unicode[STIX]{x1D70C}_{r}=\unicode[STIX]{x1D70C}_{s}/\unicode[STIX]{x1D70C}_{f}$;
 $Fr$ represents the Froude number defined by
 $Fr=gH/u_{b}^{2}$, with
 $g$ being the gravitational acceleration;
 $V_{p}^{\ast }$ and
 $\boldsymbol{J}^{\ast }$ are the dimensionless particle volume and moment of inertia tensor, defined by
 $V_{p}^{\ast }=V_{p}/H^{3}$ and
 $\boldsymbol{J}^{\ast }=\boldsymbol{J}/\unicode[STIX]{x1D70C}_{s}H^{5}$, respectively.
A fractional-step time scheme is used to decouple the system (2.1)–(2.5) into the following two sub-problems.
Fluid sub-problem for  $\boldsymbol{u}^{\ast }$ and
 $p$
 $$\begin{eqnarray}\displaystyle & \displaystyle \frac{\boldsymbol{u}^{\ast }-\boldsymbol{u}^{n}}{\unicode[STIX]{x0394}t}-\frac{1}{2}\frac{\unicode[STIX]{x1D6FB}^{2}\boldsymbol{u}^{\ast }}{Re_{b}}=-\unicode[STIX]{x1D735}p-\frac{1}{2}[3(\boldsymbol{u}\boldsymbol{\cdot }\unicode[STIX]{x1D735}\boldsymbol{u})^{n}-(\boldsymbol{u}\boldsymbol{\cdot }\unicode[STIX]{x1D735}\boldsymbol{u})^{n-1}]+\frac{1}{2}\frac{\unicode[STIX]{x1D6FB}^{2}\boldsymbol{u}^{n}}{Re_{b}}+\unicode[STIX]{x1D740}^{n}, & \displaystyle\end{eqnarray}$$
 $$\begin{eqnarray}\displaystyle & \displaystyle \unicode[STIX]{x1D735}\boldsymbol{\cdot }\boldsymbol{u}^{\ast }=0. & \displaystyle\end{eqnarray}$$
A finite-difference-based projection method on a homogeneous half-staggered grid is used for the solution of the above fluid sub-problem. All spatial derivatives are discretized with the second-order central difference scheme.
Particle sub-problem for  $\boldsymbol{U}^{n+1}$,
 $\unicode[STIX]{x1D74E}_{p}^{n+1}$,
 $\unicode[STIX]{x1D740}^{n+1}$ and
 $\boldsymbol{u}^{n+1}$
 $$\begin{eqnarray}\displaystyle & \displaystyle \unicode[STIX]{x1D70C}_{r}V_{p}^{\ast }\frac{\boldsymbol{U}^{n+1}}{\unicode[STIX]{x0394}t}=(\unicode[STIX]{x1D70C}_{r}-1)V_{p}^{\ast }\left(\frac{\boldsymbol{U}^{n}}{\unicode[STIX]{x0394}t}+Fr\frac{\boldsymbol{g}}{g}\right)+\int _{P}\left(\frac{\boldsymbol{u}^{\ast }}{\unicode[STIX]{x0394}t}-\unicode[STIX]{x1D740}^{n}\right)\,\text{d}\boldsymbol{x}, & \displaystyle\end{eqnarray}$$
 $$\begin{eqnarray}\displaystyle & \displaystyle \unicode[STIX]{x1D70C}_{r}\frac{\boldsymbol{J}^{\ast }\boldsymbol{\cdot }\unicode[STIX]{x1D74E}_{p}^{n+1}}{\unicode[STIX]{x0394}t}=(\unicode[STIX]{x1D70C}_{r}-1)\left[\frac{\boldsymbol{J}^{\ast }\boldsymbol{\cdot }\unicode[STIX]{x1D74E}_{p}^{n}}{\unicode[STIX]{x0394}t}-\unicode[STIX]{x1D74E}_{p}^{n}\times (\boldsymbol{J}^{\ast }\boldsymbol{\cdot }\unicode[STIX]{x1D74E}_{p}^{n})\right]+\int _{P}\boldsymbol{r}\times \left(\frac{\boldsymbol{u}^{\ast }}{\unicode[STIX]{x0394}t}-\unicode[STIX]{x1D740}^{n}\right)\,\text{d}\boldsymbol{x}. & \displaystyle\end{eqnarray}$$
Note that the above equations have been reformulated so that all the right-hand side terms are known quantities and consequently the particle velocities  $\boldsymbol{U}^{n+1}$ and
 $\unicode[STIX]{x1D74E}_{p}^{n+1}$ are obtained without iteration. Then, the pseudo-body forces
 $\unicode[STIX]{x1D740}$ defined at the Lagrangian nodes are determined from
 $$\begin{eqnarray}\unicode[STIX]{x1D740}^{n+1}=\frac{\boldsymbol{U}^{n+1}+\unicode[STIX]{x1D74E}_{p}^{n+1}\times \boldsymbol{r}-\boldsymbol{u}^{\ast }}{\unicode[STIX]{x0394}t}+\unicode[STIX]{x1D740}^{n}.\end{eqnarray}$$
Finally, the fluid velocities  $\boldsymbol{u}^{n+1}$ at the Eulerian nodes are corrected from
 $$\begin{eqnarray}\boldsymbol{u}^{n+1}=\boldsymbol{u}^{\ast }+\unicode[STIX]{x0394}t(\unicode[STIX]{x1D740}^{n+1}-\unicode[STIX]{x1D740}^{n}).\end{eqnarray}$$
In the above manipulations, a tri-linear function is used to transfer the fluid velocity from the Eulerian nodes to the Lagrangian nodes, and the pseudo-body force from the Lagrangian nodes to the Eulerian nodes.
2.2 Collision model
A particle–particle collision model is required to prevent the mutual penetration of particles. We assume that a repulsive force is activated when the distance between the surfaces of two spheroids is smaller than a critical value. This force acts on the two surface points of shortest distance between two particles along the connecter of these two points, and is transferred to the force on the particle mass centre plus a torque. We adopt an efficient iterative method proposed by Lin & Han (Reference Lin and Han2002) to determine the positions of two points of shortest distance between two spheroids. The force has the form
 $$\begin{eqnarray}\boldsymbol{F}_{ij}=F_{0}(1-d_{ij}/d_{c})\boldsymbol{n}_{ij},\end{eqnarray}$$
where  $\boldsymbol{F}_{ij}$,
 $d_{ij}$ and
 $\boldsymbol{n}_{ij}$ are the repulsive force acting on particle
 $j$ from particle
 $i$, the gap distance and the unit vector parallel to the connecter of two shortest distance points;
 $d_{c}$ represents a cutoff distance and the repulsive force is activated when
 $d_{ij}<d_{c}$;
 $F_{0}$ is the magnitude of the force at contact. We set
 $d_{c}=h$ (
 $h$ being the fluid mesh size), and
 $F_{0}=10^{3}$. The motions of the particles due to the collision force (2.12) and due to the hydrodynamic force (2.8)–(2.11) are handled separately with a fractional-step scheme. The time step for the collision model is set to be one tenth of the latter (i.e.
 $\unicode[STIX]{x0394}t/10$) to circumvent the stiffness problem arising from the explicit integration scheme with a large value of
 $F_{0}$, as suggested by Glowinski et al. (Reference Glowinski, Pan, Hesla and Joseph1999). A collision between a particle and a wall is treated similarly with the coefficient
 $F_{0}$ in (2.12) doubled.
The repulsive force in our collision model is similar to the elastic (spring) force in the discrete element model (referred to as DEM) developed originally for the simulation of granular materials. In the DEM collision model, besides the spring-like repulsive force, the viscous damping force in the normal direction and the tangential friction force are also employed. In our previous work on the horizontal turbulent duct flow laden with heavy spherical particles (Lin et al. Reference Lin, Shao, Yu and Wang2017b), it was observed that the relative difference in the bulk velocity under the same pressure gradient obtained with the simple repulsive force model and the DEM model was around 4 % at a particle volume fraction of 2.36 % for the case where most particles settled down on the bottom wall and the difference became smaller for a lower particle settling effect. For the vertical channel flow here, the particles tend to migrate away from the wall and there are few particles in the near-wall region, therefore, the effect of the particle collision model at the same particle volume fraction of 2.36 % is expected to be less significant than that for the horizontal duct flow, since the particles located closer to the wall collide more frequently due to a higher velocity gradient.
Note that the repulsive force at contact  $F_{0}$ is normalized with
 $\unicode[STIX]{x1D70C}_{f}u_{b}^{2}H^{2}$, and thus
 $F_{0}=10^{3}$ is much larger than the hydrodynamic force on the particles and contact without a gap between the particles is prevented. In one sense, one may think that there exist physically short-range repulsive forces between the particles (and between the particles and the wall) in our fluid–solid system.
2.3 Flow configuration and simulation settings
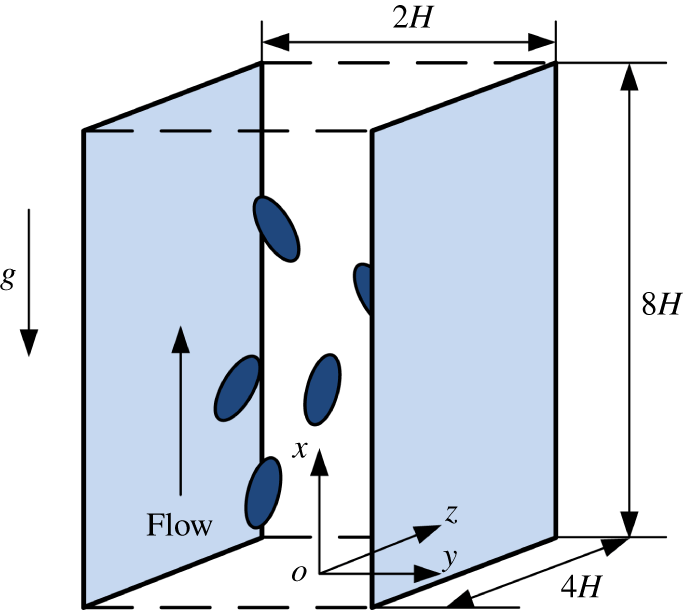
Schematic diagram for the upward channel flow, with  $x$,
 $y$ and
 $z$ representing the streamwise, transverse and spanwise coordinates, respectively.

The schematic diagram for the upward channel flow is shown in figure 1. The no-slip velocity boundary condition is imposed on the channel walls, and the periodic boundary condition is imposed in the streamwise and spanwise directions, respectively. The fluid is assumed to move upwards, and gravity points downwards. In the present study, we only consider heavy particles and refer to their gravity-driven downward relative motion with respect to the fluid as ‘sedimentation’ or ‘settling’. We denote the half-width of the channel as  $H$. The computational domain spans
 $[0,8H]\times [-H,H]\times [0,4H]$. The bulk velocity of the suspension (i.e. the fluid–solid mixture)
 $u_{b}$ is kept constant in our simulations. We take
 $H$ as the characteristic length and the bulk velocity
 $u_{b}$ as the characteristic velocity, as mentioned earlier. The bulk Reynolds number defined by
 $Re_{b}=u_{b}H/\unicode[STIX]{x1D708}$ is 2873, which is determined from the bulk velocity of our single-phase flow with
 $h=H/64$ (
 $h$ being the mesh size) at the friction Reynolds number
 $Re_{\unicode[STIX]{x1D70F}}=u_{\unicode[STIX]{x1D70F}}H/\unicode[STIX]{x1D708}=180$ (
 $u_{\unicode[STIX]{x1D70F}}$ being the wall friction velocity). The friction velocity is defined as
 $u_{\unicode[STIX]{x1D70F}}=\sqrt{\unicode[STIX]{x1D70F}_{w}/\unicode[STIX]{x1D70C}_{f}}$, here
 $\unicode[STIX]{x1D70F}_{w}$ is the mean shear stress on the walls, and
 $\unicode[STIX]{x1D70C}_{f}$ denotes the fluid density. For our single-phase flow with
 $h=H/128$, which is used in the present study,
 $Re_{\unicode[STIX]{x1D70F}}=180.8$.
We consider spheroidal particles, which are characterized by three semi-axes  $(a=b\neq c)$, with
 $c$ being the semi-symmetry axis. The aspect ratio
 $\unicode[STIX]{x1D706}=c/a$ distinguishes between prolate spheroids
 $(\unicode[STIX]{x1D706}>1)$, spheres
 $(\unicode[STIX]{x1D706}=1)$ and oblate spheroids
 $(\unicode[STIX]{x1D706}<1)$.
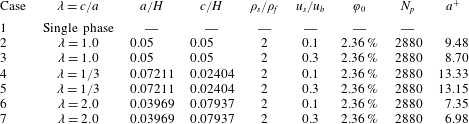
Physical parameter settings for the simulations of particulate upward flows in a vertical channel. In all cases, the particle equivalent radius is  $a_{e}=H/20$.

The settings of the physical parameters for our numerical simulations are presented in table 1. For all particle-laden cases, the particle equivalent radius is  $a_{e}=H/20$. We choose
 $\unicode[STIX]{x1D706}=2$ for the prolate particle and
 $\unicode[STIX]{x1D706}=1/3$ for the oblate particle. Throughout this study, the particle–fluid density ratio is
 $\unicode[STIX]{x1D70C}_{r}=2.0$. There are 2880 particles, corresponding to a particle volume fraction
 $\unicode[STIX]{x1D711}_{0}=2.36\,\%$. The length of the semi-axis in wall units computed with the friction velocity for each case is presented in table 1. We use the ratio of the Stokes free-fall velocity of a sphere
 $u_{s}$ to the bulk velocity
 $u_{b}$ to measure the settling effect of the particles in the vertical channel flow. The Stokes velocity
 $u_{s}$ is defined by
 $u_{s}=2(\unicode[STIX]{x1D70C}_{s}-\unicode[STIX]{x1D70C}_{f})ga^{2}/(9\unicode[STIX]{x1D707})$. The Froude number for the non-neutrally buoyant case is not an independent control parameter, and can be determined from the other control parameters
 $$\begin{eqnarray}Fr=\frac{gH}{u_{b}^{2}}=\frac{9(u_{s}/u_{b})}{(\unicode[STIX]{x1D70C}_{r}-1)(a/H)^{2}Re_{b}}.\end{eqnarray}$$
We refer to  $u_{s}/u_{b}$ as the settling coefficient, and in the following, we often simplify it as
 $u_{s}$, since the dimensionless value of
 $u_{b}$ in our computations is unity. Two settling coefficients are considered
 $u_{s}/u_{b}=0.1$ and 0.3, which turn out to represent weak and moderate settling effects, respectively. The terminal settling velocity of a spherical particle in an unbounded domain is smaller than the Stokes velocity due to the fluid inertial effect, and can be determined from the Stokes velocity, the particle size and the bulk Reynolds number with the following equation:
 $$\begin{eqnarray}C_{D}{\textstyle \frac{1}{2}}\unicode[STIX]{x1D70C}_{f}u_{T}^{2}\unicode[STIX]{x03C0}a_{e}^{2}=6\unicode[STIX]{x03C0}a_{e}\unicode[STIX]{x1D707}u_{s},\end{eqnarray}$$
where the standard drag coefficient  $C_{D}$ has the form
 $$\begin{eqnarray}C_{D}=\frac{24}{Re_{p}}(1+0.15Re_{p}^{0.687}),\end{eqnarray}$$
in which  $Re_{p}$ represents the particle Reynolds number defined as
 $Re_{p}=2a_{e}u_{T}/\unicode[STIX]{x1D708}$. For the
 $a_{e}/H=0.05$ and
 $Re_{b}=2873$ values considered,
 $u_{T}/u_{b}=0.05125$ for
 $u_{s}/u_{b}=0.1$, and
 $u_{T}/u_{b}=0.1135$ for
 $u_{s}/u_{b}=0.3$. Then,
 $Re_{p}=14.7$ for
 $u_{s}/u_{b}=0.1$, and
 $Re_{p}=32.6$ for
 $u_{s}/u_{b}=0.3$. The settling coefficient, the terminal settling velocity and the difference between the fluid and solid mean velocities in the channel centre region for the spherical particle case are compared in table 2. The inter-phase mean velocity difference is smaller than the particle terminal velocity in the presence of fluid inertia, which can be easily understood, considering that both the lateral and streamwise velocity fluctuations can lead to the enhancement in the total drag compared to the no fluctuation case since the drag on the individual particle is proportional to
 $u^{\unicode[STIX]{x1D6FC}}$ (with
 $u$ being the slip velocity and
 $\unicode[STIX]{x1D6FC}>1$ due to fluid inertia), and the hydrodynamic interactions between particles can also hinder the particle settling. The inter-phase mean velocity difference being smaller than the particle terminal velocity was observed experimentally in an upward vertical turbulent channel flow (Kameyama et al. Reference Kameyama, Kanai, Kawashima and Ishima2014) and an isotropic turbulent flow (Doroodchi et al. Reference Doroodchi, Evans, Schwarz, Lane, Shah and Nguyen2008).
Comparison of the settling coefficient, the terminal settling velocity and the difference between the fluid and solid mean velocities in the channel centre region for the spherical particle case.

The grid number is  $1024\times 256\times 512$, corresponding to a spatial resolution of
 $2a_{e}/h=12.8$, and
 $h^{+}=1.40$ in wall units. The dimensionless time step is 0.0008. The fluid statistics are obtained from the averaging of the data in the real fluid domain over a period of typically one thousand non-dimensional time units (i.e. approximately 63 large-eddy turnover times) after the statistically steady state is reached. The statistics for the solid-phase velocity and volume fraction are obtained from the averaging of the data in the solid domain (i.e. inside the particle boundary), whereas the orientation and rotational velocity statistics are calculated with the particle data.
The accuracy of our DF/FD code for the single-phase turbulence and good mesh convergence of the turbulence statistics for the particle-laden flows (even for the coarse mesh of 6.4 points per one particle diameter) have been demonstrated in Yu et al. (Reference Yu, Lin, Shao and Wang2016b). Our results on the turbulent channel flow laden with finite-size neutrally buoyant particles have been compared to lattice Boltzmann simulations using interpolated bounce back at the fluid–solid interfaces, and the two completely different numerical approaches yielded quantitatively similar results in general (Wang et al. Reference Wang, Peng, Guo and Yu2016). Our DF/FD code has been applied to various types of particle-laden turbulent flows including pipe flow (Wu et al. Reference Wu, Shao and Yu2011), duct flow (Lin et al. Reference Lin, Yu, Shao and Wang2017a,Reference Lin, Shao, Yu and Wangb) and channel flow laden with spherical particles (Shao et al. Reference Shao, Wu and Yu2012; Yu et al. Reference Yu, Lin, Shao and Wang2017) and spheroidal particles (Zhu et al. Reference Zhu, Yu and Shao2018), respectively. Thus, the validation of our code is not conducted here.
3 Results and discussion
We will present and discuss the results for the fluid and solid mean velocities and fluctuating velocities, the particle volume fraction distribution, the particle orientation and rotation, the vortex structure and the flow friction. Note that, although  $y$ is defined as the coordinate in the wall-normal direction, ranging from
 $-H$ to
 $H$ (or
 $-1$ to 1 for its dimensionless value), as used in figures 5 and 13, for convenience, it is also used as the distance away from the wall when presenting the profiles for the statistics.
Zhu et al. (Reference Zhu, Yu and Shao2018) examined the interactions between neutrally buoyant spheroidal particles and turbulent channel flow for  $a_{e}/H=0.1$ and different aspect ratios ranging from
 $1/3$ to 8. Due to the huge computational cost, the neutrally buoyant case for
 $a_{e}/H=0.05$ is not simulated here. We will refer to Zhu et al. (Reference Zhu, Yu and Shao2018) as the ‘neutrally buoyant case’.
3.1 Fluid velocities
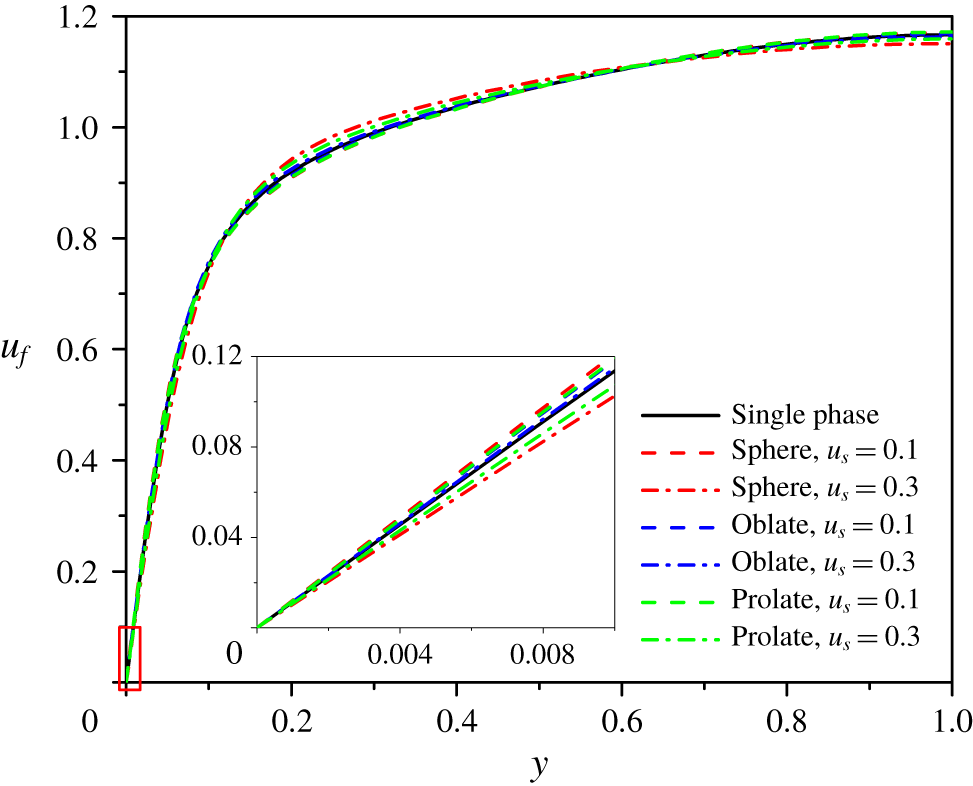
Fluid mean velocity profiles of particle-laden turbulent channel flows. The inset shows the close up at the wall.

The fluid-phase mean velocity profiles for all seven cases studied are plotted in figure 2, with the inset showing the close up of the velocities in the immediate vicinity of the wall. From figure 2, in the bulk region (say  $y>0.2H$, with
 $y$ being the distance away from the wall) the velocity profiles for
 $u_{s}=0.3$ are flatter than that for the single-phase flow, consistent with the observation that the velocity profile was largely flat in the bulk region when the particle mean settling velocity was comparable to the bulk velocity (Uhlmann Reference Uhlmann2008; Santarelli & Fröhlich Reference Santarelli and Fröhlich2015). Normally, a flatter velocity profile means a larger velocity gradient on the wall (i.e. larger flow friction). However, it is interesting that the velocity gradients for the spherical and prolate particle cases were smaller than that of the single-phase flow, as shown in the inset of figure 2. The inset of figure 2 also shows that the flow friction is largest for the spherical particles and smallest for the oblate particles in the case of
 $u_{s}=0.1$, as observed for the neutrally buoyant case (Zhu et al. Reference Zhu, Yu and Shao2018), whereas it is largest for the oblate particles and smallest for the spherical particles in the case of
 $u_{s}=0.3$, exactly opposite to the case of
 $u_{s}=0.1$. The flow friction coefficients are listed in table 3. This is the most important finding and the focus of the present study, and we will analyse the reason later.
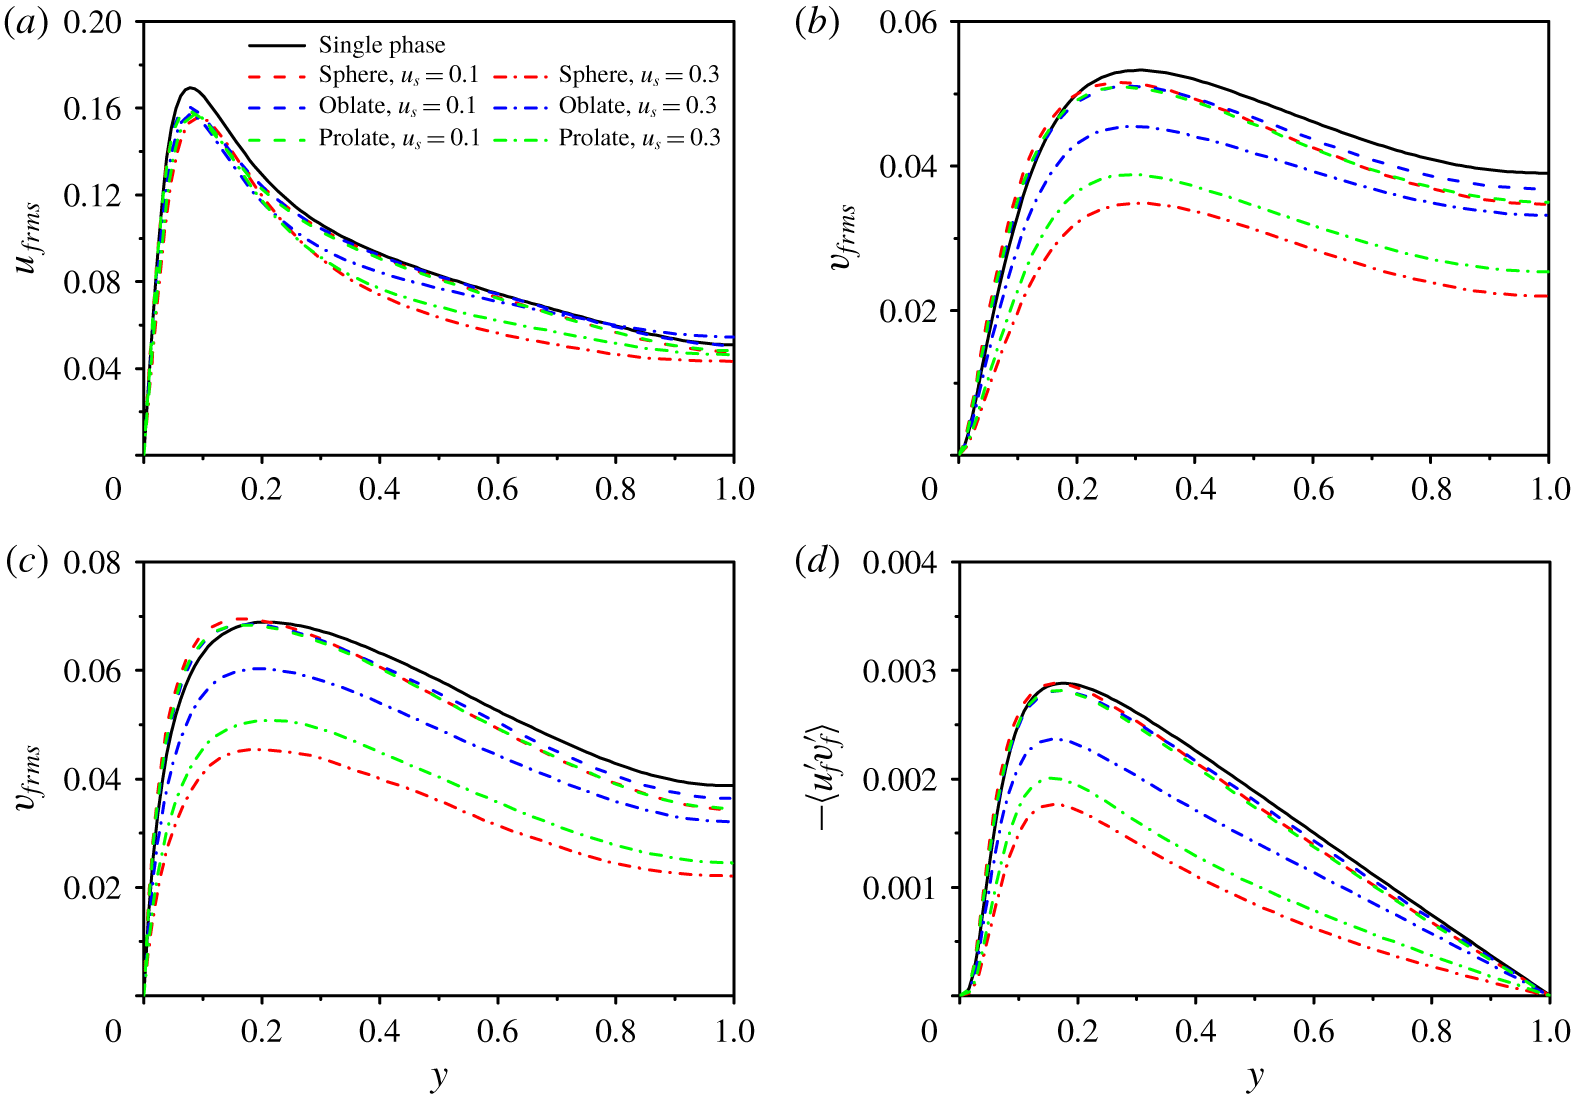
Profiles of the root-mean-square velocity components and the Reynolds shear stress for the fluid phase: (a) streamwise  $u_{frms}$, (b) wall normal
 $v_{frms}$, (c) spanwise
 $w_{frms}$, (d) the Reynolds stress
 $-\langle u_{f}^{\prime }v_{f}^{\prime }\rangle$.

Figure 3 shows the profiles of the root-mean-square (r.m.s.) velocity components and the Reynolds shear stress. The particle addition attenuates the peak streamwise r.m.s. velocity and enhances the transverse and spanwise r.m.s. velocities near the wall for  $u_{s}=0.1$, as for the neutrally buoyant case (Shao et al. Reference Shao, Wu and Yu2012; Picano et al. Reference Picano, Breugem and Brandt2015; Wang et al. Reference Wang, Peng, Guo and Yu2016), whereas all r.m.s. velocity components and the Reynolds shear stress are attenuated at any transverse position for
 $u_{s}=0.3$, irrespective of particle shape. The effects of the particle shape on the fluid r.m.s. velocities and Reynolds stress are relatively small for
 $u_{s}=0.1$, and become significant for
 $u_{s}=0.3$. For the neutrally buoyant case, the oblate particles of
 $\unicode[STIX]{x1D706}=1/3$ caused a lower fluid Reynolds stress than the spherical particles and the prolate particles of
 $\unicode[STIX]{x1D706}=2$ (Zhu et al. Reference Zhu, Yu and Shao2018), which is one factor related to the drag reduction by the oblate particles for
 $\unicode[STIX]{x1D706}=1/3$. By contrast, for the non-neutrally buoyant case at
 $u_{s}=0.3$, all r.m.s. velocity components and the Reynolds stress are largest in the oblate case and smallest in the sphere case. For
 $u_{s}=0.1$, the r.m.s. velocities and Reynolds stress in the channel centre region become largest in the oblate case, due to the particle settling effect.
3.2 Solid-phase velocities
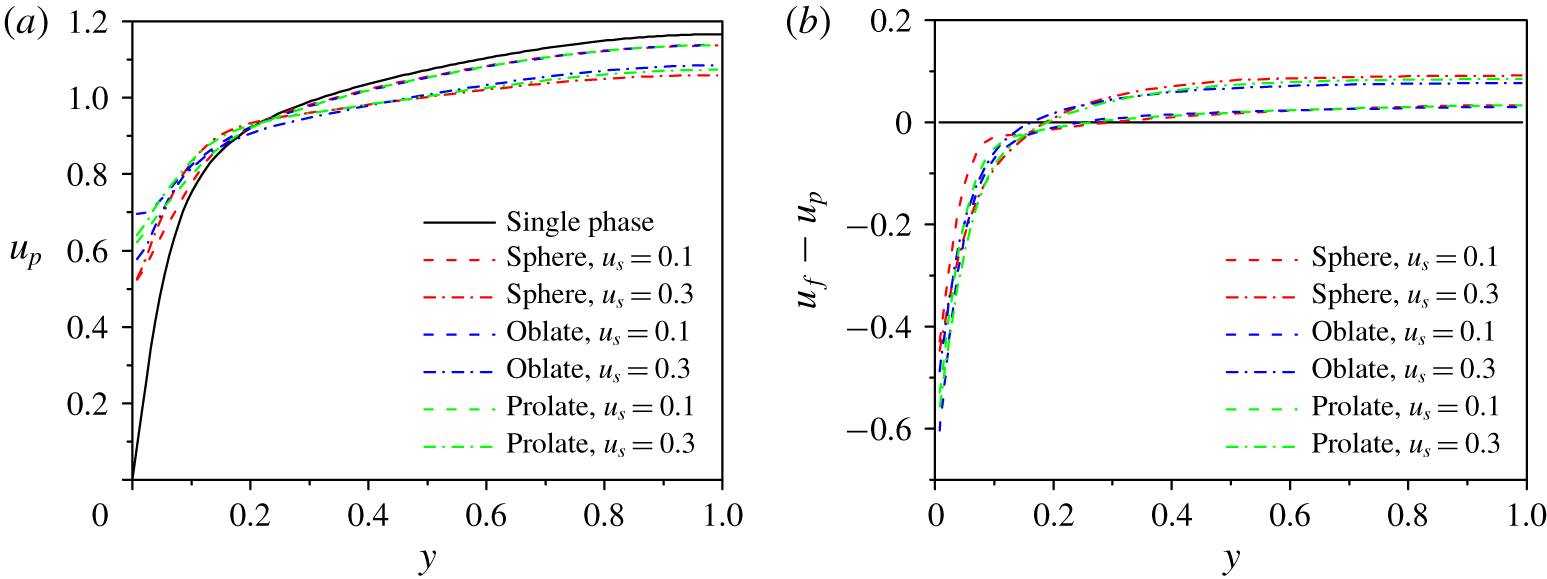
(a) Solid-phase mean velocity profiles, and (b) difference between the fluid and solid mean velocities for upward vertical turbulent channel flows.

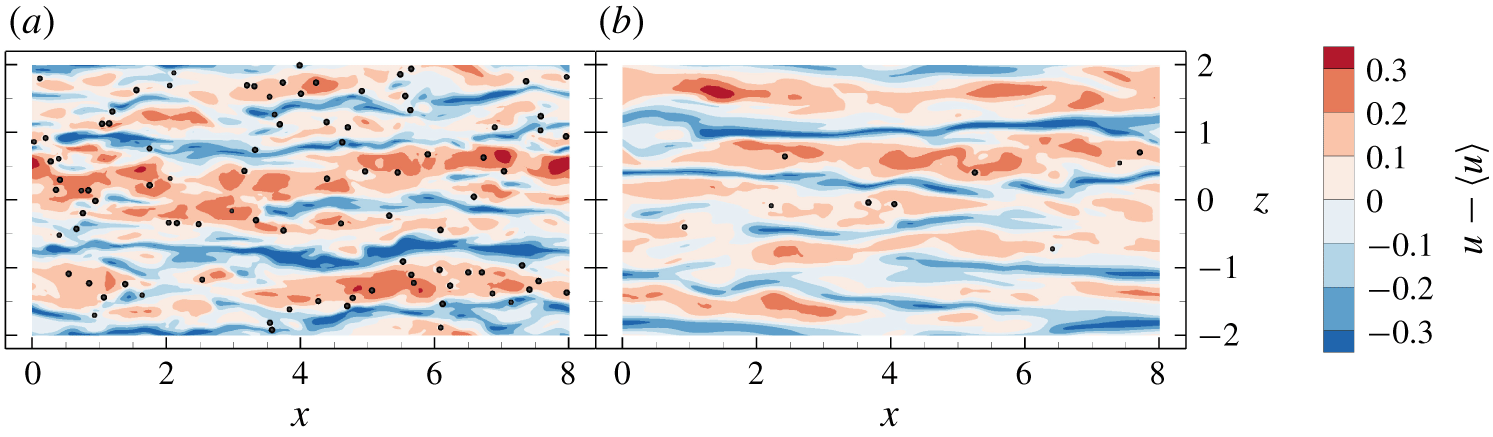
Snapshots of spherical particles and low- and high-speed streaks in the plane of  $y/H=-0.9$ for (a)
 $u_{s}=0.1$ and (b)
 $u_{s}=0.3$.

The mean particle-phase velocity and fluid–particle velocity difference profiles are plotted in figures 4(a) and 4(b), respectively. For all particle-laden cases, the solid mean velocities are smaller than the fluid mean velocities in the bulk region, but larger than the fluid mean velocities in the near-wall region, as observed experimentally in particle-laden upward vertical pipe flow (Tsuji et al. Reference Tsuji, Morikawa and Shiomi1984; Shokri et al. Reference Shokri, Ghaemi, Nobes and Sanders2017). The smaller particle velocity in the bulk region is due to the particle settling effect. The reason for the larger particle mean velocity near the wall was attributed to the facts that the particles can slip on the wall and are preferentially located in the fluid high-speed streaks (Tsuji et al. Reference Tsuji, Morikawa and Shiomi1984; Shokri et al. Reference Shokri, Ghaemi, Nobes and Sanders2017; Do-Quang et al. Reference Do-Quang, Amberg, Brethouwer and Johansson2014). From figure 4(a), the particle mean velocity profiles become flatter for a higher settling coefficient, with the spherical particle case being most pronounced. In the bulk region, the settling (or slip) velocity of the spherical particles is larger than the non-spherical particles, which can be explained by the observation that non-spherical settling particles tend to align their long axes perpendicular to the settling direction in the bulk region due to fluid inertia (see figure 11). The mean settling velocity of the oblate particles is smallest, since the projected (upwinding) area of the oblate particle with  $\unicode[STIX]{x1D706}=1/3$ in the streamwise direction is larger than that of the prolate particle with
 $\unicode[STIX]{x1D706}=2$ and that of the spherical particle. Figure 4(b) shows that the particles lead the fluid more significantly on average in the near-wall region for
 $u_{s}=0.3$, compared to the case of
 $u_{s}=0.1$, although the settling velocity of a particle in quiescent fluid is larger for
 $u_{s}=0.3$. To seek the reason, snapshots of spherical particles and velocity streaks in the plane of
 $y/H=-0.9$ for
 $u_{s}=0.1$ and
 $u_{s}=0.3$ are plotted in figure 5. Figure 5 presents an evidence that the particles are preferentially located in the fluid high-speed streaks, and the comparison between figure 5(a,b) shows that such a preference is stronger for a higher settling coefficient; almost all particles are located in high-speed streaks for
 $u_{s}=0.3$ at the time randomly chosen.
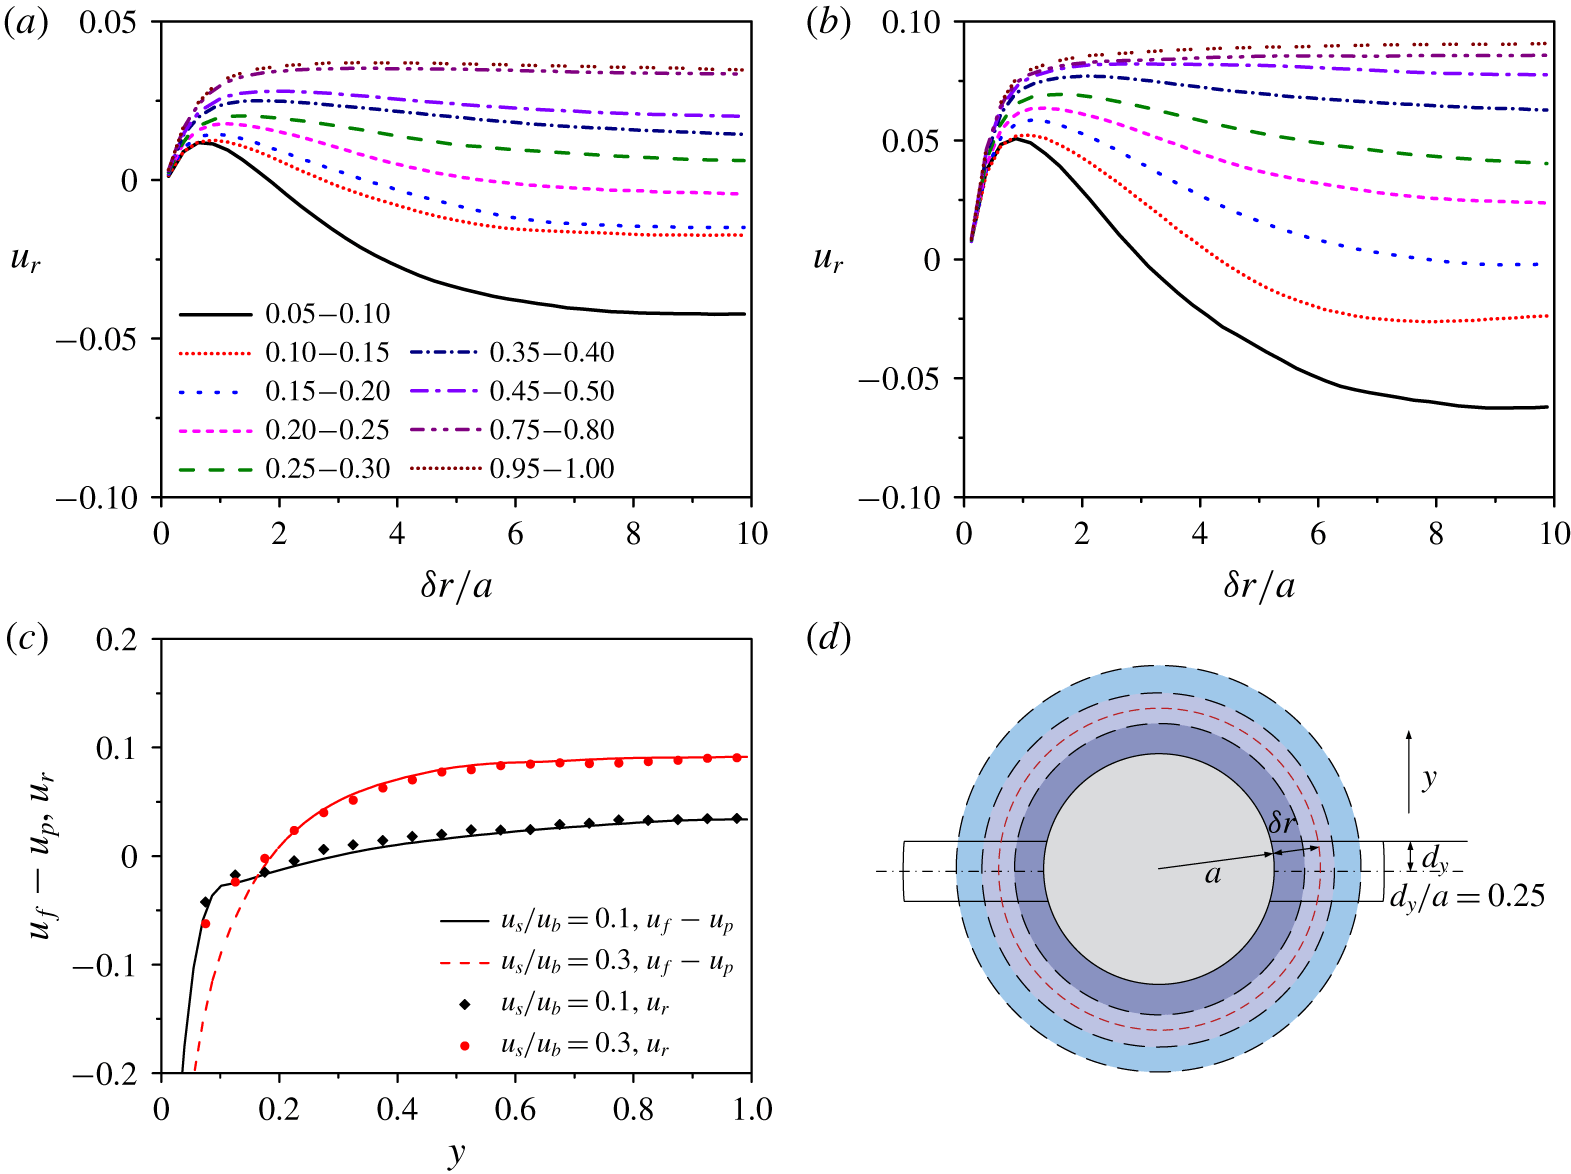
Relative mean velocities of the fluid in an annular band (cut shell) of thickness  $a/4$ with respect to the spherical particle as a function of the distance between the shell and the particle for different
 $y$-bands of width
 $0.05H$, and (a)
 $u_{s}=0.1$ and (b)
 $u_{s}=0.3$. (c) Comparison between the relative mean velocity at
 $\unicode[STIX]{x1D6FF}r=9.875a$ and the inter-phase mean velocity difference, and (d) schematic diagram of the computational model for the relative mean velocity of the fluid with respect to the particle. The averaging is performed for the particles located in each
 $y$-band during statistically steady state; the legend ‘0.05–0.1’ in (a) means the
 $y$-band of
 $0.05H<y<0.1H$.

The time for the flow field in figure 5 is randomly chosen, however, it is more rigorous to inspect the relative mean velocity of the surrounding fluid with respect to the particles. Cisse, Homann & Bec (Reference Cisse, Homann and Bec2013) and Fornari et al. (Reference Fornari, Picano, Sardina and Brandt2016b) calculated the relative mean velocity by averaging the fluid velocity in the region of a spherical shell surrounding each particle. For turbulent channel flow with an inhomogeneous velocity distribution (i.e. non-constant shear rate distribution), it is not appropriate to take an entire spherical shell as the averaging region. Since the particle velocity is the velocity of the particle centre, it is better to compare the particle velocity with the velocity of the fluid in the region with the  $y$-position close to that of the particle centre. Figure 6(d) shows the schematic diagram of our computational model for the relative mean velocity. The averaging region is a part of a spherical shell of thickness
 $a/4$ (
 $a$ being the particle radius) between two planes located at
 $y_{0}\pm d_{y}$, where
 $y_{0}$ is the
 $y$-position of the particle centre and
 $d_{y}$ is the half-height of the averaging region (i.e. an annular band). Zhu et al. (Reference Zhu, Yu, Shao and Deng2020) showed that
 $d_{y}=0.25a$ is a good choice, and therefore this value is chosen here. The mean relative velocities of the fluid with respect to the spherical particles as a function of the distance between the cut shell and the particle
 $\unicode[STIX]{x1D6FF}r$ for
 $u_{s}=0.1$ and
 $u_{s}=0.3$ are plotted in figures 6(a) and 6(b), respectively. Figure 6(c) shows the comparison between the relative mean velocity at
 $\unicode[STIX]{x1D6FF}r=9.875a$ and the inter-phase mean velocity difference. The relative mean velocity agrees well with the inter-phase mean velocity difference, except for
 $y\leqslant 0.125H$ at
 $u_{s}=0.3$. The discrepancy might be caused by the insufficient particle sample number, since there are few particles near the wall for
 $u_{s}=0.3$. However, the averaging period is around 1000 time units and the results are observed to change little when the averaging time is further increased.
From figure 6(a,b), the relative mean velocity of the fluid first increases with increasing distance away from the particle roughly along the  $x$–
 $z$ plane for all
 $y$-positions in the channel, due to the particle sedimentation effect, and then deceases with increasing distance roughly for
 $y<0.5H$, which indicates that the settling particles near the wall are preferentially located in the high-speed regions. The decrease in the mean relative velocity with the distance is more pronounced for
 $u_{s}=0.3$ particularly in the near-wall region, and this is the statistical evidence that the particles have a stronger preference to be located in the high-speed region for a higher settling coefficient. In the near-wall region of
 $y<0.15H$, the particle phase-averaged velocity is larger than the fluid phase-averaged velocity, as shown in figure 4(b), and also larger than the mean velocity of the far-field fluid, as shown in figure 6(a,b), however, the particles still lag the surrounding near-field fluid due to the particle sedimentation effect (figure 6a,b). It has been recognized that the Saffman lift force can cause the particles which lag the fluid to migrate towards the channel centre in upward vertical channel flow (Yu, Phan-Thien & Tanner Reference Yu, Phan-Thien and Tanner2004; Marchioli et al. Reference Marchioli, Picciotto and Soldati2007). Thus, the Saffman effect can explain the lateral migration of the particles towards the channel centre in the entire channel.
The results from the point-particle simulations without consideration of the Saffman lift force showed that gravity had important effects on the concentration distribution of the particles with large inertia. Both the results of Marchioli et al. (Reference Marchioli, Picciotto and Soldati2007) and Nilsen et al. (Reference Nilsen, Andersson and Zhao2013) indicated that the inertial particles migrated towards the channel centre in a downward turbulent channel flow, opposite to the prediction by the Saffman effect. For the upward turbulent channel flow, migration of the inertial particles towards the wall was observed by Nilsen et al. (Reference Nilsen, Andersson and Zhao2013), and an almost constant particle volume fraction in the bulk region was observed by Marchioli et al. (Reference Marchioli, Picciotto and Soldati2007) for Stokes numbers up to 25. Their Stokes number was defined as  $St=2\unicode[STIX]{x1D70C}_{r}(au_{\unicode[STIX]{x1D70F}}/\unicode[STIX]{x1D708})^{2}/9$, which equals 36 for our simulations at
 $\unicode[STIX]{x1D70C}_{r}=2.0$,
 $a/H=0.05$ and
 $Re_{\unicode[STIX]{x1D70F}}=180$. It was observed in the interface-resolved simulations that the finite-size heavy particles migrated towards the walls in a downward flow, as predicted by the Saffman effect (Zhu et al. Reference Zhu, Yu, Shao and Deng2020). Fornari et al. (Reference Fornari, Formenti, Picano and Brandt2016a) showed that the neutrally buoyant particles with
 $\unicode[STIX]{x1D70C}_{r}=2.0$ did not migrate laterally, as for the case of
 $\unicode[STIX]{x1D70C}_{r}=1.0$, although pronounced migration towards the channel centre was observed for
 $\unicode[STIX]{x1D70C}_{r}=10.0$ (Fornari et al. Reference Fornari, Formenti, Picano and Brandt2016a; Yu et al. Reference Yu, Lin, Shao and Wang2017). We believe that the Saffman effect is responsible for the particle migration towards the channel centre here, since the effects of the turbulence (via the drag force) and particle inertia cannot cause the particle migration behaviour observed here.
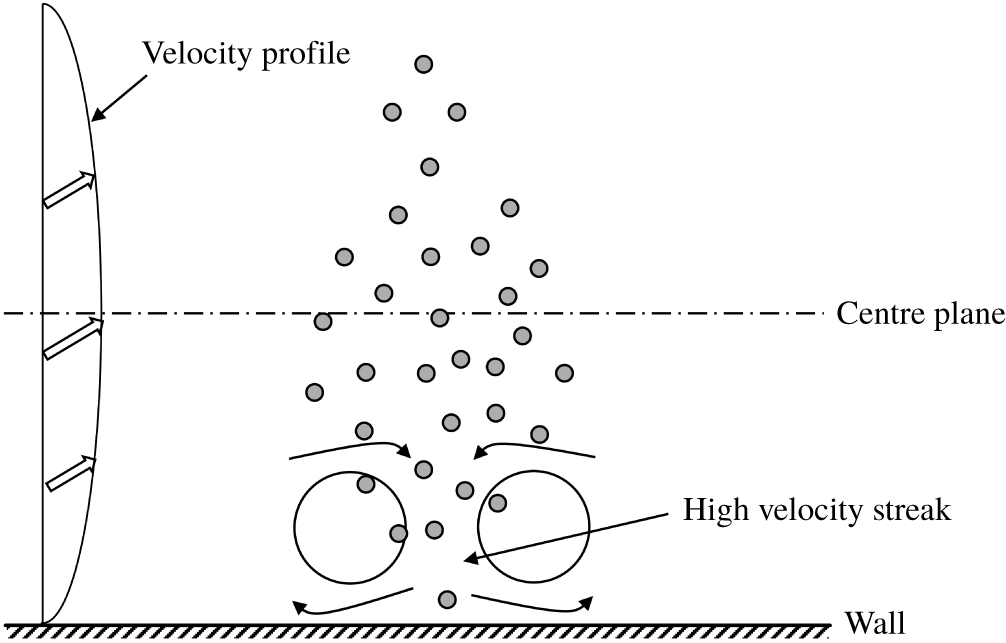
Schematic diagram explaining why particles are distributed preferentially in high-speed streaks in a vertical channel. The arrows represent the flow direction (i.e. streamwise direction).

Now, we attempt to explain why heavy particles are distributed preferentially in high-speed streaks in an upward channel flow. It was observed that the particles in the bottom half-channel moved more slowly than the fluid on average, while they were faster in the upper half-channel for the turbulent channel flow in a horizontal channel (Shao et al. Reference Shao, Wu and Yu2012). Shao et al. (Reference Shao, Wu and Yu2012) argued that if the particle volume fraction decreases with increasing distance away from the wall in a half-channel, the particles tend to be located in the low-speed streaks, and if it increases with increasing distance away from the wall, the particles tend to be located in the high-speed streaks, due to the entrainment effect on the particles by the streamwise vortex pairs. Here, in the upflow vertical channel, the particle volume fraction in the near-wall region is lower than in the bulk region (see figure 8) and consequently the particles are more likely located in the high-speed region, since the number of the particles entrained into the high-speed region by the large-scale vortex pair is higher than that of the particles entrained out of the high-speed region, as sketched in figure 7. The particle concentration distribution for  $u_{s}=0.3$ is more inhomogeneous than for
 $u_{s}=0.1$ (figure 8), and this explains why the particles have a stronger preferential distribution in the high-speed steaks for
 $u_{s}=0.3$, which leads to a higher particle mean velocity for
 $u_{s}=0.3$, compared to
 $u_{s}=0.1$, as observed in figure 4(a).
Distribution of the particle volume fraction across the channel.

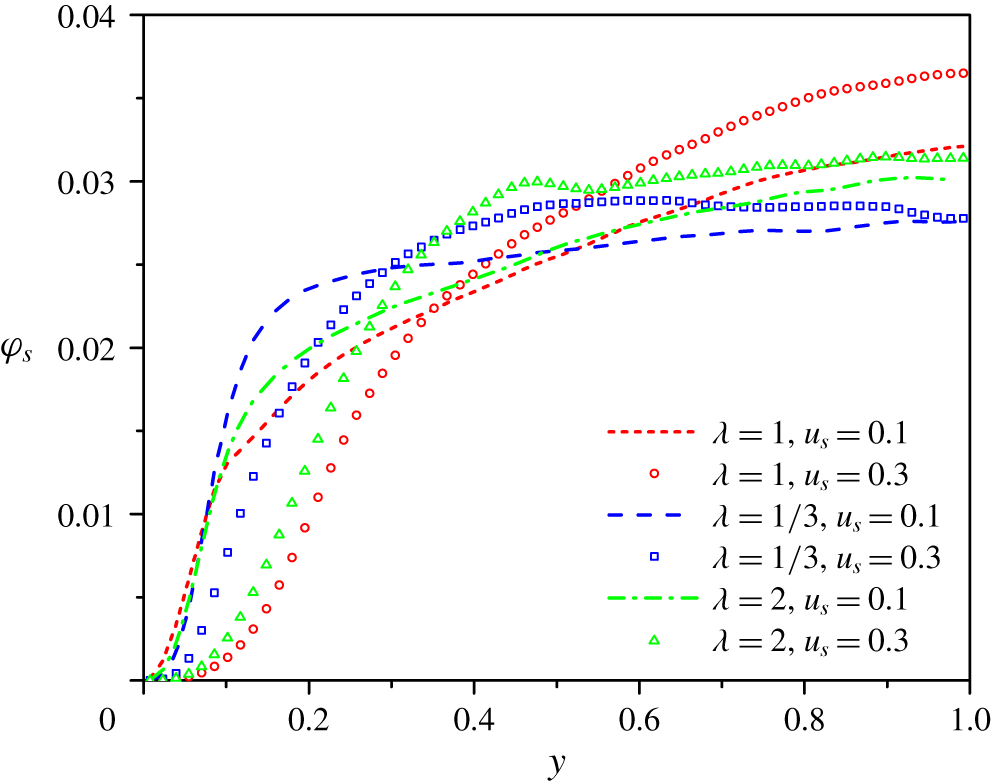
From figure 8, the migration towards the channel centre is most pronounced for the spherical particles and weakest for the oblate particles for both settling coefficients. However, for  $u_{s}=0.1$, the particle volume fraction in the near-wall region of
 $y<0.05H$ is largest for the sphere case and smallest for the oblate case, which is opposite to the observation in the bulk region, but similar to the neutrally buoyant case (Zhu et al. Reference Zhu, Yu and Shao2018). The larger concentration near the wall for the neutrally buoyant spherical particles was regarded as a primary reason for the larger flow friction in this case, compared to the non-spherical particle case (Ardekani et al. Reference Ardekani, Costa, Breugem, Picano and Brandt2017). The stronger migration of the spherical particles settling in an upflow may be related to two factors. One is the direct effect of the particle shape: the settling non-spherical particles tend to align their long axes with the streamwise direction in the near-wall region, and perpendicular to the streamwise direction in the bulk region, as shown later in figures 10 and 11, and their spanwise rotation rates are reduced, as shown by Ardekani et al. (Reference Ardekani, Costa, Breugem, Picano and Brandt2017) for the neutrally buoyant case. The effect of the particle rotation on the Saffman force is complicated. Yu et al. (Reference Yu, Phan-Thien and Tanner2004) observed that the sphere rotation produced enhanced lift forces pointing towards the pipe axis in the neutrally buoyant and downflow cases for laminar pipe flow, whereas it had a negligible effect on the migration of the sphere in laminar upward pipe flow. The effect of the particle shape on the lift force for laminar flow has not been investigated, to our knowledge. The other factor is the indirect effect of the particle shape: the large-scale vortices are weakened more significantly by the spherical particles, particularly for
 $u_{s}=0.3$ (figures 3 and 13), and consequently, the diffusion effect of the turbulence on the particle distribution that tends to flatten the particle concentration distribution profile is weaker for spherical particles. In figure 8, the particle concentration distribution profiles for the non-spherical particles in the bulk region are much flatter than those for the spherical particles. Considering that the turbulence intensities are comparable for three types of particles for
 $u_{s}=0.1$ (figure 3) but the difference in the particle volume fraction profile in this case is still pronounced, both direct and indirect effects of the particle shape are expected to be important to the particle migration.
Profiles of the r.m.s. velocity and Reynolds shear stress for the particle phase: (a) streamwise  $u_{prms}$, (b) wall normal
 $v_{prms}$, (c) spanwise
 $w_{prms}$, (d) Reynolds stress
 $-\langle u_{p}^{\prime }v_{p}^{\prime }\rangle$.

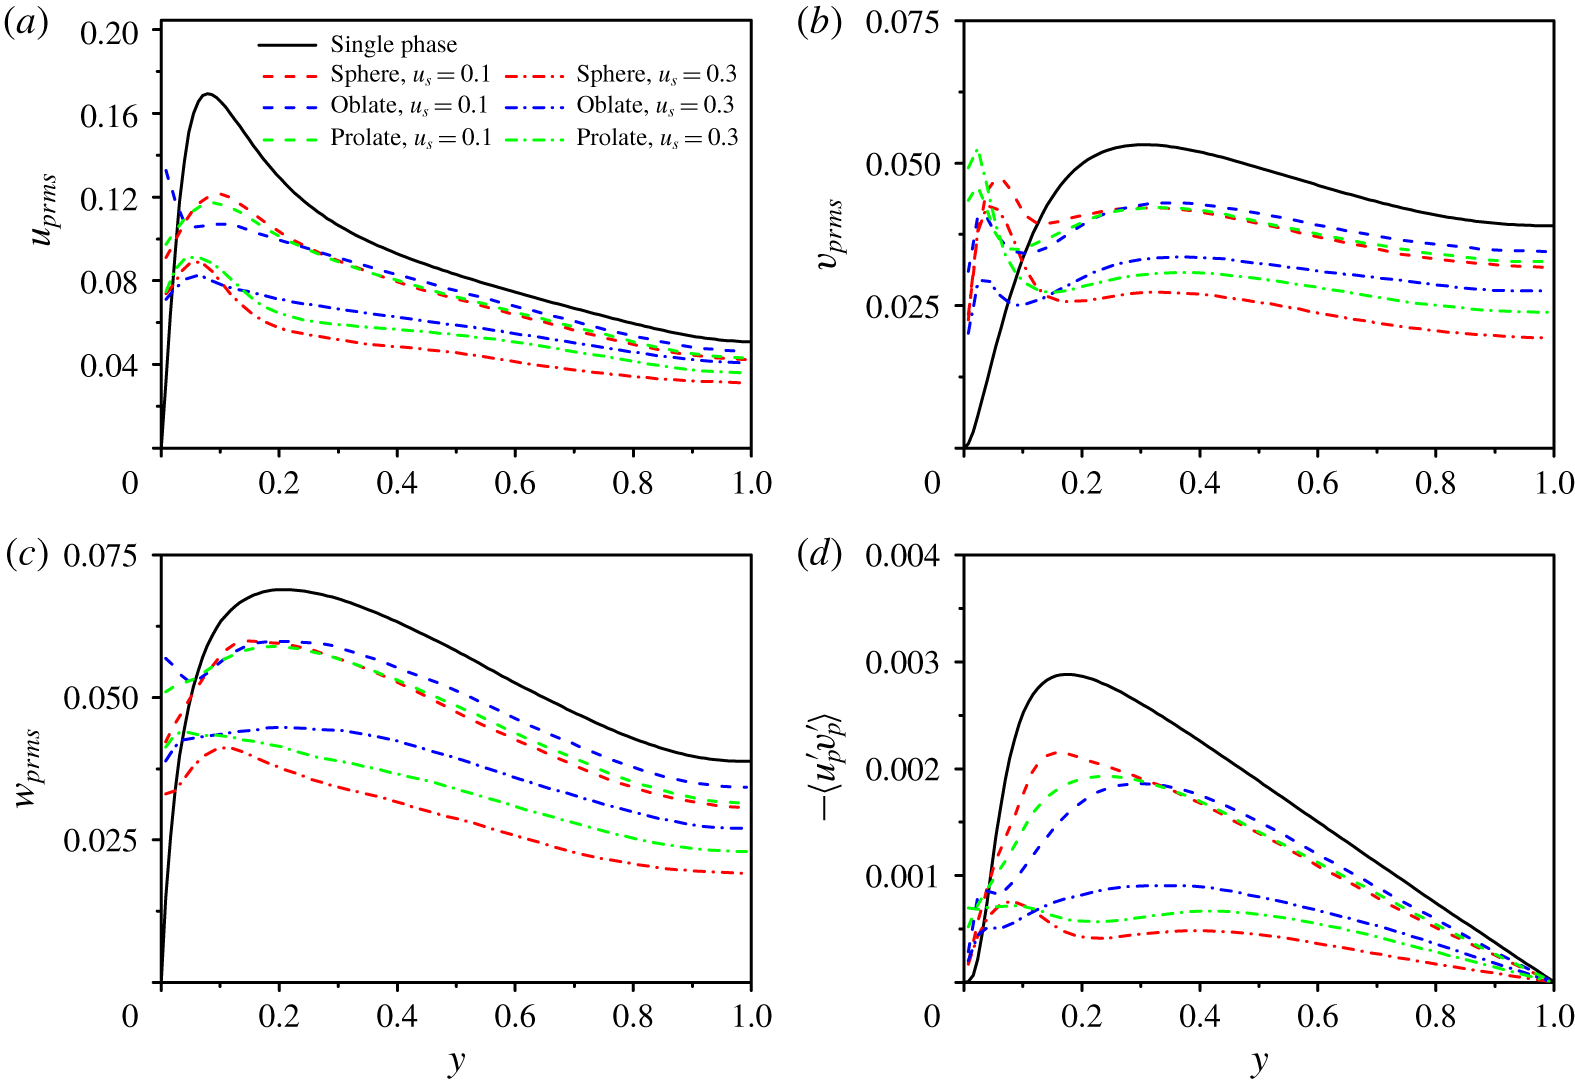
The solid-phase r.m.s. velocities and kinematic Reynolds shear stresses (here meaning  $-\langle u_{p}^{\prime }v_{p}^{\prime }\rangle$ without the density) for all cases are plotted in figure 9. The intensity of the solid-phase velocity fluctuation generally decreases with increasing particle settling coefficient, similar to the fluid velocity fluctuation. The solid-phase r.m.s. velocities are larger than those of the fluid in the near-wall region due to the collision between the particles and the wall. For the same settling coefficient, the particle-phase r.m.s. velocities in the bulk region for the oblate case is largest, consistent with the results of the fluid r.m.s. velocities in figure 3.
3.3 Particle orientation and rotation
Probability density functions (PDFs) of the particle orientation in the near-wall region (a,c,e) and the central region (b,d,f) of the channel: (a)  $\cos \unicode[STIX]{x1D6FC}$, (b)
 $|\text{cos}\unicode[STIX]{x1D6FC}|$, (c)
 $|\text{cos}\unicode[STIX]{x1D6FD}|$, (d)
 $|\text{cos}\unicode[STIX]{x1D6FD}|$, (e)
 $|\text{cos}\unicode[STIX]{x1D6FE}|$ and (f)
 $|\text{cos}\unicode[STIX]{x1D6FE}|$.

The orientation of a spheroidal particle is measured with the direction cosines ( $|\text{cos}\,\unicode[STIX]{x1D6FC}|$,
 $|\text{cos}\,\unicode[STIX]{x1D6FD}|$,
 $|\text{cos}\,\unicode[STIX]{x1D6FE}|$), where
 $\unicode[STIX]{x1D6FC}$,
 $\unicode[STIX]{x1D6FD}$,
 $\unicode[STIX]{x1D6FE}$ represent the angles between the particle symmetry axis and the streamwise, wall-normal and spanwise directions, respectively. Figure 10 shows the probability density functions (PDFs) of the direction cosines (
 $\cos \unicode[STIX]{x1D6FC}$,
 $|\text{cos}\,\unicode[STIX]{x1D6FD}|$,
 $|\text{cos}\,\unicode[STIX]{x1D6FE}|$) in the near-wall region of
 $y<2a_{e}$ (i.e.
 $0.1H$) and (
 $|\text{cos}\,\unicode[STIX]{x1D6FC}|$,
 $|\text{cos}\,\unicode[STIX]{x1D6FD}|$,
 $|\text{cos}\,\unicode[STIX]{x1D6FE}|$) in the central region of the channel (the distance away from the centre plane being smaller than
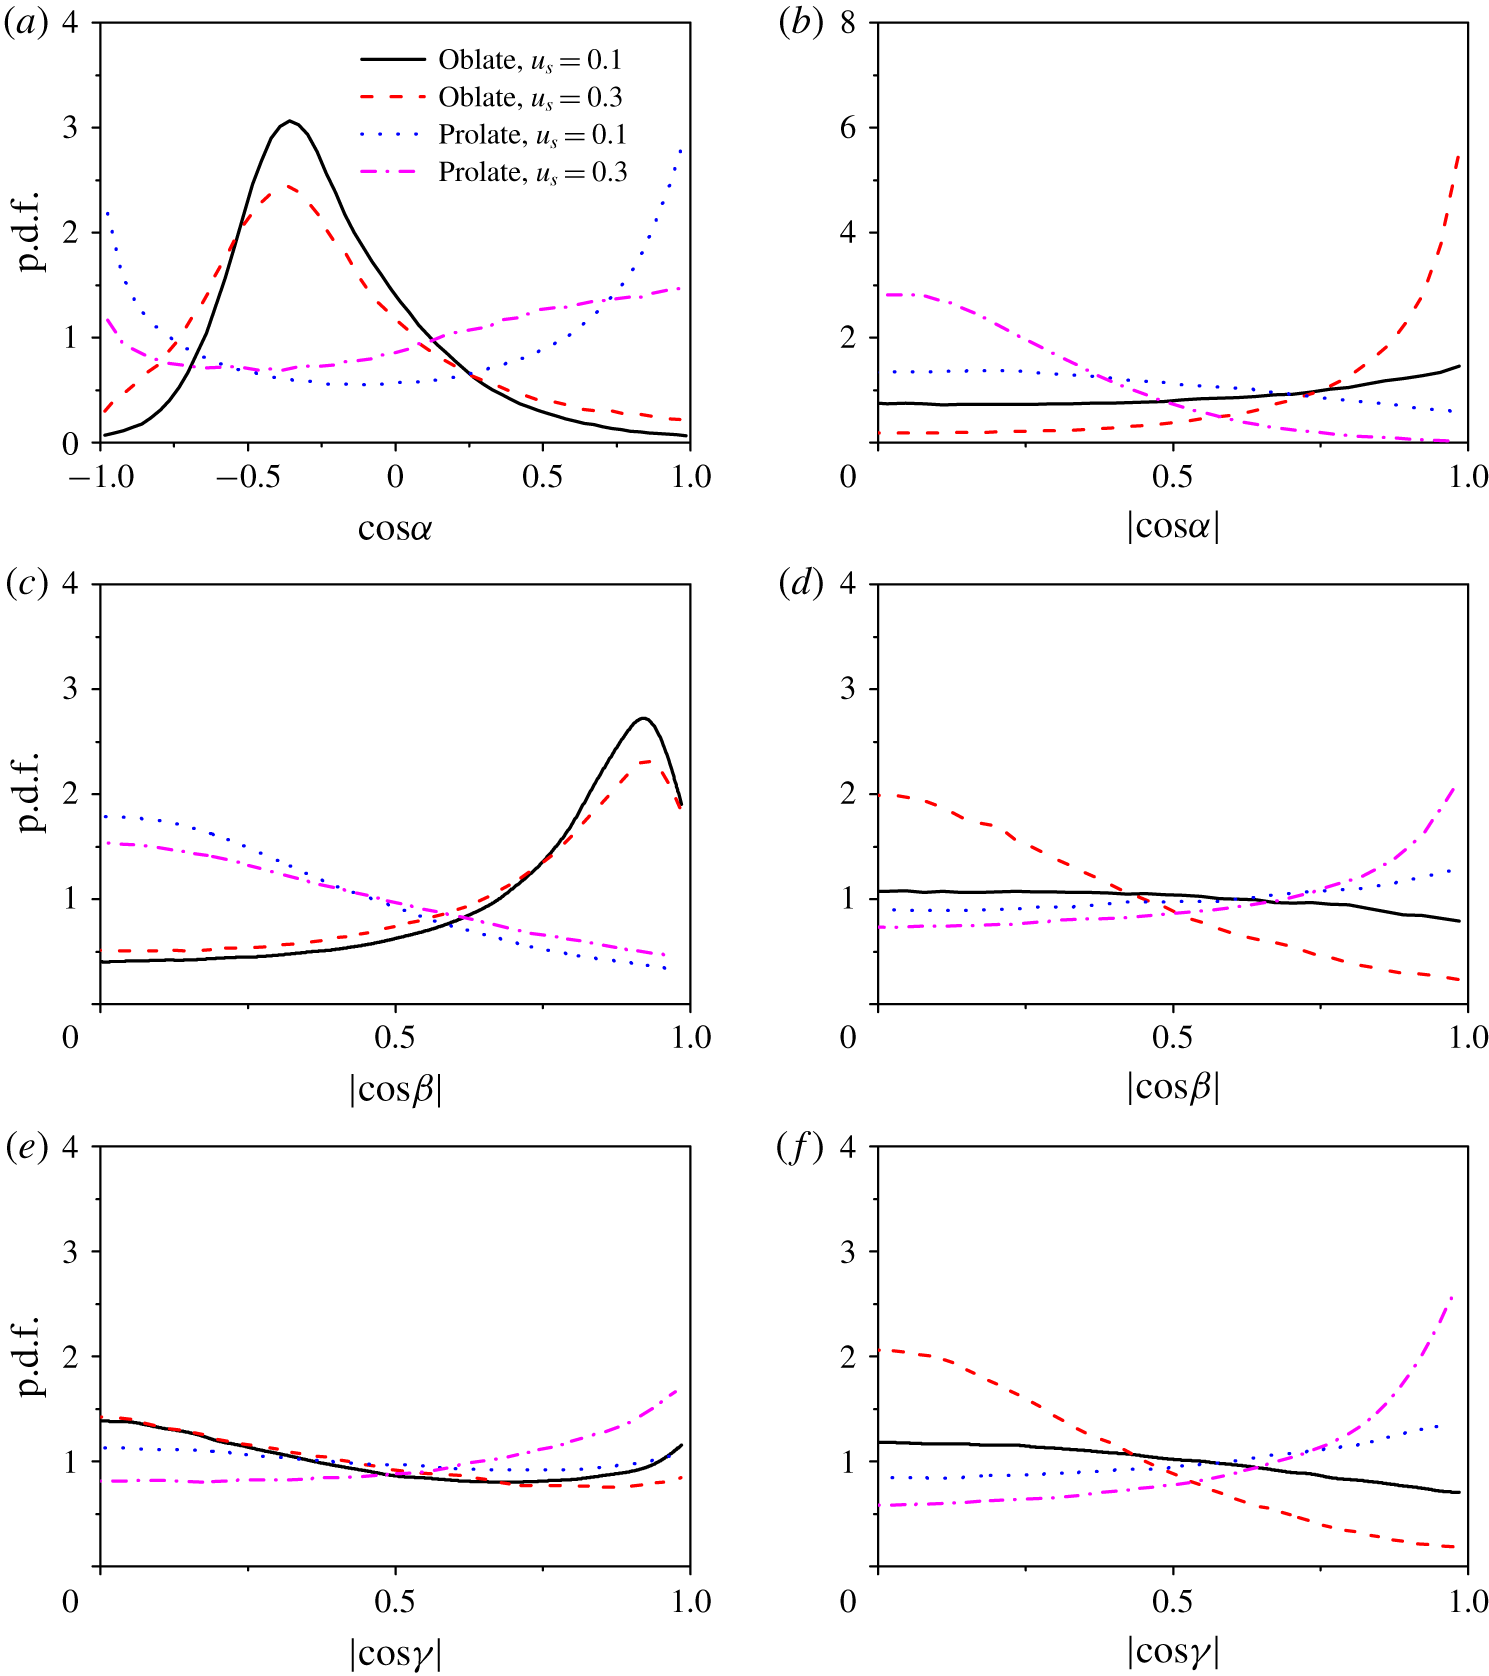
 $0.1H$). From figure 10(a,c,e), for the near-wall region, the orientation behaviour of the spheroidal particles settling in an upward vertical channel flow is similar to the neutrally buoyant case. Figure 10(a) shows that the most probable
 $\cos \unicode[STIX]{x1D6FC}$ for the oblate particles in the near-wall region is approximately
 $-0.35$, corresponding to
 $\unicode[STIX]{x1D6FC}\approx 110^{\circ }$. Note that
 $\unicode[STIX]{x1D6FC}$ is defined in the interval of
 $(0,180^{\circ })$. In other words, the symmetry axis is defined as always pointing away from the channel wall. Our result implies that the most probable orientation of the long (major) axis of the oblate particles is not exactly the streamwise direction, but has an inclination angle of approximately
 $20^{\circ }$ with the streamwise direction, as observed in the neutrally buoyant case (Zhu et al. Reference Zhu, Yu and Shao2018). From figure 10(a), the most probable orientation of the prolate particles is close to the streamwise direction, with the PDF of a positive inclination angle being larger than that of a negative inclination angle. Figure 10(b) shows that the oblate particles tend to align their symmetry axes with the wall-normal direction (with a deviation of approximately
 $20^{\circ }$). The sedimentation effect attenuates the preference of the orientation and makes the orientation more isotropic for particles near the wall, as shown in figure 10(a,c,e).
For the channel centre region, the orientation of the spheroidal particles is almost isotropic for  $u_{s}=0.1$, as shown in figure 10(b,d,f) and observed in the neutrally buoyant case (Mortensen et al. Reference Mortensen, Andersson, Gillissen and Boersma2008b; Zhu et al. Reference Zhu, Yu and Shao2018). However, for
 $u_{s}=0.3$, the sedimentation effect results in a preferential orientation: the spheroids tend to align their long axes perpendicular to the streamwise direction, with almost isotropic projected orientation in the transverse–spanwise (i.e.
 $y$–
 $z$) plane, as indicated by the peak of the p.d.f. of
 $|\text{cos}\,\unicode[STIX]{x1D6FC}|$ occurring at
 $|\text{cos}\,\unicode[STIX]{x1D6FC}|=1$ in figure 10(b) and largely the same p.d.f. for
 $|\text{cos}\,\unicode[STIX]{x1D6FD}|$ and
 $|\text{cos}\,\unicode[STIX]{x1D6FE}|$ in figure 10(d,f). It has been recognized that a non-spherical particle settling in a Newtonian fluid turns its broad side perpendicular to the settling direction due to the fluid inertial effect (Huang et al. Reference Huang, Feng and Joseph1994). As mentioned earlier, the particle Reynolds number based on the slip velocity is
 $Re_{p}=14.7$ for
 $u_{s}=0.1$, and
 $Re_{p}=32.6$ for
 $u_{s}=0.3$. Our results indicate that the fluid inertial effect on the particle orientation is overshadowed by the turbulence effect at
 $Re_{p}=14.7$ and prevails over the turbulence effect at
 $Re_{p}=32.6$ in the bulk region.
Side view of the snapshots of particles in the left half-channel: (a) spheres ( $u_{s}=0.1$), (b) spheres (
 $u_{s}=0.3$), (c) oblate particles (
 $u_{s}=0.1$), (d) oblate particles (
 $u_{s}=0.3$), (e) prolate particles (
 $u_{s}=0.1$) and (f) prolate particles (
 $u_{s}=0.3$).

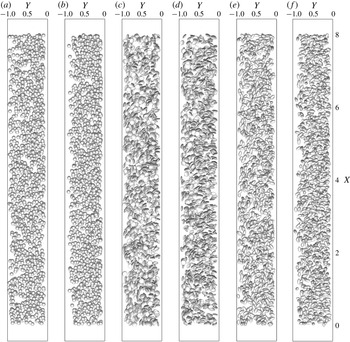
The snapshots of particles in the lower half-channel are shown in figure 11. Figure 11 provides the direct evidence for the results presented above. It can be seen that the particle settling effect drives the particles away from the wall at  $u_{s}=0.3$, particularly for the sphere case. The spheroids tend to align their long axes with the streamwise direction, and the oblate particles tend to align their symmetry axes with the wall-normal direction, with a positive preferential inclination angle between the long axis and the streamwise direction in the vicinity of the wall. In the bulk region, the settling effect causes the particles to turn their long axes perpendicular to the streamwise direction, which is more pronounced for a higher settling coefficient.
Particle mean rotation rates: (a) tumbling components and (b) spinning components. The insets show close ups for  $y>0.2H$.

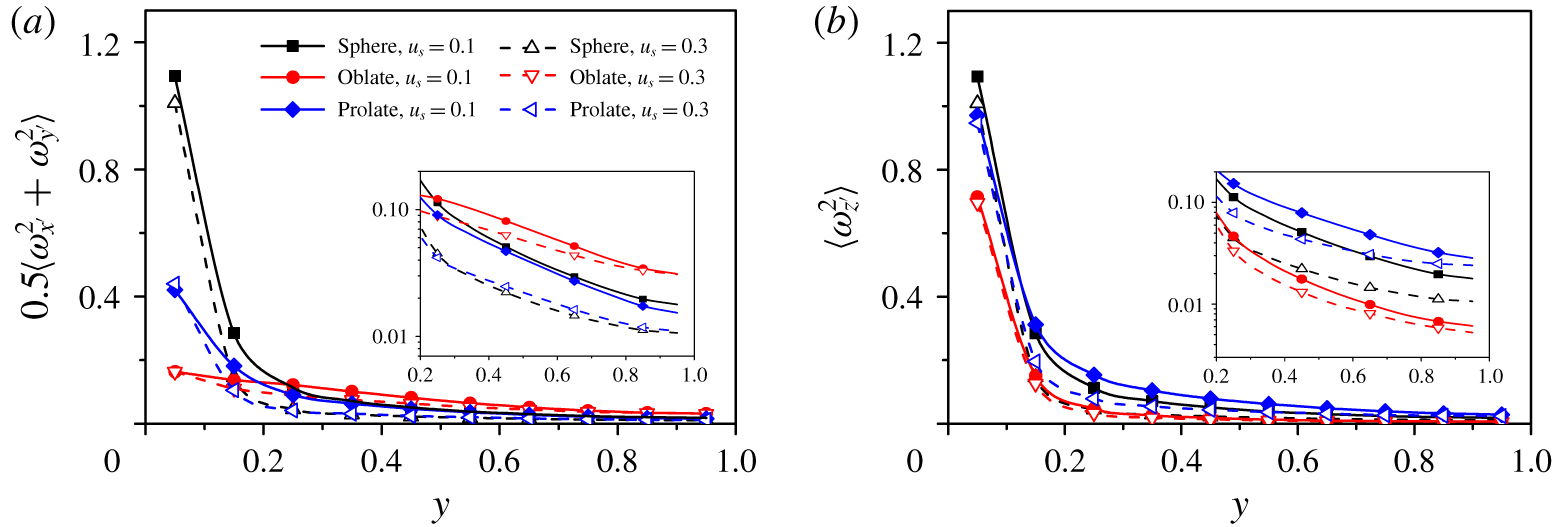
We decompose the particle rotation rate ( $\langle \unicode[STIX]{x1D714}_{i^{\prime }}\unicode[STIX]{x1D714}_{i^{\prime }}\rangle$) into the spinning and tumbling components. The spinning component represents the rotation about the symmetry axis, defined as
 $\langle \unicode[STIX]{x1D714}_{z^{\prime }}\unicode[STIX]{x1D714}_{z^{\prime }}\rangle$, and the tumbling component represents the rotation about the other two axes, defined as
 $0.5(\langle \unicode[STIX]{x1D714}_{x^{\prime }}\unicode[STIX]{x1D714}_{x^{\prime }}\rangle +\langle \unicode[STIX]{x1D714}_{y^{\prime }}\unicode[STIX]{x1D714}_{y^{\prime }}\rangle )$, where
 $z^{\prime }$ denotes the symmetry axis, and
 $x^{\prime }$ and
 $y^{\prime }$ the other two axes in the body-fixed frame (Zhu et al. Reference Zhu, Yu and Shao2018). Figure 12 shows the particle mean tumbling and spinning velocities. The orientation and rotation rates of the spherical particles are computed with the same method for the non-spherical particles, after the body-fixed frame is established arbitrarily at the initial time. Due to the isotropic shape, the mean tumbling velocity of the spheres is nearly the same as the spinning velocity in figure 12. The results in figure 12 show that the prolate particles have higher spinning velocities and lower tumbling velocities in the bulk region, compared to the oblate particles, as in the neutrally buoyant case (Zhu et al. Reference Zhu, Yu and Shao2018). This was explained by the preferential alignment of the particle long axis with the local fluid vorticity direction for the point-particle case (Zhao et al. Reference Zhao, Challabotla, Andersson and Variano2015b). It is observed in the insets of figure 12 that the particle settling effect reduces both the spinning and tumbling rates of all three types of particles.
3.4 Vortex structure
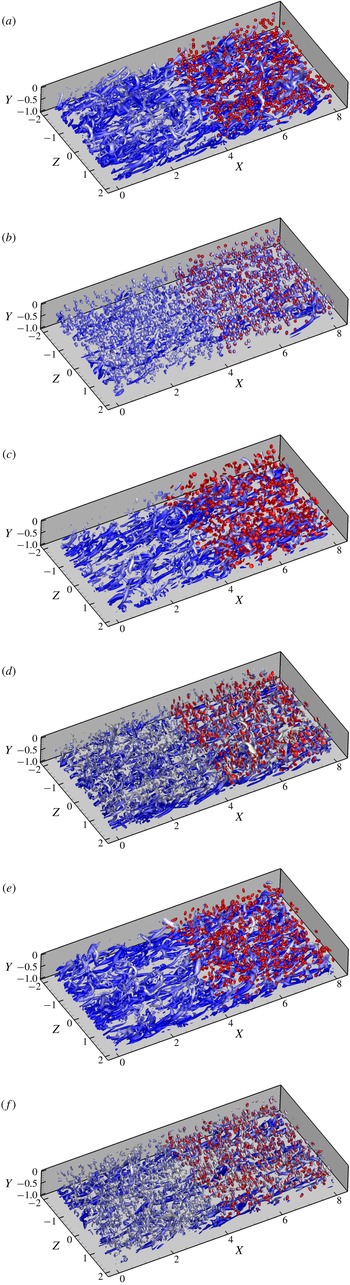
Vortex structures of the particle-laden vertical channel flows for: (a) spheres ( $u_{s}=0.1$), (b) spheres (
 $u_{s}=0.3$), (c) oblate particles (
 $u_{s}=0.1$), (d) oblate particles (
 $u_{s}=0.3$), (e) prolate particles (
 $u_{s}=0.1$) and (f) prolate particles (
 $u_{s}=0.3$). The colour of the vortices represents the fluid streamwise velocity and the brighter means a larger streamwise velocity. The particles in a half-domain are shown.

Figure 13 shows the typical vortex structures in the lower half-channel, identified with the  $Q$ criterion (
 $Q=1$) defined by Hunt, Wray & Moin (Reference Hunt, Wray and Moin1988),
 $$\begin{eqnarray}Q={\textstyle \frac{1}{2}}(\unicode[STIX]{x1D6FA}_{ij}\unicode[STIX]{x1D6FA}_{ij}-\unicode[STIX]{x1D61A}_{ij}\unicode[STIX]{x1D61A}_{ij}),\end{eqnarray}$$
where  $\unicode[STIX]{x1D6FA}_{ij}=(u_{i,j}-u_{j,i})/2$ and
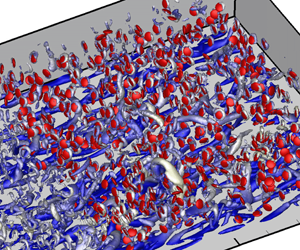
 $\unicode[STIX]{x1D61A}_{ij}=(u_{i,j}+u_{j,i})/2$ are respectively the rotation rate tensor and the strain rate tensor. From figure 13, the particles induce vortex rings around them at
 $u_{s}=0.3$. It is known that flow separation occurs at the critical Reynolds number of approximately 20 for flow over a sphere (Chang & Maxey Reference Chang and Maxey1994). For
 $u_{s}=0.1$, the particle Reynolds number is 14.7 and there is no flow separation. This may explain why no particle-induced vortex structures are identified with
 $Q=1$ in the bulk region for
 $u_{s}=0.1$ in figure 13 and the effect of the particles on the turbulent channel flow is relatively weak, as observed earlier for the fluid statistics (figures 2 and 3). The large-scale vortices are not significantly weakened by the particles for
 $u_{s}=0.1$, as shown in figure 13(a,c,e). By contrast, the large-scale vortices are suppressed significantly in the spherical and prolate cases for
 $u_{s}=0.3$, from the comparison between figure 13(a,b), and comparison between figure 13(e,f). The comparison of figure 13(b,d,f) shows that the particle-induced vortices are strongest for the spherical particles, and weakest for the oblate particles in the bulk region at
 $u_{s}=0.3$. The reason should be that the preferential orientation of non-spherical particles with their long axes perpendicular to the settling direction reduces their settling velocity, as shown in figure 4(b). The oblate particles for
 $\unicode[STIX]{x1D706}=1/3$ have a largest upwinding area when settling, and thus the slip velocity is smallest, compared to the spherical particles and the prolate particles of
 $\unicode[STIX]{x1D706}=2$. The particle-induced vortices should be responsible for the suppression of the large-scale vortices.
3.5 Flow friction and total drag
In this subsection, we will explore the reasons for the effects of the particles on the friction drag. Based on the spatial averaging theorem, the mean momentum equation of turbulent channel flow can be derived as below (Picano et al. Reference Picano, Breugem and Brandt2015; Yu et al. Reference Yu, Lin, Shao and Wang2017)
 $$\begin{eqnarray}\displaystyle & & \displaystyle \frac{\text{d}}{\text{d}y}(\unicode[STIX]{x1D711}_{f}\langle \unicode[STIX]{x1D70E}_{f}\rangle _{xy}+\unicode[STIX]{x1D711}_{s}\langle \unicode[STIX]{x1D70E}_{s}\rangle _{xy})+\left(-\frac{\text{d}p_{e}}{\text{d}x}\right)\nonumber\\ \displaystyle & & \displaystyle \quad +\,\frac{\text{d}}{\text{d}y}(\unicode[STIX]{x1D711}_{f}\unicode[STIX]{x1D70C}_{f}\langle -u_{f}^{\prime }v_{f}^{\prime }\rangle +\unicode[STIX]{x1D711}_{s}\unicode[STIX]{x1D70C}_{s}\langle -u_{s}^{\prime }v_{s}^{\prime }\rangle )-\unicode[STIX]{x1D711}_{s}(\unicode[STIX]{x1D70C}_{r}-\unicode[STIX]{x1D70C}_{f})g=0,\end{eqnarray}$$
where  $u$ and
 $v$ are the local velocity components in the
 $x$ and
 $y$ directions, respectively, with the subscript ‘
 $f$’ meaning the fluid phase and ‘
 $s$’ meaning the solid phase;
 $\unicode[STIX]{x1D70E}_{s}$ is the solid inner stress,
 $g$ is the gravity,
 $\unicode[STIX]{x1D711}_{f}$ and
 $\unicode[STIX]{x1D711}_{s}$ are the fluid and solid volume fractions at a given
 $y$ position and
 $-\text{d}p_{e}/\text{d}x$ denotes the pressure gradient. Note that, here, the particle Reynolds stress means the solid-phase Reynolds stress; namely, the velocities at the Eulerian grids inside the particle boundaries rather than the particle translational velocities are used for the computation of the particle Reynolds stress. For the two-phase upward vertical channel flow, the relationship between
 $p_{e}$ and
 $\unicode[STIX]{x1D70F}_{w}$ is
 $-\text{d}p_{e}/\text{d}x=\unicode[STIX]{x1D70F}_{w}/H+\unicode[STIX]{x1D711}_{0}(\unicode[STIX]{x1D70C}_{s}-\unicode[STIX]{x1D70C}_{f})g$. Equation (3.2) can be rewritten as follows:
 $$\begin{eqnarray}\displaystyle -\frac{\unicode[STIX]{x1D70F}_{w}}{H} & = & \displaystyle \frac{\text{d}}{\text{d}y}(\unicode[STIX]{x1D711}_{f}\langle \unicode[STIX]{x1D70E}_{f}\rangle _{xy}+\unicode[STIX]{x1D711}_{s}\langle \unicode[STIX]{x1D70E}_{s}\rangle _{xy})+(\unicode[STIX]{x1D711}_{0}-\unicode[STIX]{x1D711}_{s})(\unicode[STIX]{x1D70C}_{r}-\unicode[STIX]{x1D70C}_{f})g\nonumber\\ \displaystyle & & \displaystyle +\,\frac{\text{d}}{\text{d}y}(\unicode[STIX]{x1D711}_{f}\unicode[STIX]{x1D70C}_{f}\langle -u_{f}^{\prime }v_{f}^{\prime }\rangle +\unicode[STIX]{x1D711}_{s}\unicode[STIX]{x1D70C}_{s}\langle -u_{s}^{\prime }v_{s}^{\prime }\rangle ).\end{eqnarray}$$
The contributions of different stresses to the friction coefficient can be obtained by applying triple integration (Fukagata, Iwamoto & Kasagi Reference Fukagata, Iwamoto and Kasagi2002), i.e.  $\int _{0}^{1}\text{d}y\int _{0}^{y}\text{d}y\int _{0}^{y}\text{d}y$, to (3.3):
 $$\begin{eqnarray}\displaystyle C_{f} & = & \displaystyle \underbrace{\frac{6}{Re_{b}}\int _{0}^{1}(1-y)\unicode[STIX]{x1D711}_{f}\left(\frac{\text{d}u^{\ast }}{\text{d}y}\right)\text{d}y}_{C_{fv}}+\underbrace{6\int _{0}^{1}(1-y)(\unicode[STIX]{x1D711}_{f}\langle -u_{f}^{\ast \prime }u_{f}^{\ast \prime }\rangle )\,\text{d}y}_{C_{fR}}\nonumber\\ \displaystyle & & \displaystyle +\,\underbrace{6\int _{0}^{1}(1-y)\frac{\unicode[STIX]{x1D711}_{s}}{\unicode[STIX]{x1D70C}_{f}u_{b}^{2}}\langle \unicode[STIX]{x1D70E}_{s}\rangle _{xy}\,\text{d}y}_{C_{pI}}+\underbrace{6\int _{0}^{1}(1-y)(\unicode[STIX]{x1D711}_{s}\unicode[STIX]{x1D70C}_{r}\langle -u_{s}^{\ast \prime }u_{s}^{\ast \prime }\rangle )\,\text{d}y}_{C_{pR}}\nonumber\\ \displaystyle & & \displaystyle +\,\underbrace{\left(-3\int _{0}^{1}(1-y)^{2}(\unicode[STIX]{x1D711}_{s}-\unicode[STIX]{x1D711}_{0})(\unicode[STIX]{x1D70C}_{r}-1)Fr\,\text{d}y\right)}_{C_{g}},\end{eqnarray}$$
where  $C_{f}$ is the friction coefficient defined by
 $C_{f}=2\unicode[STIX]{x1D70F}_{w}/\unicode[STIX]{x1D70C}_{f}u_{b}^{2}$, and
 $y$ is the dimensionless coordinate normalized with
 $H$, with the wall position shifted to
 $y=0$;
 $u^{\ast }$ and
 $v^{\ast }$ denote the dimensionless velocities normalized by
 $u_{b}$, and
 $Fr$ represents the Froude number defined by
 $Fr=gH/u_{b}^{2}$. We define the terms of the fluid viscous stress, the fluid Reynolds stress, the particle inner stress, the particle Reynolds stress and gravity in (3.4) as
 $C_{fV}$,
 $C_{fR}$,
 $C_{pi}$,
 $C_{pR}$ and
 $C_{g}$, respectively. To derive (3.4), the following relations are used:
 $$\begin{eqnarray}\displaystyle & \displaystyle (\unicode[STIX]{x1D719}_{f}\langle \unicode[STIX]{x1D70E}_{f}\rangle _{xy}+\unicode[STIX]{x1D719}_{s}\langle \unicode[STIX]{x1D70E}_{s}\rangle _{xy})|_{y=0}=\unicode[STIX]{x1D70F}_{w} & \displaystyle\end{eqnarray}$$
 $$\begin{eqnarray}\displaystyle & \displaystyle \int _{0}^{1}\int _{0}^{y}f\,\text{d}y\,\text{d}y=\int _{0}^{1}(1-y)f\,\text{d}y;\int _{0}^{1}\int _{0}^{y}\int _{0}^{y}f\,\text{d}y\,\text{d}y\,\text{d}y=\frac{1}{2}\int _{0}^{1}(1-y)^{2}f\,\text{d}y. & \displaystyle\end{eqnarray}$$
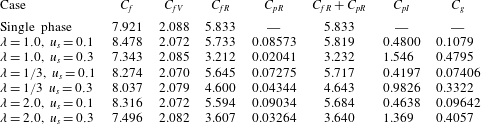
The contributions of the different stresses in (3.4) are presented in table 3. For the neutrally buoyant case, the smaller flow friction for the non-spherical particles is primarily caused by the significantly reduced contribution from the particle inner stress, compared to the spherical particles (Ardekani et al. Reference Ardekani, Costa, Breugem, Picano and Brandt2017; Zhu et al. Reference Zhu, Yu and Shao2018). The drag reduction by the non-spherical particles compared to the single-phase flow is due to the reductions in the contributions from both particle inner stress and total Reynolds stress (Ardekani et al. Reference Ardekani, Costa, Breugem, Picano and Brandt2017; Eshghinejadfard et al. Reference Eshghinejadfard, Zhao and Thévenin2018; Zhu et al. Reference Zhu, Yu and Shao2018; Ardekani & Brandt Reference Ardekani and Brandt2019). For  $u_{s}=0.1$ here, the reason for the smaller flow friction of the non-spherical particles compared to the spherical particles is due to the reductions in the particle inner stress, total Reynolds stress and gravity term, as shown in table 3. However, drag reduction by the non-spherical particles does not occur, because the reduction in the Reynolds stress is smaller than the extra contribution from the particle inner stress and gravity term, compared to single-phase flow. The particle inner stress is expected to be increased by the particle settling effect, because the drag on the particles is enhanced due to the increase in the slip velocity. The contribution of the particle inner stress becomes significantly larger, as
 $u_{s}$ is increased from 0.1 to 0.3. Nevertheless, the particle sedimentation effect at
 $u_{s}=0.3$ attenuates greatly the turbulence (figure 13) and gives rise to the substantial reduction in the fluid Reynolds stress, resulting in the reduction in the flow friction, particularly for the spherical and prolate particles, as shown in table 3.
Contributions of the different stresses in (3.4) to the  $C_{f}$ (the data unit is
 $\times 10^{-3}$).

From table 3, the flow frictions for the spherical and prolate particles at  $u_{s}=0.3$ are smaller than that of the single-phase flow, but this does not mean drag reduction, since the flow drag is normally measured by the pressure drop at the same flow rate. For the upward vertical channel flow studied, the pressure drop is the sum of the flow friction and the buoyant force on the particles, and the relation is:
 $-\text{d}p_{e}/\text{d}x=\unicode[STIX]{x1D70F}_{w}/H+\unicode[STIX]{x1D711}_{0}(\unicode[STIX]{x1D70C}_{s}-\unicode[STIX]{x1D70C}_{f})g$. The pressure gradients for all cases are presented in table 4. Although the particle volume fraction (
 $2.36\,\%$) and the settling coefficient are not large, the buoyant force on the particles is comparable to the flow friction for
 $u_{s}=0.3$, and thus the particle sedimentation effect does not cause drag reduction. However, it is still interesting that the sedimentation effect can lead to the transition of the flow drag of the spherical particles from being larger to being smaller than that of the non-spherical particles, as the settling coefficient increases.
Pressure gradients and friction Reynolds numbers for the seven cases listed in table 1 ( $(-\text{d}p_{e})/(\text{d}x)$,
 $\unicode[STIX]{x1D70F}_{w}/H$ and
 $\unicode[STIX]{x1D711}_{0}(\unicode[STIX]{x1D70C}_{s}-\unicode[STIX]{x1D70C}_{f})g$ are normalized by
 $\unicode[STIX]{x1D70C}_{f}u_{b}^{2}/H$ and the data unit is
 $\times 10^{-3}$).

4 Conclusions
The upward vertical turbulent channel flow laden with finite-size spheroidal particles has been numerically simulated with a direct-forcing fictitious domain method. The effects of the particles on the fluid mean velocity, r.m.s. velocities and vortex structures, and the properties of the particle velocities, concentration distribution, orientation and rotation rate are investigated at the bulk Reynolds number 2873, the particle volume fraction  $2.36\,\%$, particle aspect ratios
 $1/3$, 1 and 2 and settling coefficients
 $u_{s}=0.1$ and 0.3. From our results, the following conclusions can be drawn:
(i) For a weak particle sedimentation effect (
 $u_{s}=0.1$), the flow friction is largest for the spherical particles, and smallest for the oblate particles, whereas for a moderate particle sedimentation effect ($u_{s}=0.3$) the flow friction is smallest for the spherical particles, and largest for oblate particles. The reason for the lower flow friction of the non-spherical particles at $u_{s}=0.1$ is due to the smaller contributions from the Reynolds stress, particle inner stress and gravity term. The reason for the lower flow friction of the spherical particles at $u_{s}=0.3$ is that the large-scale vortices are more strongly attenuated by the spherical particles than by the non-spherical particles. It is interesting that the vortices induced by the particles tend to suppress the large-scale vortices and weaken the turbulence in the upward turbulent channel flow.
(ii) The settling particles tend to migrate towards the channel centre due to the Saffman effect. Although the particle mean velocity is higher than the fluid mean velocity in the near-wall region due to the particle slip on the wall and the particle preferential concentration in high-speed streaks, the particles always lag the surrounding near-field fluid, and thus the Saffman force always points to the channel centre. The migration is strongest for the spherical particles, which may be a result of both direct and indirect effects of the particle shape. The direct effect is the effect of the particle orientation and rotation on the lift force, and the indirect effect is that the spherical particles attenuate the turbulence more significantly and therefore the diffusion effect of the turbulence on the particle concentration distribution becomes smaller, compared to the non-spherical particles.
(iii) The non-spherical particles tend to align their long axes with the streamwise direction in the near-wall region, and perpendicular to the streamwise direction in the bulk region due to the significant settling effect, which results in a smaller mean slip velocity and thereby weaker particle-induced vortices, compared to the sphere case. The particle-induced vortices appear to suppress the large-scale vortices of the turbulent channel flow.
(iv) The particle sedimentation effect makes both fluid and particle mean velocity profiles flatter. For
$u_{s}=0.3$, the fluid mean velocity profile is anomalous in that it is fatter in the bulk region but has a smaller gradient on the wall, compared to the single-phase flow. In the near-wall region, the particles lead the fluid more significantly, as the settling coefficient increases. The reason is that the particle migration towards the channel centre and the gradient in the particle volume fraction are more pronounced for a higher settling coefficient, resulting in a stronger preference of the particles located in the high-speed streaks.(v) The particle sedimentation effect reduces both spinning and tumbling velocities of the particles.


Our work reports for the first time numerical results on the interactions between finite-size spheroidal particles and a vertical turbulent channel flow for a moderate particle settling effect. Due to high computational cost and our limited computational resources, only two settling coefficients and three particle aspect ratios are considered. Investigations in a wider parameter range are required for more complete understanding of the interactions between finite-size spheroidal particles and a vertical turbulent channel flow.
Acknowledgements
The work was supported by the National Natural Science Foundation of China (grant nos 91752117, 91852204, 91852205, 11632016).
Declaration of interests
The authors report no conflict of interest.