I. INTRODUCTION
Hydrogen is recognized as an alternative to fossil fuel since it has a high heat of combustion and its by-product is water instead of carbon dioxide. However, there are no significant natural deposits of hydrogen gas; thus, the currently viable technologies for its production, like the reforming of natural gas or the use of electricity from renewable energy in the electrolysis of water, must be improved since these methods are still inefficient in terms of carbon and energy usage. Reference Crabtree, Dresselhaus and Buchanan1 Among the two methods mentioned, water-splitting via electrolysis has the potential for a low carbon emission energy cycle. Interest in the development of semiconductor photocatalysts which can absorb light and convert it to an electron–hole pair in the right energy level to catalyze the direct splitting of water has increased since hydrogen was first produced from water over titanium dioxide (TiO2) electrodes without the application of electric power. Reference Fujishima and Honda2 Strontium titanate (SrTiO3), like anatase TiO2, has band levels suitable for photocatalytic water splitting since its valence band and conduction band is lower and higher than the oxidation–reduction levels of water, respectively. But unlike TiO2, the perovskite structure of SrTiO3 facilitates for easier doping for electronic modification. Reference T Lam, de Haart, Wiersma, Blasse, Tinnemans and Mackor3,Reference Zhou, Shi and Li4
The use of inorganic semiconductor materials in the powder form instead of bulk photoanodes has been considered due to difficulties in construction, issues of stability under light, and lower surface areas of bulk photoanodes. Reference Ashokkumar5 Pure SrTiO3 powders have been shown to evolve hydrogen in the presence of sacrificial reagents that act as hole scavengers like methanol, Reference Kudo, Tanaka, Domen and Onishi6 with higher evolution rates or visible light photocatalysis achieved upon metal doping. Reference Puangpetch, Sreethawong and Chavadej7,Reference Liu, Chen, Li and Zhang8 Photocatalytic decomposition of water without the use of sacrificial agents had also been reported using nickel oxide-loaded Reference Domen, Naito, Onishi and Tamaru9,Reference Domen, Kudo, Onishi, Kosugi and Kuroda10 and platinum-loaded Reference Puangpetch, Sreethawong, Yoshikawa and Chavadej11 SrTiO3 powders. Among nanostructures, the use of a nanofiber morphology is of interest since we had previously found that anatase TiO2 nanofibers have higher hydrogen production over nanoparticles. Reference Chuangchote, Jitputti, Sagawa and Yoshikawa12 However, the preparation of homogenous SrTiO3 nanofibers has been difficult. SrTiO3 nanofibers prepared via the hydrothermal reaction of electrospun TiO2 nanofiber with strontium salts have led to heterogenous structures. Reference Macaraig, Chuangchote and Sagawa13,Reference Cao, Li, Wang, Shao and Liu14 In this report, we improved and modified the methods for preparation and photophysical characterization of pure and homogenous SrTiO3 nanofibers via the electrospinning of precursor solutions containing both the titanium and strontium salts. We likewise examined the photocatalytic performance in terms of hydrogen production rates of SrTiO3 nanofibers prepared through the electrospinning of precursor solutions with both strontium and titanium salts.
II. EXPERIMENTAL SECTION
A. Preparation of spinning solutions
SrTiO3 nanofibers were prepared with a modification from the previously reported procedure. Reference Macaraig, Chuangchote, Sagawa and Yao15 Instead of strontium acetylacetonate (SrAcAc), strontium acetate (SrAc, 1.3 g, Wako, Osaka, Japan) was used to prepare inorganic load solutions by mixing with equimolar amounts of titanium butoxide (2.0 g; Aldrich, St. Louis, MO) in acetylacteone (0.6 g; Aldrich). These solutions were then separately mixed with a solution of polyvinylpyrrolidone (0.80 g; M w = 1,300,000; Aldrich; PVP) in acetic acid (10.0 mL; Wako) and stirred for 1 h to obtain precursor spinning solutions.
B. Preparation of SrTiO3 nanofibers
The prepared precursor solutions were then loaded into a plastic syringe with a stainless steel needle (1-cm long; 22-gauge). This needle is connected to the positive electrode of a high voltage power supply (15 V; Gamma High Voltage Research, Ormond Beach, FL). An aluminum sheet was used as the collector plate and was set 15 cm away from the needle and was connected to the grounding electrode of the high voltage power supply. A syringe pump (KDScientific 100, Holliston, MA) was used to control the flow rate at 1 mL/h. The nanofibers that were collected were exposed to atmospheric moisture for 5 h for complete hydrolysis. Organic content were then removed from the electrospun fibers via calcination at 500, 600, 700, and 800 °C for 3 h. The ramping time for all calcination regimes were set at 30 min.
C. Characterization of SrTiO3 nanofibers
The prepared SrTiO3 nanofibers and a sample of commercially available SrTiO3 nanoparticles (NPs; Wako) were characterized for various properties related to hydrogen production activity. Thermogravimetry-differential thermal analysis (TG-DTA: Rigaku TG812 Thermoplus 2, Tokyo, Japan) was performed to determine the contents of the electrospun nanofibers after calcination. The nanofiber samples were measured against an Al2O3 sample under argon atmosphere. The temperature profiles for the TG-DTA analysis followed the calcination regimes used. The morphology and ratio of titanium to strontium (Ti/Sr) were characterized by field-emission scanning electron microscopy with energy dispersive spectroscopy (FE-SEM/EDS; JEOL JSM-6500FE, Tokyo, Japan). X-ray diffraction (XRD; Rigaku RINT 2100, Tokyo, Japan) spectroscopy was used to measure crystalline properties such as relative perovskite content and crystallite size. The surface areas were estimated by the Brunauer–Emmett–Teller (BET) technique, and the average pore size was estimated by the Nonlocalized Density Functional Theory (NLDFT) method from the adsorption–desorption plots obtained using an automatic water vapor adsorption apparatus (BEL Japan; BELSORP 18, Osaka, Japan). The optical energy gap (E g) was estimated from the absorbance spectra obtained using a UV-visible spectrophotometer (Shimadzu; UV-2450, Kyoto, Japan) fitted with an IRS-2200 integrating sphere attachment following a modified version of the Tauc model. Reference Guchhait and Pal16 The valence band levels of the nanofibers were measured via photoelectron yield spectroscopy in air (Riken Keiki; AC-3, Tokyo, Japan) with the irradiating intensity of the light source set at 100 nW.
D. Photocatalytic hydrogen production
The hydrogen production activity of the nanofibers and NP samples were measured by dispersing 1 g of a sample in an 800 mL solution (40% v/v methanol:water) inside an inner-irradiation type Pyrex photoreactor with a headspace of 700 mL. A 450-W high-pressure mercury lamp (Ushio; UM 452, Tokyo, Japan) was contained inside the inner cylindrical water-jacket cooled at 30 °C. The Pyrex water-jacket cut-off most of the ultraviolet and infrared radiation of the light source. The reactor was purged with argon gas before the start of the photoreaction, and the light was stabilized for 10 min before sampling. The concentration of hydrogen and oxygen gas was measured simultaneously with the photoreaction using a gas chromatograph fitted with a thermal conductivity detector (Shimadzu; GC-8A; molecular sieve 5A; argon carrier gas, Kyoto, Japan).
III. RESULTS AND DISCUSSION
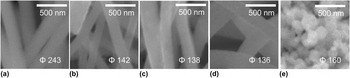
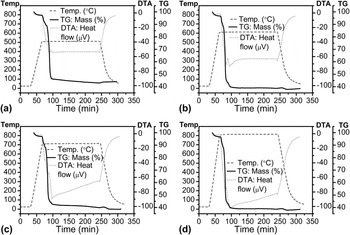
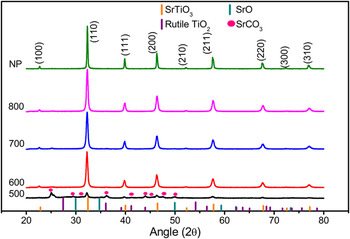
In the previously reported optimization of the spinning solution, SrAcAc was used as the strontium salt since it is soluble in a wider range of inorganic solvents. In the same optimization, acetic acid was found to be the ideal spinning solution solvent for solutions containing 20 (w/v)% titanium salt load, equimolar amounts to titanium of strontium salt, and 8 (w/v)% of PVP polymer guide. Reference Macaraig, Chuangchote, Sagawa and Yao15 In this report, SrAc was used instead as it is more soluble in acetic acid compared to SrAcAc. Through the SEM observations as shown in Fig. 1, it was confirmed that the electrospun fibers from SrAc solutions were also homogenous and were without rods and beads. The average diameters of the nanofibers significantly decreased when the calcination temperature was raised from 500 to 600 °C (243–142 nm). The average diameter did not change significantly with the further rise of calcination temperature to 700 °C or 800 °C (138 and 136 nm, respectively). This may be largely attributed to the degradation of the organic contents; specifically the PVP polymer guide. This is supported by the TG plots obtained for the different calcination regimes (Fig. 2). The nanofibers obtained after 500 °C calcination were 44.2 wt% of the original, whereas those obtained after 600 °C were 40.7 wt% of the original. The nanofibers obtained after 700 and 800 °C calcination were 38.8 wt% and 38.6 wt% of the original. This indicates that the majority of the organic matter is eliminated upon calcination at 600 °C and the nanofibers calcined at 700 °C and 800 °C had most of the carbonates removed as confirmed by the prominent endothermic curves for the temperature maintaining region in the TGA plots (Fig. 2). The electrospun fibers were confirmed to be of the perovskite crystalline structure of SrTiO3 via their XRD patterns (Fig. 3). Samples for all calcination temperatures tested have a prominent (110) perovskite peak at 32° of 2θ. However, the nanofibers calcined at 500 °C have SrCO3 peaks, also present in the XRD spectra with the most prominent peak at 25° of 2θ. As the calcination temperature is further raised, the carbonate contents were removed such that the SrCO3 peaks gradually subsided in the XRD patterns of the electropsun fibers calcined at 700 and 800 °C. The XRD patterns of the nanofibers calcined at 700 and 800 °C were similar to the XRD pattern of the NP sample and the SrTiO3 diffraction data of JCPDS 35-0734. The relative amount of the perovskite phase from the XRD patterns was determined from the peak intensities of the major characteristic peak for the perovskite (2θ = 32°, I p) and the impurity (2θ = 25°, I i) following the equation Reference Wongmaneerung, Yimnirun and Ananta17 :
 $${\rm{Perovskite \,\,phase (wt\% )}} = 100 * {I_{\rm{p}}}/({I_{\rm{p}}} + {I_{\rm{i}}})\quad .$$
SEM images of the electrospun nanofibers calcined at (a) 500 °C, (b) 600 °C, (c) 700 °C, and (d) 800 °C and (e) of the NP sample. The average diameters are indicated.

TG-DTA plots of the electrospun fibers following the temperature regime used for calcination at (a) 500 °C, (b) 600 °C, (c) 700 °C, and (d) 800 °C.

XRD patterns for the electrospun nanofibers calcined at 500, 600, 700, and 800 °C and for the NP sample. Standard diffraction data of JCPDS 35-0734 for SrTiO3, JCPDS 05-0418 for SrCO3, JCPDS 12-1276 for rutile TiO2, and JCPDS 6-0510 for SrO are also marked.

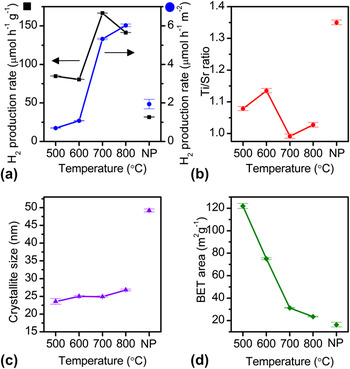
The peak at 2θ = 25° was selected as the impurity peak since anatase TiO2 is also manifested at the peak. The nanofibers calcined at 500 °C contain 49.8 wt% perovskite. At a higher calcination temperature of 600 °C, most of the organic contents were removed from the nanofibers such that the weight percent of the perovskite phase reached 98.8 wt%. In the cases of calcination at 700 and 800 °C, all the samples were mostly of the perovskite phase (100 wt%) indicating that the crystalline phase of nanofibers were almost pure SrTiO3. The obtained patterns for the NP sample also shows almost an exact match of the standard diffraction data of SrTiO3, indicating that the perovskite phase of the NPs is of 100 wt%. EDS analysis also supported the confirmation of the presence of both strontium and titanium in the nanofibers and that the atom ratio of titanium to strontium (Ti/Sr) is near to the stoichiometric ratio of 1 for the perovskite structure of SrTiO3. Figure 4(b) shows that the fabricated nanofibers have Ti/Sr ratios that are 0.01–0.13 away from the ideal stoichiometric ratio, confirming that indeed SrTiO3 nanofibers were fabricated.
(a) Hydrogen production rate, (b) titanium to strontium ratio, (c) crystallite size, and (d) BET surface area of the electrospun nanofibers calcined at 500, 600, 700, and 800 °C, and of the NP sample. Error bars are indicated.

The photocatalytic activities in terms of hydrogen production rate for the electrospun nanofibers calcined at 500, 600, 700, and 800 °C were considerably higher (81–167 μmol/h/g) than that of the NP sample (32 μmol/h/g) [Fig. 4(a)]. The photocatalytic hydrogen production rate of the fibers calcined at 500 °C is 85 μmol/h/g. The rate slightly decreased for the fibers calcined at 600 °C (81 μmol/h/g). The nanofibers calcined at 700 °C have the highest hydrogen production rate of 167 μmol/h/g, and those calcined at 800 °C have a slightly lower activity of 141 μmol/h/g. Electrospun nanofibers from SrAcAc were also tested for photocatalytic activity for comparison (Supporting Information 3). The best performing fibers from SrAcAc solutions were those calcined at 800 °C with a significantly lower hydrogen production rate of 14 μmol/h/g.
The photocatalytic activity of the SrTiO3 catalysts depends on the interplay of a number of factors that are affected by the calcination temperature. One of these factors is the stoichiometric ratio of Ti to Sr. Reported SrTiO3 films were found to be more active for the photodegradation of Victoria Blue dye if the Ti/Sr ratio were more equimolar and not Ti- or Sr-rich. Reference Subramanian, Roeder and Wolf18 As can be seen in Figs. 4(a) and 4(b), the photocatalytic activity follows the inverse of the trend of the difference of Ti/Sr ratio with the equimolar value of 1. The NP sample with a Ti/Sr ratio of 1.35, which was the farthest away from the stoichiometric ratio of 1, showed the lowest activity. The electrospun nanofibers, which had closer to the stoichiometric Ti/Sr ratio of 1, have higher activities. The calcined sample at 700 °C with a Ti/Sr ratio of 0.99 had the highest activity, followed by the one calcined at 800 °C with a Ti/Sr ratio of 1.03. The photocatalytic activities of the calcined sample at 500 °C with a Ti/Sr ratio of 1.08 and the calcined one at 600 °C with a Ti/Sr ratio of 1.13 were relatively lower. These Ti/Sr ratios of nanofibers from SrAc solutions are improvements from the Ti/Sr ratios of SrAcAc fibers (1.36, 1.37, 1.33, and 1.26 for fibers calcined at 500–800 °C, respectively). Reference Macaraig, Chuangchote, Sagawa and Yao15 The improvement of the Ti/Sr ratios of the nanofibers from SrAc solutions may be due to less steric hindrance of the acetate salt compared to that of the acetylacetonate salt in the interaction with PVP and the higher solvent interaction of SrAc compared to SrAcAc.
Another factor in determining the photocatalytic activity of inorganic photocatalysts is the crystallite size. Generally, inorganic photocatalysts with smaller crystallite sizes have higher activities because smaller crystallite sizes can lead to quantum size effects in semiconductors. Reference Roduner19 The trend in photocatalytic activity of the nanofibers followed the inverse of the trend of crystallite sizes [Figs. 4(a) and 4(c)]. The crystallite sizes of the nanofiber samples at each calcination temperature and that of NPs were estimated from the (110) peak (Fig. 2) according to the Scherrer equation. The NPs had the largest crystallite size of 49.2 nm and the lowest activity. The electrospun nanofibers have considerably smaller crystallite sizes than that of NPs and considerably exhibited higher activities. The crystallite size of the nanofibers generally increased with the rise in calcination temperature from 23.6 nm (calcined at 500 °C) to 26.8 nm (800 °C). A relatively large increase is observed when the temperature is raised from 500 to 600 °C. This increase is expected as a larger amount of organic content was removed from the fibers, leading to the increase in the weight percent of perovskite as confirmed by TG-DTA curves and XRD patterns. The size increase plateaued as the temperature was raised from 600 to 700 °C, and then continued to increase when the temperature was further raised to 800 °C. The plateau may be due to the small difference of the perovskite phase weight percent between the nanofibers obtained after calcination at 600 and 700 °C. The increase of crystallite size of the nanofibers obtained after calcination at 800 °C as compared to the case of calcination at 700 °C may be due to the partial sintering and the growth of the fine SrTiO3 crystallites, as confirmed by the DTA curves, since all of the crystalline material is already of the perovskite phase. The largest crystallite size of the electrospun fibers from SrAc solutions is similar to the crystallite size of the best performing nanofibers from SrAcAc solutions (26.6 nm).
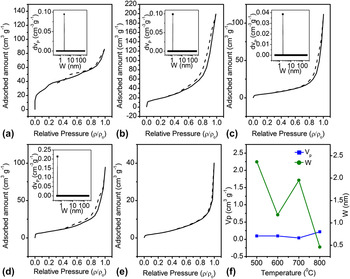
The trend in crystallite sizes is closely related to that in pore sizes. Inorganic materials can be macroporous/nonporous, microporous, or mesoporous. The nitrogen adsorption–desorption isotherms of the nanofibers and NPs show that the nanofibers may be of a mesoporous structure since they have the characteristics of a type IV isotherm and that NP is of a macroporous/nonporous structure (type II) (Fig. 5). Reference Sing20 Mesoporous materials have been shown to have higher activity due to higher surface interaction. Reference Puangpetch, Sreethawong, Yoshikawa and Chavadej11 The hysteresis loop of the isotherms for all electrospun nanofibers is of the type H3. H3 loops are usually observed for materials in aggregates of plate-like particles resulting in slit-shaped pores. Reference Sing20 The slit widths, W, and the pore volume, V P, of the nanofibers are obtained using NLDFT analysis. W for all nanofiber samples is lower than the respective crystallite size. W decreased from 2.36 to 1.18 nm, whereas V P remained relatively constant (0.094 cm3/g and 0.098 cm3/g, respectively) when the calcination temperature was raised from 500 to 600 °C. The decrease in pore width may be due to the crystal growth as can be seen in the trend in crystallite size, while the organic content still present in both the 500 and the 600 °C samples may be the reason why the pore volume is stable. W then increased from 1.18 to 1.95 nm, whereas V P decreased from 0.098 to 0.039 cm3/g when the calcination temperature was raised from 600 to 700 °C. This may be due to the removal of organic content while the crystallite size remains relatively constant. A significant decrease in W from 1.95 to 0.46 nm accompanied by a large increase in V P from 0.039 to 0.214 cm3/g can be seen when the calcination temperature was raised from 700 to 800 °C. This is largely attributed to the sintering and growth of the crystallites. Reference Sakatani, Grosso, Nicole, Boissiere, de A.A. Soler-Illia and Sanchez21 Although the V P of the 800 °C nanofibers is relatively larger than that of the 700 °C calcined nanofibers, a W of 0.46 nm can only accommodate less than four water molecules passing together, which may be the reason why the activity for the sample calcined at 700 °C is higher than the activity for the one calcined at 800 °C.
Nitrogen adsorption (solid black line)–desorption (dashed black line) isotherms of the electrospun nanofibers calcined at (a) 500 °C, (b) 600 °C, (c) 700 °C, and (d) 800 °C and (e) of the NP sample. The computed pore volume V P and the slit widths W using NLDFT analysis (inset) for the mesoporous nanofibers are shown in (f).

Another important parameter that can be measured from the adsorption–desorption isotherms is the BET surface area. Materials with high surface areas are expected to have higher activity because of the better contact between the electron–hole pair in the photocatalyst and the adsorbate (viz. water molecule) at the interface. Reference Hoffmann, Martin, Choi and Bahnemann22 The BET surface area of the calcined nanofiber samples decreased with rise of the calcination temperature. The decrease in BET surface area when the calcination temperature was raised from 500 to 700 °C is linear and is of a larger slope (from 122.0 to 75.0 to 31.3 m2/g) than the decrease from 700 to 800 °C (from 31.3 to 23.5 m2/g). The larger slope of the decrease from 500 to 700 °C may be due to the removal of the organic contents, which have a larger surface area than the crystalline material. The decrease in the BET surface area from 700 to 800 °C may be due to the growth of the SrTiO3 crystallites, which reduces the pore volume in the material. For all the calcination temperatures tested (500, 600, 700, and 800 °C), the electrospun nanofibers from SrAc solutions have higher BET surface areas than nanofibers from SrAcAc solutions (34.8, 23.1, 18.1, and 16.0 m2/g, respectively) Reference Macaraig, Chuangchote, Sagawa and Yao15 and NPs (16.3 m2/g). Although the trend in BET surface area is decreasing with the rise of calcination temperature, nanofibers calcined at a higher temperature have a higher activity. This variance may be explained by the interplay between the trends of crystallinity and BET surface area in relation to the calcination temperature. The crystallinity generally increases with the increase in calcination temperature as some order is achieved in the initially amorphous materials. High photocatalytic activities are expected for materials with high crystallinities rather than materials with amorphous structure, since amorphous materials have been shown to lead to the recombination of the photogenerated electron–hole pair. Reference Sakatani, Grosso, Nicole, Boissiere, de A.A. Soler-Illia and Sanchez21 The higher relative perovskite content of the samples calcined at higher temperatures may help explain the increase in photocatalytic activity with the decrease in BET surface area. This can be clearly seen in the increasing trend of hydrogen production rate per unit surface area as compared with the hydrogen production rate per mass unit [Fig. 4(a)]. The interplay of the decrease in BET surface area and the increase in crystallinity can help explain the decrease of the hydrogen production rate per mass unit of the 800 °C from that of the 700 °C sample.
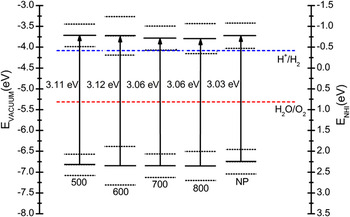
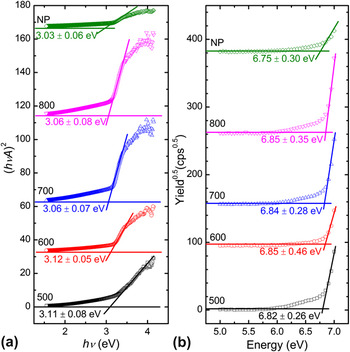
Aside from these physical properties, the electronic band levels of the photocatalysts also affect the hydrogen production activity. Figure 6 shows the valence and conduction band levels of the calcined nanofibers and NP. The valence band is determined from the photoelectron yield spectra (Fig. 7). The valence band levels for the electrospun nanofibers and the NPs are similar (500 °C: 6.82 ± 0.26 eV; 600 °C: 6.85 ± 0.46 eV; 700 °C: 6.84 ± 0.28 eV; 800 °C: 6.85 ± 0.35 eV; NPs: 6.75 ± 0.30 eV) and below the oxygen oxidation level of 5.32 eV at pH 7. The conduction band levels are determined from the difference of the valence band levels and the estimated E g. The E g of the nanofiber samples were determined from a modified version Reference Guchhait and Pal16 of the Tauc plot technique wherein the total absorbance A was plotted instead of the extinction coefficient α following the Tauc equation for direct transitions: (hνα)2 = a(hν − E g). α was replaced by A since from the Lambert–Beer–Bouguer law, α = ln(10) A/d, where d is the thickness of the film, which was kept constant during the measurements, and thus, the equation can be rewritten as (hνA)2 = a′(hν − E g) where a′ represents another constant different from a. The estimated E g values for the nanofiber samples from the modified Tauc plots (Fig. 7) are 3.11 ± 0.08 eV for those that are calcined at 500 °C, 3.12 ± 0.05 eV for those that are calcined at 600 °C, 3.06 ± 0.07 eV for those that are calcined at 700 °C, and 3.06 ± 0.08 eV for those that are calcined at 800 °C. Therefore, the conduction band levels of the nanofibers were determined to be above the hydrogen reduction level of 4.08 eV at pH 7. Since the valence and conduction bands for all samples are below and above the oxygen oxidation and hydrogen reduction level at pH 7, respectively, the samples with narrower E g are expected to have higher activity. The nanofibers calcined at a higher temperature have a slightly narrower E g than the nanofibers calcined at a lower temperature. This is consistent with the trend in photocatalytic activity. This narrower E g may be due to the presence of SrCO3 peaks in the samples calcined at a lower temperature and the higher amount of the amorphous phase. Reference Bao, Yao, Wakiya, Shinozaki and Mizutani23 All the E g values of the electrospun nanofibers though are slightly larger than those of NPs (3.03 ± 0.06 eV). Since other physical properties discussed above for NPs are inferior compared to that of the nanofibers, the photocatalytic activity of NPs is significantly lower than that of the nanofibers.
Band diagrams of the electrospun nanofibers calcined at 500, 600, 700, and 800 °C and of the NP sample. The reduction–oxidation potential levels of hydrogen (blue dashed line) and oxygen (red dashed line) at pH = 7 are also indicated. The valence band levels are estimated from photoelectron yield spectra in air; errors are indicated as black dotted lines. The conduction band levels are determined from the valence band levels and the estimated E g ; errors (black dotted lines) are also indicated.

(a) Plots of (hνA)2 versus energy derived from the absorbance spectra and (b) photoelectron yield spectra obtained under air atmosphere for the nanofibers calcined at 500, 600, 700, and 800 °C and for the NP sample. The estimated E g from the Tauc plot and the estimated valence band level estimated from the photoelectron yield spectra are also indicated.

IV. CONCLUSIONS
Homogenous SrTiO3 nanofibers were reproducibly prepared via the electrospinning of clear precursor solutions, which contained both the strontium and the titanium salts. Photocatalytic properties in terms of BET surface area, Ti/Sr ratio, and crystallinity were improved when the strontium salt was changed from SrAcAc to SrAc. This improvement may be largely attributed to better interaction of the strontium salt with PVP and the acetic acid solvent. The electrospun nanofibers from SrAc solutions calcined at 700 °C gave the best photocatalytic performance of 167 μmol/h/g among all the calcination temperatures tested. This value is significantly higher than that of the best-performing nanofibers from SrAcAc solutions with an activity of 14 μmol/h/g, which are calcined at 800 °C. More importantly, it is significantly higher than that of NPs with 32 μmol/h/g. This is because the electrospun nanofibers from SrAc solutions calcined at 700 °C have better if not comparable photocatalytic properties as compared to NPs. Although the electrospun nanofibers have a slightly wider E g (3.06 eV for nanofibers calcined at 700 °C versus 3.03 eV for NPs), the Ti/Sr ratio is closer to the ideal stoichiometric ratio (0.99 for nanofibers calcined at 700 °C versus 1.35 for NPs) and the crystallite size is smaller (23.6 nm for nanofibers calcined at 700 °C versus 49.2 nm for NPs). The electrospun nanofibers are mesoporous (W = 1.95 nm for nanofibers calcined at 700 °C) as compared to the macroporous/nonporous NPs. In addition, they have a larger BET surface area (31.3 m2/g for nanofibers calcined at 700 °C versus 11.6 m2/g for NPs) and comparable crystallinity. The photocatalytic activity for hydrogen production of nanofibers calcined at 700 °C (167 μmol/h/g) is even higher than those reported for hydrogen production of TiO2 nanoparticles (ST-01, Ishihara) and anatase nanofibers, which are obtained as 18 and 54 μmol/h/g, respectively. Reference Chuangchote, Jitputti, Sagawa and Yoshikawa12
Supplementary Material
Supplementary materials can be viewed in this issue of the Journal of Materials Research by visiting http://journals.cambridge.org/jmr.
ACKNOWLEDGMENTS
The authors are indebted to Prof. Keiichi N. Ishihara and Dr. Eiji Yamasue of Graduate School of Energy Science, Kyoto University for the use of TG-DTA apparatus. This work was partly supported by the “Energy Science in the Age of Global Warming” of Global Center of Excellence (G-COE) program (J-051) of the Ministry of Education, Culture, Sports, Science and Technology (MEXT) of Japan.