Implications
Genetic (or ‘genomic’) imprinting, which results in the expression of mammalian genes from only one of the two parentally inherited chromosomes, plays a pivotal role in growth and development. In domestic livestock species, imprinted genes have been shown to contribute to economically important production traits. In this study, we detected statistically significant associations between genetic markers (single nucleotide polymorphisms) in the bovine equivalent of genes shown to be imprinted in other mammalian species and traits related to beef production. Our findings support previous research showing that imprinted genes are likely to influence production traits in livestock. Furthermore, genetic variation in imprinted genes can be used to augment existing animal breeding programmes and encourage research that supports sustainable and competitive agricultural production.
Introduction
Large-scale genome sequencing projects are revealing the wealth of DNA sequence variants within mammalian genomes. The majority of these exist as single nucleotide polymorphisms (SNPs) – single base pair (bp) substitutions in genomic DNA where the least common allele has a frequency of 1% or greater within a population (Kruglyak and Nickerson, Reference Kruglyak and Nickerson2001). Studies of the bovine genome have estimated an average density of one SNP for every 500 bp to 1 kb sequenced, while recent mining of the complete bovine genome sequence has identified over 2.3 million putative SNPs (Heaton et al., Reference Heaton, Grosse, Kappes, Keele, Chitko-McKown, Cundiff, Braun, Little and Laegreid2001; Van Tassell et al., Reference Van Tassell, Smith, Matukumalli, Taylor, Schnabel, Lawley, Haudenschild, Moore, Warren and Sonstegard2008; Elsik et al., Reference Elsik, Tellam, Worley, Gibbs, Muzny and Weinstock2009; Gibbs et al., Reference Gibbs, Taylor, Van Tassell, Barendse, Eversole and Gill2009; Williams et al., Reference Williams, Dunner, Valentini, Mazza, Amarger, Checa, Crisa, Razzaq, Delourme, Grandjean, Marchitelli, Garcia, Gomez, Negrini, Marsan and Leveziel2009).
In domestic livestock species, SNPs are now recognised as the genetic marker-of-choice for mapping quantitative trait loci (QTL) for production traits, due to their abundance and pan-genomic distribution. Furthermore, recent advances in SNP genotyping technologies, such as the development of high-density, pan-genomic genotyping assays (or ‘SNP chips’), have provided researchers with methods for analysing genome-wide phenotypic associations (Goddard and Hayes, Reference Goddard and Hayes2009). However, as many SNPs represented on these genotyping platforms are located in non-coding regions of the genome, the detection of genotype–phenotype associations does not directly lead to the identification of the genes underlying the trait(s)-of-interest. Therefore, candidate gene approaches involving the prior selection of genes for association analyses based on their documented biological function represent a valuable alternative strategy (Ron and Weller, Reference Ron and Weller2007).
We have used a candidate gene approach by targeting the bovine orthologs of previously reported imprinted genes, many of which are known to influence growth and development in other mammalian species, primarily mice and humans (Ruvinsky, Reference Ruvinsky1999; Reik and Walter, Reference Reik and Walter2001; Feil, Reference Feil2009). Genetic (or ‘genomic’) imprinting, a form of epigenetic regulation that affects approximately 100 mammalian genes, results in monoallelic gene expression from one of the two parentally inherited chromosomes in a parent-of-origin manner (McGrath and Solter, Reference McGrath and Solter1984; Surani et al., Reference Surani, Barton and Norris1984; http://igc.otago.ac.nz; http://www.geneimprint.com). While most genomic imprinting studies have concentrated on the mouse model or human biomedical disorders, there is burgeoning interest in the function of imprinted genes in domestic livestock species, especially as several studies have shown that imprinted genes influence a range of important complex production traits. For example, the imprinted insulin-like growth factor 2 (IGF2) and distal-less homeobox 5 (DLX5) genes have been shown to be associated with QTL influencing muscle mass and fat deposition in pigs (Nezer et al., Reference Nezer, Moreau, Brouwers, Coppieters, Detilleux, Hanset, Karim, Kvasz, Leroy and Georges1999; Van Laere et al., Reference Van Laere, Nguyen, Braunschweig, Nezer, Collette, Moreau, Archibald, Haley, Buys, Tally, Andersson, Georges and Andersson2003; Cheng et al., Reference Cheng, Zhang, Jiang, Li, Xiong and Deng2008). Furthermore, an A-to-G substitution (known as the callipyge (CLPG) mutation) within the imprinted DLK1-DIO3 domain causes the callipyge phenotype in sheep, which is characterised by profound muscle overgrowth (or ‘hypertrophy’) of the hindquarters and reductions in total body fat content (Freking et al., Reference Freking, Murphy, Wylie, Rhodes, Keele, Leymaster, Jirtle and Smith2002; Smit et al., Reference Smit, Segers, Carrascosa, Shay, Baraldi, Gyapay, Snowder, Georges, Cockett and Charlier2003). Genome-wide scans for production traits in pigs have also revealed associations with a substantial number of important imprinted QTL (de Koning et al., Reference de Koning, Rattink, Harlizius, van Arendonk, Brascamp and Groenen2000; Holl et al., Reference Holl, Cassady, Pomp and Johnson2004; Uemoto et al., Reference Uemoto, Sato, Ohnishi, Terai, Komatsuda and Kobayashi2009). In addition, recent work has highlighted the evolutionary consequences of imprinting in animal breeding systems, particularly where there are differences in both the intensity of selection for sex-specific production traits (e.g. muscling and milk), and male and female effective population sizes (Patten and Haig, Reference Patten and Haig2008). Hence, we hypothesise that a candidate gene strategy focussing on putative bovine imprinted genes, based on the imprinting status of these genes in other mammalian species, may increase the likelihood of detecting genomic regions and/or DNA polymorphisms that directly contribute to variability in important beef and dairy production traits.
In this study, we report: (i) the methods used to validate previously documented and novel DNA sequence polymorphisms associated with a number of candidate bovine imprinted genes that have been shown to be imprinted in other mammalian species, primarily humans and mice; (ii) the phylogeographic distribution of these validated SNPs within different domestic cattle populations of wide geographic provenance; and (iii) the preliminary genotype–phenotype associations between a subpanel of these SNPs and a range of economically important beef production traits in performance-tested Limousin samples.
Material and methods
Sample collection and DNA extraction
Blood samples (3 to 5 ml) from 138 performance-tested Limousin bulls (obtained from the Irish Cattle Breeding Federation’s (ICBF) Tully experimental station in County Kildare, Ireland) were collected in EDTA-treated Vacutainers® (Becton, Dickinson Ltd, Dublin, Ireland) and stored at −20°C until required. DNA was extracted from whole frozen blood using either standard phenol-chloroform techniques or a Maxwell®16 automated apparatus (Promega UK Ltd, Southampton, UK) according to the manufacturer’s instructions. In addition, DNA samples from African B. taurus (n = 29) and Indian B. indicus (n = 18) animals were kindly supplied by Prof. Dan Bradley, Department of Genetics, Trinity College, Dublin, Ireland.
Cataloguing bovine orthologs of known mammalian imprinted genes
An extensive literature and database search of genetic imprinting resources revealed substantial conservation in the imprinting status (i.e. whether imprinted or not) and the parent-of-origin effect (madumnal or padumnal) of orthologous genes in different mammalian lineages. The high degree of evolutionary conservation of genetic imprinting in placental mammals (particularly that observed between humans and mice) suggests that a large proportion of the known mammalian imprinted genes will also be imprinted in cattle (Morison et al., Reference Morison, Ramsay and Spencer2005; http://igc.otago.ac.nz; http://www.geneimprint.com).
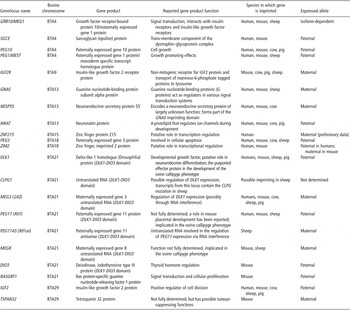
A list of documented imprinted genes was compiled using information from the literature and the publicly accessible mammalian genetic imprinting databases (http://www.geneimprint.com; http://igc.otago.ac.nz). The bovine orthologs of a subset of these genes were retrieved from the BTAU_4.0 bovine genome sequence build (http://www.ensembl.org) to generate a candidate bovine imprinted gene panel (CBIGP; Table 1).
The CBIGP analysed in this study

CBIGP = candidate bovine imprinted gene panel.
The imprinting status species information for each gene was obtained from the catalogue of parent of origin effects (http://igc.otago.ac.nz) and the Geneimprint (http://www.geneimprint.com) databases. The function of each gene was retrieved from GenBank (http://www.ncbi.nlm.nih.gov), the Gene Ontology website (http://www.geneontology.org) and the UniProt database (http://www.uniprot.org). As the mammalian PEG11 and PEG11AS genes are located at the same locus but are transcribed in opposite directions from the paternally- and maternally inherited chromosomes, respectively, they were considered as a single locus in this study. Gtl2, Rtl1 and Rtl1as represent the murine orthologs of the MEG3, PEG11 and PEG11AS genes, respectively.
The CBIGP also included the bovine orthologs of genes belonging to the mammalian DLK1-DIO3 imprinted domain. This domain consists of a cluster of imprinted genes delineated by the delta-like homologue 1 (DLK1) and the deiodinase, iodothyronine, type III (DIO3) genes – three paternally expressed protein-coding genes (DLK1, paternally expressed gene 11 (PEG11/Rtl1) and DIO3) and multiple, maternally expressed non-coding RNA genes including maternally expressed gene 3 (MEG3/Gtl2), maternally expressed gene 8 (MEG8), PEG11 antisense (PEG11AS, which is located at the same locus as the PEG11 gene but transcribed in the opposite direction and hence is treated as a single locus in this study) and the microRNA-containing locus (MIRG) (Georges et al., Reference Georges, Charlier and Cockett2003; Cockett et al., Reference Cockett, Smit, Bidwell, Segers, Hadfield, Snowder, Georges and Charlier2005; da Rocha et al., Reference da Rocha, Edwards, Ito, Ogata and Ferguson-Smith2008).
Previous studies have revealed that in heterozygous individuals, displaying paternal inheritance of an A-to-G substitution located within the intergenic region between the DLK1 and MEG3 genes (also referred to as the CLPG mutation) results in the ovine callipyge phenotype (Cockett et al., Reference Cockett, Smit, Bidwell, Segers, Hadfield, Snowder, Georges and Charlier2005). Furthermore, the CLPG mutation has been shown to be contained within transcripts produced from the genomic interval between the DLK1 and MEG3 genes, a region known as the CLPG1 locus; however, the imprinting status of the CLPG1 locus in sheep has not yet been fully elucidated (Murphy et al., Reference Murphy, Nolan, Huang, Kucera, Freking, Smith, Leymaster, Weidman and Jirtle2006).
At the time of the analysis, the bovine orthologs of three of the six imprinted genes/loci within the mammalian DLK1-DIO3 domain (MEG3, MEG8 and PEG11/PEG11AS) and the complete sequence of the bovine CLPG1 locus were not fully annotated in the BTAU_4.0 build of the bovine genome sequence. Instead, these genes/loci were identified within the bovine DLK1-DIO3 domain on Bos taurus chromosome 21 (BTA21) through alignment of the reported murine, human and ovine ortholog sequences with the bovine genome (BTAU_4.0 build) using BLASTN (http://blast.wustl.edu) or via synteny searches within the Ensembl database (Table 1).
Detection of putative DNA sequence polymorphisms within the CBIGP-listed genes
The DNA sequences of the CBIGP-listed genes (i.e. the DNA sequence of the annotated open reading frame (ORF) and 10 000 bp upstream and downstream of the gene) together with their reported associated sequence polymorphisms were retrieved using bovine genome resources (http://www.ensembl.org; http://genome.ucsc.edu). Polymorphic regions of these genes were selected for re-sequencing to confirm the presence of the putative SNPs reported in the genome databases and to detect novel putative SNPs (herein referred to as de novo SNPs). Putative SNPs were identified via DNA sequence analysis of high-fidelity polymerase chain reaction (PCR) amplification products generated from a panel of 26 non-related animals of wide geographic provenance: 17 European B. taurus samples (six Limousin, five Simmental and six Aberdeen Angus); five African B. taurus samples (all Guinean N’Dama); and four Indian B. indicus samples (two Tharparker and two Sahiwal).
For PCR amplification, 3 μl of genomic DNA (10 to 20 ng/μl) from each sample was used as template in 50 μl reactions containing 1 × Platinum Taq DNA polymerase buffer (Invitrogen Ltd, Paisley, UK), 200 nM each dNTP, 0.2 μM forward primer, 0.2 μM reverse primer, 2.0 to 2.5 mM MgCl2 and 0.5 units Platinum Taq polymerase (Invitrogen). PCRs were performed using 5 min of initial denaturation at 95°C, followed by 40 cycles of denaturation (95°C, 45 s), annealing (54°C to 61°C, 45 s) and extension (72°C, 1 min), with a final extension (72°C, 10 min). The optimal PCR amplification conditions for each amplicon are detailed in Table S1. PCR products were electrophoresed on 1.5% agarose gels stained with 0.5 μg/ml ethidium bromide and visualised on a gel documentation system. All PCR amplicons were sequenced bidirectionally by Macrogen Inc. (Seoul, Korea; http://www.macrogen.com) and yielded phred quality scores ⩾20.
Putative SNPs were detected by aligning PCR product DNA sequences together with the reference bovine genome sequence using the CLUSTALW DNA sequence alignment option within the MEGA analysis package (Tamura et al., Reference Tamura, Dudley, Nei and Kumar2007). Each putative SNP was mapped to the BTAU_4.0 bovine genome sequence build using the BLAT sequence analysis tool (http://genome.ucsc.edu).
High-throughput SNP genotyping and SNP validation
All putative SNPs were re-formatted as genetic markers for high-throughput SNP genotyping. High-throughput SNP genotyping was performed by Sequenom Inc. (San Diego, USA; http://www.sequenom.com) using their proprietary MassARRAY iPLEX® Gold technology for all 138 European B. taurus performance-tested (all Limousin) bulls, 29 African B. taurus samples (all Guinean N’Dama) and 18 Indian B. indicus samples (four Hariana, seven Tharparker and seven Sahiwal). In total, 185 cattle samples were assayed. Putative SNPs that were assayable and had either (i) a minor allele frequency (MAF) ⩾0.01 in at least one of the three assessed continental populations (an SNP-defining criterion according to a recent review by Frazer et al. (Reference Frazer, Murray, Schork and Topol2009)) or (ii) were fixed for alternative alleles in different continental populations, were considered as being validated in this study.
Genotypic data were confirmed using two approaches. First, samples that were sequenced as part of the putative SNP detection methods were also included for high-throughput genotyping. Second, a subpanel of 10 validated SNPs were independently genotyped in all 185 samples using custom-designed TaqMan® probes (Applied Biosystems, Warrington, UK). TaqMan®-based genotyping reactions (10 μl) were performed on an ABI7500 Real-Time PCR apparatus (Applied Biosystems) according to the manufacturer’s instructions and contained 1 × TaqMan® SNP genotyping mastermix (Applied Biosystems) and 1 μl DNA (at 10 ng/μl) – a 100% concordance between the genotypes generated using the MassARRAY iPLEX® and TaqMan® platforms was observed (data not shown).
Validated SNPs were catalogued and labelled in numerical order according to the nearest candidate bovine imprinted gene. We classified SNPs previously deposited in the Ensembl database or reported for the first time in this study as ‘Ensembl’ or ‘de novo’ SNPs, respectively. Where possible, the location of each validated SNP relative to its associated gene (i.e. upstream regions, 5′UTRs, promoter regions, exons, introns, 3′UTRs and downstream regions) was determined through comparison with the ORF structure of each gene as reported on the Ensembl database. Allele frequencies for each SNP in all three continental populations were calculated using the Excel Microsatellite Toolkit analysis package (Park, Reference Park2001). The Haploview package (Barrett et al., Reference Barrett, Fry, Maller and Daly2005) was used to measure r 2 values of linkage disequilibrium (LD) for pairwise combinations of segregating SNPs (Hill and Robertson, Reference Hill and Robertson1968).
SNP genotype–phenotype associations
Associations between each SNP and performance-tested trait were determined using phenotypic data for 97 of the 138 genotyped Limousin bulls. The reduced number of animals included in the association analyses (97 v. 138) was due to a data filtering process using the criteria previously applied by Crowley et al. (Reference Crowley, McGee, Kenny, Crews, Evans and Berry2010). In total, six performance traits were assessed: average feed intake (AFI), (mid-test) live weight (LW), average daily gain (ADG), feed conversion ratio (FCR), residual gain (RG, defined as the difference between actual and predicted daily gain (Crowley et al., Reference Crowley, McGee, Kenny, Crews, Evans and Berry2010)) and residual feed intake (RFI). All animals had been performance tested in a national performance test station between 2005 and 2007. The dietary regime during the test period, as well as the trait measurements taken and the data filtering criteria applied, is described in more detail elsewhere (Crowley et al., Reference Crowley, McGee, Kenny, Crews, Evans and Berry2010).
In brief, animals had ad libitum access to a high concentrate diet with 1.5 kg dry matter (DM) roughage daily. Following an acclimatisation period, AFI and LW were measured for a 70-day test period. ADG was calculated by fitting a linear regression through individual LW measures and LW was predicted from the regression line, 35 days into the test. The feed efficiency variables calculated were FCR, RFI and RG. The 97 animals included in this analysis were aged between 350 and 514 days at the end of the 70-day test period.
The associations between each SNP and trait performance were quantified using a series of univariate linear animal mixed models in ASReml (Gilmour et al., Reference Gilmour, Cullis, Gogel, Welham and Thompson2006) where each SNP was individually included as a fixed effect in the model along with other fixed effects. Genotypes were included as continuous variables based on the number of reference alleles present; a second analysis investigated the presence of dominance in the heterozygote. Other fixed effects included in the model were contemporary group (defined as a group of animals that were performance tested simultaneously), parity of dam and a quadratic effect of the age of bulls at the end of the test, as described previously (Crowley et al., Reference Crowley, McGee, Kenny, Crews, Evans and Berry2010). The pedigree of each animal was traced back at least four generations and was included in the mixed model analysis via the numerator relationship matrix. The dependent variables, calculated throughout the test period, were AFI, LW, ADG, FCR, RG and RFI. Heritability estimates for each trait in Limousin cattle were fixed using the results of (Crowley et al., Reference Crowley, McGee, Kenny, Crews, Evans and Berry2010). These estimates are based on the statistical analyses of data obtained from 999 animals (v. 97 animals used in this study) and therefore provide a more accurate estimate of true heritability in Limousin cattle.
Results
Bioinformatic analysis of CBIGP-listed genes
Twenty candidate bovine imprinted genes distributed across seven B. taurus chromosomes formed the CBIGP. All genes within the CBIGP have been previously reported as having a biological role in mammalian growth and development and/or cellular maturation and proliferation (Table 1). Bioinformatic analysis of the CBIGP gene sequences and their flanking 10 000 bp sequences within the Ensembl database showed that 18 of the 20 genes harboured putative DNA sequence polymorphisms; at the time of the analysis, no polymorphisms were reported in Ensembl for the DNA sequences of the bovine DLK1 and DIO3 orthologs.
Putative SNP detection via DNA sequence analysis of re-sequenced CBIGP gene regions
Primer pairs for a total of 57 different PCR amplicons were designed to amplify between one and six variable regions of each of the 20 CBIGP-listed genes (mean of 2.9 amplicons per gene). PCR amplicons ranged in size from 280 to 1423 bp (mean amplicon size of 778 bp). A total of 44 333 bp of re-sequenced DNA was amplified across all 57 amplicons (Table S1). DNA sequence polymorphisms were not detected in the PCR amplicons generated for five CBIGP genes (DLK1, DIO3, NNAT, PEG1/MEST and SGCE); these genes were not considered for further analysis in this study (Table S1). DNA sequence analysis of the remaining 15 CBIGP genes identified a total of 133 putative SNPs, of which 76 were previously deposited in Ensembl, while the remaining 57 were detected for the first time in this study. These figures yield a mean of 2.3 putative SNPs per PCR amplicon (i.e. 133 putative SNPs/57 amplicons) and an estimate of one putative SNP detected for every 333 bp of DNA sequenced (i.e. 133 putative SNPs/44 333 bp). All putative SNPs detected via DNA sequencing were biallelic, and of these, 95 of 133 (71.4%) and 38 of 133 (28.6%) constituted transitions and transversions, respectively (Table S2).
Validation of putative SNPs
All 133 putative SNPs were re-formatted for high-throughput SNP genotyping using all the 185 cattle samples detailed above. Twelve putative SNPs failed the in silico assay design process and were not considered for any further analysis. A further four SNPs were monomorphic across all three continental populations (i.e. European B. taurus, African B. taurus and Indian B. indicus) and were eliminated from this study.
Of the remaining 117 SNPs (82 transitions (70.1%) and 35 transversions (29.9%)), 111 displayed an MAF ⩾ 0.01 in at least one of the three continental populations assayed, while six SNPs were fixed for alternative alleles in B. taurus and B. indicus samples. We regard these 117 SNPs (70 Ensembl SNPs and 47 de novo SNPs) as being validated. Detailed information including SNP identity, nucleotide position, allele identities and ORF gene model positions for all 117 validated SNPs is presented in Table S2. Allele frequencies for each SNP in each of the three continental populations examined are given in Table S3.
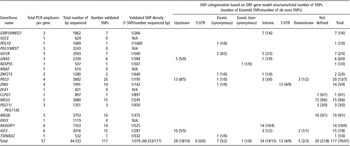
Analysis of the distribution of these 117 validated SNPs across their associated genes revealed 28 SNPs located upstream of the nearest gene, none located in 5′UTRs, seven exonic synonymous substitutions, one exonic non-synonymous substitution (located in the first exon of the NESP55 gene causing an aspartic acid amino acid (GAC codon) to be replaced with an asparagine (AAC codon) amino acid (Khatib, Reference Khatib2004)), 34 intronic SNPs, 13 SNPs located in 3′UTRs and five SNPs located downstream of the nearest gene. The ORF gene model positions of 29 of the 117 validated SNPs (all of which were within the bovine DLK1-DIO3 imprinting domain) were not assigned as the ORF gene models of these genes were not fully annotated in the BTAU_4.0 bovine genome sequence build at the time of analysis (Table 2).
Details of the 117 validated SNPs within the CBIGP-listed genes

SNP = single nucleotide polymorphism; CBIGP = candidate bovine imprinted gene panel; bp = base pair; ORF = open reading frame.
Gene ORF model structures were obtained from the Ensembl database (http://www.ensembl.org).
Phylogeographic distribution of validated SNPs
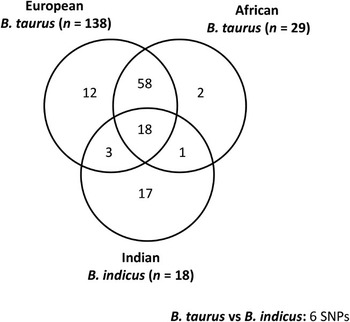
Of the 111 validated SNPs displaying an MAF ⩾ 0.01 in at least one of the three continental populations, 18 were polymorphic in all three continental populations; 58 were polymorphic in both European and African B. taurus only; three were polymorphic in both European B. taurus and Indian B. indicus only; one was polymorphic in both African B. taurus and Indian B. indicus only; 12 were polymorphic in European B. taurus only; two were polymorphic in African B. taurus only and 17 were polymorphic within Indian B. indicus only (Figure 1).
The phylogeographic distribution of the 117 validated SNPs detected in this study. The number of polymorphic SNPs within and shared between continental populations are presented in the Venn diagram. The sample size for each continental population is given in parentheses.

Categorisation of validated SNPs within performance-tested Limousin animals
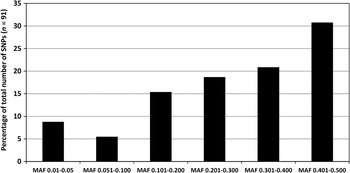
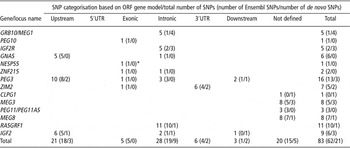
Before testing for SNP genotype–phenotype associations, we analysed in greater detail the allele frequency distribution of validated polymorphic SNPs within the performance-tested European B. taurus (Limousin) samples. In total, 91 of 117 validated SNPs were polymorphic within the Limousin samples analysed here, and of these, eight (8.79%) had an MAF between 0.010 and 0.050; five (5.49%) had an MAF between 0.051 and 0.100; 14 (15.38%) had an MAF between 0.101 and 0.200; 17 (18.68%) had an MAF between 0.201 and 0.300; 19 (20.88%) had an MAF of 0.301 and 0.400 and 28 (30.77%) had an MAF of 0.401 and 0.500 (Figure 2). For phenotype association studies, only SNPs with an MAF ⩾ 0.05 in the Limousin samples (n = 83 SNPs) were considered for analysis. The ORF gene model positions of the 83 SNPs used for genotype–phenotype association analysis are detailed in Table 3.
Minor allele frequency (MAF) distributions for the 91 polymorphic SNPs in the European B. taurus (Limousin) population analysed in this study.

The gene distribution of the 83 validated SNPs with MAF⩾0.05 in the Limousin samples used for genotype–phenotype association analysis

SNP = single nucleotide polymorphism; MAF = minor allele frequency.
*This SNP causes a non-synonymous aspartic acid-to-asparagine amino acid substitution (Reference KhatibKhatib, 2004).
SNP-phenotype associations in the performance-tested Limousin samples
SNP genotype–phenotype associations (using only those SNPs with an MAF ⩾ 0.05 in the Limousin samples) were assessed with six phenotypic traits related to beef production – ADG, AFI, (mid-test) LW, FCR (for convenience FCR effects and associated standard errors were multiplied by 10), RFI and RG. No SNPs in the CLPG1, GRB10/MEG1, IGF2R, MEG3, MEG8, PEG10, PEG11 and ZNF215 genes were significantly associated with any of the six performance traits evaluated. Associations with RFI were observed with three PEG3 SNPs (PEG3_01, PEG3_12, PEG3_16, P < 0.05); the IGF2_01 SNP was associated with ADG (P < 0.05) and AFI (P < 0.01) while the IGF2_15 SNP was associated with FCR (P < 0.05). One GNAS SNP (GNAS_02) was associated with AFI. Associations (P < 0.05) were also observed between the NESP55_01 and PEG3_15 SNPs and LW.
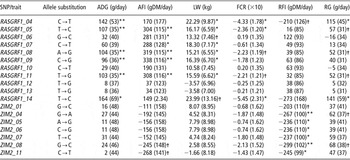
For the RASGRF1 and ZIM2 genes, 11 and seven validated SNPs, respectively, displayed associations with a number of the phenotypic traits assessed. Allelic substitution effects for these SNPs are detailed in Table 4 and Figure 3. Six RASGRF1 SNPs (all intronic) were associated (P < 0.05) with ADG, AFI and LW. Associations with the feed efficiency variables were less apparent. The C-to-T allele substitution at the RASGRF1_04 SNP was associated with a reduction in both FCR (−4.33; s.e. ±1.78; P < 0.05) and RFI (−210 g/day; s.e. ±126 g/day; P < 0.10) and a corresponding increase in RG of 115 g/day (s.e. ±45 g/day; P < 0.05); all associations at this SNP suggest that the C-to-T substitution is associated with improved feed efficiency. The C-to-T substitution at the RASGRF1_04 SNP was also associated (P < 0.01) with ADG (142 g/day; s.e. ±53 g/day). The T-to-C allele substitution at the RASGRF1_14 SNP was also associated with a reduction in FCR (−5.45; s.e. ±2.31; P < 0.05) and increase in RG of 141 g/day (s.e. ± 59 g/day; P < 0.05), but was not associated with RFI. This SNP was also associated (P < 0.01) with ADG (164 g/day; s.e. ±69 g/day). The RASGRF1_04 and RASGRF1_14 SNPs are separated by a total of 54 448 bp and displayed high LD values (r 2 value 0.84; Table S4).
Allelic substitution effect for segregating SNPs in the RASGRF1 and ZIM2 genes on ADG, AFI, (mid-test) LW, FCR, RFI and RG

SNP = single nucleotide polymorphism; ADG = average daily gain; AFI = average feed intake; LW = live weight; FCR = feed conversion ratio; RFI = residual feed intake; RG = residual gain.
Significance of difference from zero: †P < 0.10; *P < 0.05; **P < 0.01. Standard errors (s.e.) are given in parentheses. g/day (grams per day); gDM/day (grams dry matter/day).
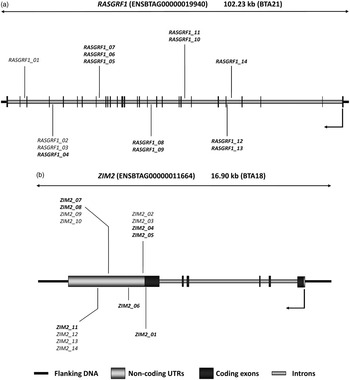
The ORF gene model positions of the validated RASGRF1and ZIM2 SNPs analysed in this study. SNPs in the RASGRF1 (a) and ZIM2 (b) genes displaying associations with the performance traits analysed are highlighted in boldface text (refer to Table 4). Arrowheads denote both the transcriptional start site and the direction of transcription of the genes. Both genes are transcribed from the reverse (minus) DNA strand. The ORF gene model features (exons, introns, UTRs and flanking sequences) are shown and were obtained from the Ensembl database (http://www.ensembl.org). The Ensembl accession numbers for both genes are also provided.

In contrast to RASGRF1, SNPs in the ZIM2 gene were not associated with ADG or LW, while two SNPs (ZIM2_08 and ZIM2_11) tended to be associated (P < 0.10) with AFI. However, six ZIM2 SNPs were associated (P < 0.05) with RFI, while the ZIM2_04 and ZIM2_08 SNPs tended to be associated (P < 0.10) with RG. LD (r 2) values for the seven ZIM2 ranged between 0.37 and 1.00 (Table S4). Associations between the remaining validated SNPs that were polymorphic in European B. taurus and performance traits are summarised in Table S5.
Discussion
SNP validation in candidate bovine imprinted genes
The recent availability of an assembled 7.1 × cattle genome sequence has revealed a wealth of putative SNPs distributed across the bovine genome (Elsik et al., Reference Elsik, Tellam, Worley, Gibbs, Muzny and Weinstock2009). Recent mining of this genome sequence identified a total of 2.3 million putative SNPs; however, many of these are unvalidated and a large proportion are expected to be either heterozygous DNA sequence variants in the sequenced heifer, which may be present at undetectable frequencies in larger populations, or to represent sequencing artefacts often encountered during genome sequencing projects (Williams et al., Reference Williams, Dunner, Valentini, Mazza, Amarger, Checa, Crisa, Razzaq, Delourme, Grandjean, Marchitelli, Garcia, Gomez, Negrini, Marsan and Leveziel2009). Consequently, there is a strong requirement for validating SNPs before initiating population genetic studies in domestic cattle populations.
Large-scale SNP genotyping strategies have required the development of high-throughput SNP assays, such as the recently developed Illumina® Bovine SNP50 BeadChip (Matukumalli et al., Reference Matukumalli, Lawley, Schnabel, Taylor, Allan, Heaton, O’Connell, Moore, Smith, Sonstegard and Van Tassell2009). These platforms have facilitated the identification of genomic regions contributing to complex production traits (Cole et al., Reference Cole, VanRaden, O’Connell, Van Tassell, Sonstegard, Schnabel, Taylor and Wiggans2009) and the detection of mutations underlying recessive genetic disorders (Charlier et al., Reference Charlier, Coppieters, Rollin, Desmecht, Agerholm, Cambisano, Carta, Dardano, Dive, Fasquelle, Frennet, Hanset, Hubin, Jorgensen, Karim, Kent, Harvey, Pearce, Simon, Tama, Nie, Vandeputte, Lien, Longeri, Fredholm, Harvey and Georges2008), while also enabling whole-genome selection strategies (Sellner et al., Reference Sellner, Kim, McClure, Taylor, Schnabel and Taylor2007). However, while these approaches have identified many QTL related to production traits, little information has been generated regarding the identity and function of the underlying genes (Andersson, Reference Andersson2009). It should also be stated that analysis of larger numbers of individuals using denser SNP genotyping platforms will be expected to identify multiple QTL contributing to individual complex traits, each of which would be expected to have reduced average effects on phenotype (Mackay et al., Reference Mackay, Stone and Ayroles2009).
In this study, a candidate gene approach was adopted in which we investigated genetic variation in a panel of bovine orthologs of mammalian genes subject to imprinting. Previous studies have shown that imprinted genes influence mammalian growth and development and also contribute to variation in quantitative traits in domestic livestock (Van Laere et al., Reference Van Laere, Nguyen, Braunschweig, Nezer, Collette, Moreau, Archibald, Haley, Buys, Tally, Andersson, Georges and Andersson2003; Cockett et al., Reference Cockett, Smit, Bidwell, Segers, Hadfield, Snowder, Georges and Charlier2005; Cheng et al., Reference Cheng, Zhang, Jiang, Li, Xiong and Deng2008; Feil, Reference Feil2009). In total, 20 candidate imprinted genes were analysed for DNA sequence variation, seven of which have been previously reported to be imprinted in cattle (IGF2, IGF2R, MEG3, NESP55, NNAT, PEG3 and PEG10). The remaining 13 have been reported as being imprinted in at least one other mammalian species. DNA sequence analysis provided a total of 133 putative SNPs detected across 15 of the 20 candidate imprinted genes screened. This data set yielded an estimated SNP discovery rate of one putative SNP for every 333 bp sequenced – a figure that is comparable to other studies involving bovine SNP discovery and validation (Williams et al., Reference Williams, Dunner, Valentini, Mazza, Amarger, Checa, Crisa, Razzaq, Delourme, Grandjean, Marchitelli, Garcia, Gomez, Negrini, Marsan and Leveziel2009).
Of these 133 putative SNPs, 111 SNPs were identified as being both assayable and polymorphic in at least one of the continental cattle populations examined. An additional six SNPs were fixed for alternative alleles in B. taurus and B. indicus samples. Overall, a total of 117 validated SNPs were detected in 44 333 bp of re-sequenced bovine DNA, yielding a validated SNP density estimate of one SNP for every 379 bp sequenced and a putative SNP-to-validated SNP conversion rate of 87.9% (i.e. 117/133). The SNP density reported here is comparable to the estimates previously reported by Heaton et al. (Reference Heaton, Grosse, Kappes, Keele, Chitko-McKown, Cundiff, Braun, Little and Laegreid2001), while the putative SNP-to-validated SNP conversion rate is higher than that reported by Williams et al. (Reference Williams, Dunner, Valentini, Mazza, Amarger, Checa, Crisa, Razzaq, Delourme, Grandjean, Marchitelli, Garcia, Gomez, Negrini, Marsan and Leveziel2009; 56.0%), but lower than the 92.0% conversion rate reported by Van Tassell et al. (Reference Van Tassell, Smith, Matukumalli, Taylor, Schnabel, Lawley, Haudenschild, Moore, Warren and Sonstegard2008).
The presence of polymorphic SNPs unique to European B. taurus, African B. taurus and Indian B. indicus populations, and the identification of six SNPs that display differences between the continental populations, presumably reflects their derivation from geographically and genetically distinct wild progenitors during domestication and their subsequent demographic histories (Bruford et al., Reference Bruford, Bradley and Luikart2003; Bradley and Magee, Reference Bradley and Magee2006; Chen et al., Reference Chen, Lin, Baig, Mitra, Lopes, Santos, Magee, Azevedo, Tarroso, Sasazaki, Ostrowski, Mahgoub, Chaudhuri, Zhang, Costa, Royo, Goyache, Luikart, Boivin, Fuller, Mannen, Bradley and Beja-Pereira2010). In contrast, those SNPs that are polymorphic in more than one of the continental populations analysed may reflect ancient alleles, which were common to some or all possible wild progenitor populations before domestication.
Associations between SNPs in imprinted genes and production traits
Feed is the highest variable cost in beef production and previous studies have shown that improvements in feed efficiency can increase the overall efficiency of beef production (and hence herd profitability) with corresponding decreases in methane (greenhouse gas) production (Hegarty et al., Reference Hegarty, Goopy, Herd and McCorkell2007). Numerous definitions of feed efficiency exist for beef cattle. Until recently, FCR, defined as the average intake divided by the average daily gain, was the definition of choice but the number of studies describing differences among animals in feed efficiency in units of RFI is increasing steadily (Berry, Reference Berry2008). RFI may be defined as the difference between actual and predicted feed intake; lower or more negative RFI values are indicative of more efficient animals (Koch et al., Reference Koch, Swiger, Chambers and Gregory1963). RG, which is based on similar principles of RFI, may be defined as the difference between actual and predicted daily gain (Crowley et al., Reference Crowley, McGee, Kenny, Crews, Evans and Berry2010).
Previous studies have documented considerable heritability in both FCR (0.17 to 0.46) and RFI (0.14 to 0.58) (Fan et al., Reference Fan, Bailey and Shannon1995; Arthur et al., Reference Arthur, Archer, Johnston, Herd, Richardson and Parnell2001; Schnekel et al., Reference Schnekel, Miller and Wilton2004), suggesting that genetic variation contributes to these traits. This assertion has been recently confirmed by two molecular studies in which allele substitution effects at several SNP loci distributed across the bovine genome were shown to be associated with RFI and FCR in B. taurus cattle (Barendse et al., Reference Barendse, Reverter, Bunch, Harrison, Barris and Thomas2007; Sherman et al., Reference Sherman, Nkrumah, Murdoch and Moore2008).
In this context, the analyses presented here revealed 11 and seven SNPs within the RASGRF1 and ZIM2 genes, respectively, that display associations with feed efficiency and growth traits in cattle. Six of the seven assayed ZIM2 SNPs displayed significant (P < 0.05) allele substitution effects on RFI. Allele substitutions at two ZIM2 SNPs (ZIM2_08 and ZIM2_11) tended to be associated (P < 0.10) with reductions in AFI. No significant associations were observed with ADG for any of the ZIM2 SNPs. These data suggest that variation in ZIM2 is associated with feed efficiency in cattle.
In contrast to ZIM2, RASGRF1 SNPs were, in general, associated with improved feed efficiency and increased animal growth. This is aptly illustrated by the allele substitution effects at two intronic RASGRF1 SNPs, RASGRF1_04 and RASGRF1_14, both of which were significantly associated with decreases in FCR and RFI (indicative of improved feed efficiency) and increases in ADG (i.e. animal growth).
It is important to note that the sample size used for the association analyses (n = 97) presented here is small; however, these results are supported by the biological roles of the RASGRF1 and ZIM2 genes. For example, studies of the murine RASGRF1 ortholog (Rasgrf1) show that it is predominantly expressed from the paternal allele in neonatal brain tissue, with expression becoming biallelic during weaning and later into adulthood (Plass et al., Reference Plass, Shibata, Kalcheva, Mullins, Kotelevtseva, Mullins, Kato, Sasaki, Hirotsune, Okazaki, Held, Hayashizaki and Chapman1996; Drake et al., Reference Drake, Park, Shirali, Cleland and Soloway2009). The spatio-temporal expression patterns of this gene have led to suggestions that it may play a role in memory and learning (Giese et al., Reference Giese, Friedman, Telliez, Fedorov, Wines, Feig and Silva2001). Gene knockout studies have shown that mice strains deficient in Rasgrf1 activity display a moderate reduction in body weight (15% to 30%) compared to wild-type strains, suggesting a role for Rasgrf1 in post-natal growth and development (Giese et al., Reference Giese, Friedman, Telliez, Fedorov, Wines, Feig and Silva2001; Clapcott et al., Reference Clapcott, Peters, Orban, Brambilla and Graham2003; Drake et al., Reference Drake, Park, Shirali, Cleland and Soloway2009). Interestingly, the differential Rasgrf1 gene expression levels in the mice models resulted in concordant differential expression of Igf1 (the insulin-like growth factor 1 gene) and molecular components of the growth hormone/insulin-like growth factor 1 (GH/IGF1) axis, which are essential for normal growth and development (Drake et al., Reference Drake, Park, Shirali, Cleland and Soloway2009). The data presented in this study suggest that the bovine RASGRF1 ortholog may similarly play an important physiological role in the growth, development, maintenance and performance of beef cattle, possibly through involvement with the GH/IGF1 axis.
While the function of the ZIM2 gene has not been fully elucidated, it has been previously shown that perturbation of the epigenetic imprints within the PEG3 imprinting cluster – including ZIM2 – can result in tumourigenesis, suggesting that genes within this cluster have a role in cellular proliferation (Van den Veyver et al., Reference Van den Veyver, Norman, Tran, Bourjac and Slim2001). Notably, the imprinting status of ZIM2 is not conserved among different mammalian lineages: ZIM2 has been shown to be paternally expressed in humans and maternally expressed in mice, while in cattle testis ZIM2 was biallelically expressed (Kim et al., Reference Kim, Bergmann, Lucas, Stone and Stubbs2004a). This finding in cattle does not however preclude the possibility of monoallelic expression of ZIM2 in other bovine tissues or during the early phases of bovine development.
Previous genome scans for production trait studies using multi-generational livestock resource populations have incorporated the effect of imprinting and monoallelic expression (de Koning et al., Reference de Koning, Rattink, Harlizius, van Arendonk, Brascamp and Groenen2000 and Reference de Koning, Bovenhuis and van Arendonk2002; Rattink et al., Reference Rattink, De Koning, Faivre, Harlizius, van Arendonk and Groenen2000; Nezer et al., Reference Nezer, Moreau, Wagenaar and Georges2002; Holl et al., Reference Holl, Cassady, Pomp and Johnson2004; Kim et al., Reference Kim, Kim, Dekkers and Rothschild2004b; Karlskov-Mortensen et al., Reference Karlskov-Mortensen, Bruun, Braunschweig, Sawera, Markljung, Enfalt, Hedebro-Velander, Josell, Lindahl, Lundstrom, von Seth, Jorgensen, Andersson and Fredholm2006; Markljung et al., Reference Markljung, Braunschweig, Karlskov-Mortensen, Bruun, Sawera, Cho, Hedebro-Velander, Josell, Lundstrom, von Seth, Jorgensen, Fredholm and Andersson2008; Duthie et al., Reference Duthie, Simm, Perez-Enciso, Doeschl-Wilson, Kalm, Knap and Roehe2009). In this study, however, it was not possible to include parent-of-origin effects in our statistical analyses as the Limousin population used was not multi-generational. Therefore, it is important to note that the analyses presented here may have reduced sensitivity to phenotypic effects for SNPs associated with imprinted genes.
In conclusion, the data presented in this study add support to the growing body of research highlighting a key role for imprinted genes in animal growth and development. Furthermore, this study supports the view that imprinted genes are likely to influence production traits in domestic livestock and should be considered as possible candidates for future marker-assisted selection strategies.
Acknowledgements
The authors would like to thank Prof. Dan Bradley (Department of Genetics, Trinity College, Dublin, Ireland) for supplying DNA samples from African B. taurus and Indian B. indicus animals. The authors also thank two anonymous reviewers for helpful comments and insights. This work was supported by an Irish Department of Agriculture, Fisheries and Food Research Stimulus Fund Grant (RSF 06 406) and an Investigator Programme Grant from Science Foundation Ireland (SFI/01/F.1/B028).