INTRODUCTION
In wheat, most of the effects of environmental variations on yield can be explained by changes in the number of grains per unit area. Fischer (Reference Fischer1985b) found that under potential conditions of growth (i.e. without water or nutrient limitations and free of pests and diseases), the grain number/m2 (GN) is a direct function of incident solar radiation and inversely related to the mean temperature during the spike growth period (SGP) before grain filling. Thus, he defined the photothermal quotient (Q) in wheat as the ratio between the mean incident solar radiation and the mean temperature greater than 4·5°C (developmental base temperature), in the 30 days preceding anthesis (Fischer Reference Fischer1985b). The relationship between GN and Q was originally introduced to explain the effects of the variation in solar radiation and mean temperature (by year, sowing date and location) in the period leading to flowering (Fischer Reference Fischer, Smith and Banks1984, Reference Fischer1985b), without considering the photoperiod effect. Other authors (Midmore et al. Reference Midmore, Cartwright and Fischer1984; Magrín et al. Reference Magrín, Hall, Baldy and Grondona1993; Ortiz-Monasterio et al. Reference Ortiz-Monasterio, Dhillon and Fischer1994; Abbate et al. Reference Abbate, Andrade and Culot1995) have also found strong relationships between GN and Q by comparing cultivars, shading levels, sowing dates, sites or years.
Fischer (Reference Fischer, Smith and Banks1984) also proposed a model at crop field level, where the supply of carbohydrates to the growing spikes before grain filling is the key for determining GN and yield. Although in recent years there has been an animated discussion between Fischer and Sinclair & Jamieson (Sinclair & Jamieson Reference Sinclair and Jamieson2006, Reference Sinclair and Jamieson2008; Fischer Reference Fischer2007, Reference Fischer2008) on the importance of GN in yield determination, this approach is very useful for interpreting many effects of the environment, the agronomic management and the genotype on yield. According to Fischer (Reference Fischer, Smith and Banks1984), wheat GN can be considered as the product of spike dry weight at the beginning of grain filling (start of dry weight accumulation; SDW) and the number of grains per unit of SDW, and is an indicator of spike fertility (i.e. a spike fertility index). SDW is the product of the spike growth rate (SGR) and the duration of the SGP. This phase occurs during a period leading to grain filling; at low latitudes (27°N) in Mexico it was initially defined as a period of 30 days (c. 300°Cd above 4·5°C) before anthesis, in which daily spike growth weight accumulation exceeds 0·05 of total weight accumulation in the crop or from the appearance of the penultimate leaf until anthesis (Fischer Reference Fischer1985b). The SGP was later considered as the interval during which the spikes achieved 0·05–1·00 of dry weight accumulated by day 7 after anthesis, excluding grain weight (Abbate et al. Reference Abbate, Andrade, Culot and Bindraban1997; Fischer Reference Fischer2008). SGR is the product between the crop growth rate (CGR) and the proportion of crop growth that is partitioned to the spike. Abbate et al. (Reference Abbate, Andrade, Culot and Bindraban1997, Reference Abbate, Lázaro, Andrade, Kohli and Martino1998a) analysed wheat crops without water or nutrient limitations in Balcarce, Buenos Aires Province, Argentina (38°S), and confirmed Fischer's (Reference Fischer, Smith and Banks1984) results in a mid-latitude area. Fischer's (Reference Fischer, Smith and Banks1984) results also apply largely to crops deficient in N or P (Fischer Reference Fischer1993; Abbate et al. Reference Abbate, Andrade and Culot1995; Demotes-Mainard & Jeuffroy Reference Demotes-Mainard and Jeuffroy2001; Lázaro et al. Reference Lázaro, Abbate, Cogliatti and Andrade2010).
Q integrates the effects of intercepted solar radiation on CGR and temperature on the developmental rate (reciprocal of duration). Hence, as defined, this is an index of total growth during SGP that finally determines SDW shortly before grain filling (Fischer Reference Fischer1985b; Abbate et al. Reference Abbate, Andrade, Culot and Bindraban1997). Q is a simple but useful model with a physiological basis, which assumes that the GN components, such as partitioning to spikes and spike fertility index, do not change between cultivars. The main cultivar effect in the early works mentioned above was the difference between tall and short wheats (Fischer Reference Fischer, Smith and Banks1984), explained in terms of the differential dry weight partitioning to the growing spike. Although the discrepancy between some results (cf. Fischer Reference Fischer, Smith and Banks1984; Sayre et al. Reference Sayre, Rajaram and Fischer1997) may suggest the existence of differences in responses to Q between cultivars, only Ortiz-Monasterio et al. (Reference Ortiz-Monasterio, Dhillon and Fischer1994) reported some cultivar differences. Previous investigations have not analysed in depth whether the responses of GN to Q differ between wheat cultivars, nor the cause of the eventual variation. The variation could be due to changes in any of the GN components. In addition, most of the datasets previously analysed were obtained with cultivars released before 1980. Abbate et al. (Reference Abbate, Andrade, Lázaro, Bariffi, Berardocco, Inza and Marturano1998b) found that the differences in GN between high-yielding Argentine varieties were associated with the spike fertility index. This could have significant effects on the relationship between GN and Q between cultivars.
Thus, it is clear that cultivars could differ markedly in their responses to Q. Quantifying the differences between cultivars in this relationship and their origin is important to allow this approach for determining GN to be used more thoroughly. This would be very useful both for genetic improvement and for growth and yield crop modelling.
MATERIALS AND METHODS
Crop management and experimental design
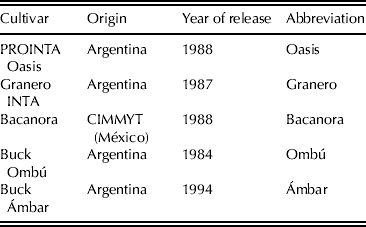
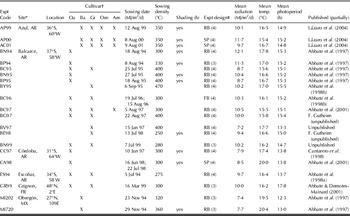
The responses of GN to Q of four spring bread wheats (PROINTA Oasis, Granero INTA, Bacanora and Buck Ombú) and one spring durum wheat (Buck Ámbar) were compared. The origin and year of release of these cultivars are presented in Table 1. A wide set of data for these cultivars (Table 2) was taken from different experiments conducted in Azul, Balcarce, Córdoba and Escobar (Argentina), Grignon (France) and Cd. Obregón (Mexico); only treatments with availability of water and fertilizer sufficient to ensure no growth limitations and adequate control of pests and diseases were selected. The plots were >5 m long, with seven rows 0·15–0·2 m apart. Some experiments included shading treatments during the SGP, which reduced the incident radiation on crop during the SGP by 0·4–0·6; thus, different values of Q were obtained for the same sowing date and year. All the selected treatments had a minimum dataset, which included: anthesis date, intercepted radiation, SDW, GN and yield.
Cultivars evaluated in the present study

Characteristics of experiments used to analyse the relationship between GN and photothermal quotient, ordered by site and sowing year
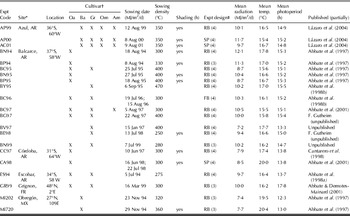
* AR, Argentina; MX, Mexico; FR., France.
† Oa, PROINTA Oasis; Ba, Bacanora; Om, Buck Ombú; Am, Buck Âmbar.
‡ RB, randomized complete blocks; FB, factorial in complete blocks; SP, split-plot in complete blocks (cultivars as main treatment), number of replications in parentheses.
Experiments carried out in Azul (Argentina) (Table 2) had additional detailed information on the components of GN. In these experiments, four cultivars (Granero, Bacanora, Ombú and Ámbar) were compared. In AP00 (see Table 2 for codes), the experimental design was a randomized complete block with four replications, while in AP99 and AP01 the experiments combined four cultivars (as main treatments) and two radiation levels (shade and control as sub-treatments) in a split-plot design with four complete randomized blocks. The soil was a loamy, illitic thermic, typic Argiudoll, with 4·9 g organic carbon/kg soil in the top 0·25 m. The experiments were irrigated, and fertilized with P and N to ensure adequate water and nutrient supply. The experiments were free of pests and diseases. The experimental unit consisted of a plot (or subplot) seven rows wide (0·2 m apart)×6·0 m long.
Plant sampling and measurements
Development
In all the experiments, the emergence date was considered as the date when half of the plants had their first leaf emerged to c. 20 mm. Anthesis date was defined as the day on which 0·50 of the spikes showed at least one spikelet with an extruded anther. The proportion of spikes at anthesis was recorded in 40–50 spikes per plot every 2–3 days, and the date of 0·5 anthesis was calculated by linear interpolation of anthesis proportion on calendar time.
In the experiments carried out in Azul, the SGP was computed as in Abbate et al. (Reference Abbate, Andrade, Culot and Bindraban1997), i.e. the interval during which the spikes achieved 0·05–1·00 of dry weight accumulated by day 7 after anthesis, excluding grain weight. Linear interpolation of SDW through time was used to estimate the beginning of spike growth. The development rate (DR) during the SGP was calculated as the reciprocal of the duration in days of the SGP. Assuming a linear relationship between DR and mean temperature, the thermal time (TT) required for the developmental event to occur and the temperature at which the DR equals zero (base temperature, T b) were estimated for each cultivar. TT was calculated as the inverse of the slope of the relationship between DR and mean temperature and T b as the negative quotient between the intercept and the slope (Ritchie & NeSmith Reference Ritchie, Nesmith, Hanks and Ritchie1991). The relationship between TT and the photoperiod was analysed for the cultivars with more than five data in natural radiation, i.e. Bacanora, Oasis and Granero. The photoperiod value used was the mean photoperiod between the beginning and the end of the SGP of each treatment.
Crop dry weight
In all the experiments, crop and spike dry weights were measured at the end of the SGP (7 days after anthesis). In addition, the experiments carried out in Azul included two crop samplings around the beginning of the SGP. The sample size was four to five innermost rows wide and 0·4–0·6 m long before anthesis and 0·6–0·7 m long after anthesis. A distance of at least 0·35 m was left as a border between adjacent samples. A subsample of shoots was dissected into leaf lamina, stems (including leaf sheaths) and spikes, even when they were small (length >5 mm). In a subsample of spikes, the immature grains were removed to determine the dry weight of non-grain spikes. All the weights are expressed on a dry matter basis.
Intercepted photosynthetically active radiation
Except for experiment ES94, the daily proportion of incident photosynthetically active radiation (PAR=0·5 of total radiation) intercepted by the crop (IPAR) was calculated as (1−PARi/PARo), where PARi was the incident PAR just above the lowest layer of dead leaves and PARo was the incident PAR above the crop canopy. The values of PARi and PARo were measured with a line quantum sensor of length equal to four inter-rows. The measurements were taken at midday, placing the sensor perpendicularly to the rows. Approximately one recording per metre of plot was taken. IPAR was measured every 10–15 days from the beginning of spike growth. IPAR between measurements was obtained by linear interpolation over time. IPAR (MJ/m2/d) for each day was calculated as the product of the corresponding daily IPAR fraction and daily incident PAR. In experiment ES94, IPAR during this period was assumed to be 0·90 of PARo (Abbate et al. Reference Abbate, Andrade, Lázaro, Bariffi, Berardocco, Inza and Marturano1998b).
Yield and components
After physiological maturity, plots were hand-harvested and all spikes of the sample were threshed. The grains were winnowed, then dried and weighed to determine yield. A grain subsample was taken and manually cleaned to determine mean grain dry weight by counting, drying and weighing one group of 1000 grains. The GN was calculated by dividing yield by the individual grain dry weight.
Other measurements and estimations
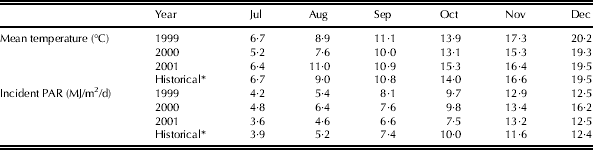
Weather records, on a daily basis, were obtained from a meteorological station not further than 2 km from the experimental sites. The daily total incident radiation was estimated only in experiment ES94 (Table 2), from daily relative sunshine hours and total incident radiation above the atmosphere, using the relationship obtained by Magrín et al. (Reference Magrín, Hall, Baldy and Grondona1993) as calculated by Abbate et al. (Reference Abbate, Andrade, Lázaro, Bariffi, Berardocco, Inza and Marturano1998b). Mean temperature and incident PAR between July and December 1999, 2000 and 2001, and historical values in Azul are presented in Table 3.
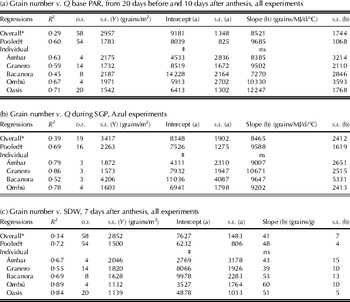
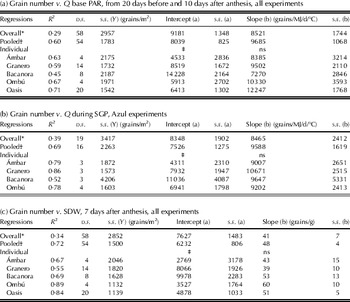
Comparisons of linear relationships (Y=a+bX) of five wheat cultivars: Buck Ámbar, Granero INTA, Bacanora, Buck Ombú and PROINTA Oasis, between GN (Y) and different independent variables (X): (a) photothermal quotient (Q) base PAR, from 20 days before and 10 days after anthesis, (b) Q during the SGP measured and (c) spike dry weight measured 7 days after anthesis (SDW); for (a) and (c) data from all experiments of Table 2, and for (b) data from Azul experiments (Table 2)
s.e., standard error.
* Regression carried out with all the data, independently of the cultivar.
† Regression adjusting a straight line for each cultivar.
‡ Significant differences between intercept or slope of cultivars regressions (P⩽0·05); ns, non-significant differences between intercept or slopes of cultivars regressions (P>0·05).
For the experiments carried out in Azul, crop dry weight at the beginning of the SGP was estimated by linear interpolation of crop dry weight through time. During the SGP, mean growth rates (g/m2/d) of crop (CGR) and spikes (SGR) were calculated as the differences in dry weight divided by the number of days between sampling, and mean dry weight partitioning to spikes was calculated as SGR/CGR and expressed as a proportion. Radiation-use efficiency (RUE, g/MJ) was calculated as the ratio between CGR and the mean IPAR during the SGP.
The photothermal quotient (Q, MJ/m2/d°C) was calculated as

where T m is the mean air temperature and the IPARm is the mean intercepted PAR, during the period from 20 days before to 10 days after anthesis (Abbate et al. Reference Abbate, Andrade and Culot1995) for all the data presented in Table 2, while for the experiments carried out in Azul, Q was also calculated during the SGP measured for each plot.
Statistical analyses
Differences between treatment means in each experiment were tested when the analysis of variance revealed significant effects (Steel & Torrie Reference Steel, Torrie, Steel and Torrie1989).
All regressions were calculated with the data of the mean of each treatment of each cultivar. Overall regressions were computed through all data without distinction of cultivars (general regression) or by deriving a straight line for each cultivar (individual regression). When multiple comparisons of regression coefficients (Ostle Reference Ostle and de la Serna Valdivia1974) revealed no significant differences between slopes or intercepts, the pooled mean slope or intercept was calculated by weighting each slope or intercept for the sum of squares of their independent variables (pooled regression). The critical level of significance used was P<0·05 in all statistical tests.
RESULTS
Relationships between grain number and Q and their components
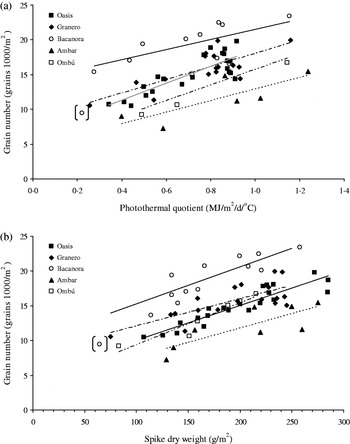
Considering all the cultivars, the yield explored ranged from 244 to 863 g/m2, grain number from 7265 to 23 400/m2 and photothermal quotient from 0·22 to 1·24 MJ/m2/d°C (Fig. 1a).
Number of grains per unit of area as a function of (a) the photothermal quotient (Q) base PAR, from 20 days before to 10 days after anthesis and (b) spike dry weight at the end of the growth period; for five wheat cultivars: PROINTA Oasis, Bacanora, Granero INTA, Buck Ombú and Buck Ámbar; data from experiments of Table 2. The Bacanora datum in brackets was excluded from the regressions. Parameter regressions are shown in Table 3.

The GN responses of all cultivars to Q, for the range explored, were straight lines (Fig. 1a, see R 2 in Table 3a). Nevertheless, one datum of Bacanora, which showed a Q value smaller than 0·20 MJ/m2/d/°C, was excluded from the analysis because the relationship changed when including this smaller Q value, as observed in previous works by Thorne & Wood (Reference Thorne and Wood1987) and Abbate et al. (Reference Abbate, Andrade, Culot and Bindraban1997). The pooled regression (i.e. the regression adjusting a straight line for each cultivar) produced a significantly better fit than the overall regression (R 2=0·60 v. 0·29; P<0·024; Table 3a) and the lines differed between cultivars due to the different intercepts, with changes that were not significant in the slope (Fig. 1a; Table 3a).
The data obtained in Azul allowed a more detailed analysis of the relationship between GN and Q and of the components that affect it. In this case, Q was calculated during the SGP of each treatment (Table 3b). The regressions obtained for this site did not improve the adjustment achieved with all the data; again, the pooled regression produced significantly better fit than the overall regression and the lines differed between cultivars due to different intercepts, without changes in the slope (Table 3b).
The relationship between GN and Q could be considered as the result of two relationships: (i) the relationship between GN and SDW, and (ii) the relationship between SDW and Q. Differences between cultivars were found in the relationships between GN and SDW (P⩽0·001) using all the data (Fig. 1b; Table 3c). The cultivars differed in the intercept (P⩽0·001) but not in the value of the slope (pooled slope: 48 grains/g; P=0·644; Table 3c). On the other hand, neither the responses of SDW to Q (P=0·081) (SDW=39(±14·7)+176(±18·0)Q; R 2=0·84; d.f.=58; P⩽0·001) nor the relationships between yield and Q (R 2 general=0·43; d.f.=58), with a slope of 411±(61·5) g/m2 per unit Q and an intercept of 262±(47·6) g/m2, presented differences between cultivars.
Components of grain number
The differences in GN responses could be due to modifications in any of the eight following components: the two main components (i) SDW and (ii) spike fertility index or in SDW subcomponents (iii) the duration of the SDP and (iv) the SGR; the latter is defined by (v) CGR and the (vi) proportion assigned to spike (partitioning). Finally, the CGR is originated from (vi) intercepted solar radiation and (viii) RUE.
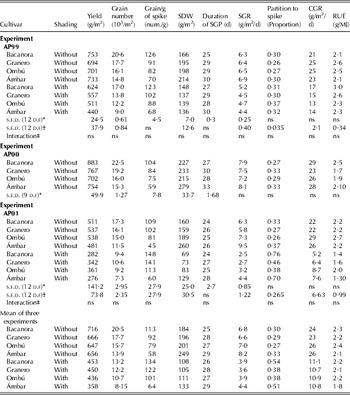
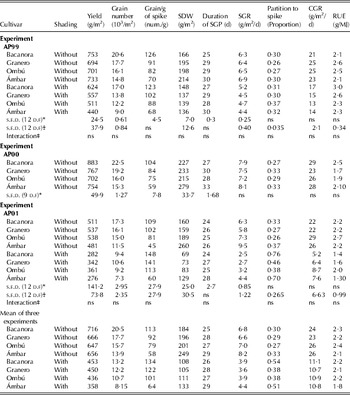
In the experiments carried out in Azul, each of the components of the GN was determined. Table 4 presents the results obtained, with and without shading, for four cultivars (Bacanora, Granero, Ombú and Ámbar). SDW, spike fertility index, SGR and duration of the SGP presented significant variation between the cultivars. In contrast, no differences in partitioning, CGR, RUE (Table 4) or intercepted radiation were detected. The shading treatment reduced yield, GN, SDW, SGR, CGR, but the duration of the SGP and RUE were not affected, while spike fertility index and partitioning were greatest with shading (Table 4). The shading×cultivar interaction was significant for the spike fertility index and SGR, but these interactions were due to changes in the magnitude of responses rather than to changes in the order of cultivars (no cross interaction). SDW varied between cultivars: Ámbar had the highest SDW due to both the duration of the SGP and SGR, which were high. Considering all the cultivars, SDW was highly and positively correlated with SGR (R 2=0·93; d.f.=18; P<0·001) but not with SGP (R 2=0·24; d.f.=18; P=0·028). In turn, SGR was strongly correlated with CGR (R 2=0·86; d.f.=18; P<0·001) but not with partitioning. Differences in partitioning between cultivars were not significant and shading increased partitioning to spikes by 33% (average of all cultivars) with respect to natural radiation (Table 5). Moreover, CGR was associated with IPAR (R 2=0·83; d.f.=18; P<0·001) and not with RUE (R 2=0·26; G.F.=18; P=0·022).
Yield, GN and components: grain number per unit of spike weight (excluding grain weight) and spike dry weight (SDW) at the end of the SGP; SGR; partitioning to spikes; CGR; RUE during the SGP in experiments AP99, AP00 and AP01
* Standard errors of mean differences to compare cultivar treatments at the same levels of shading.
† Standard errors of mean differences to compare shading in the same or different cultivar.
‡ Interaction: shading×cultivar. ns, not significant (P>0·05).
Mean temperature and incident PAR between July and December 1999, 2000 and 2001 and historical values at Azul

* Mean of 1994–2001 period (Regional Center of Agrometeorology, FA, UNCPBA).
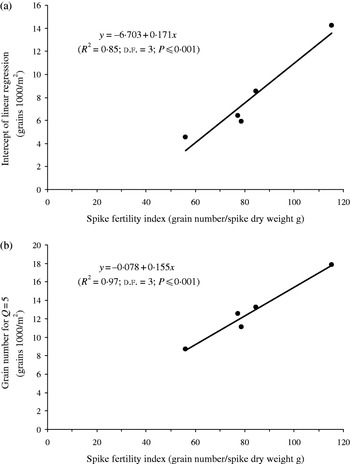
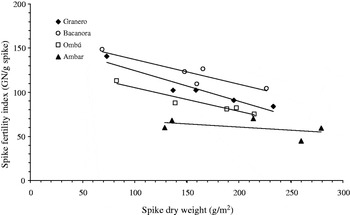
Bacanora was the cultivar that always showed highest spike fertility index (113 grains/g, mean of three treatments without shading), followed by Granero, Ombú and Ámbar (Table 4). The spike fertility index was the GN component that better associated with the intercepts of the relationships between GN v. Q of each cultivar relationship (R 2=0·85; P=0·003; Fig. 2a); no other component was strongly associated. The spike fertility index also was strongly associated with a fixed GN (i.e. Q=0·5) estimated from individual GN v. Q regressions for each cultivar (Fig. 2b) but also negatively correlated with SDW (Fig. 3) and grain weight.
Intercepts of linear regressions between (a) GN and Q or (b) grain number for Q=0·5, of the five wheat cultivars: Buck Ámbar, Granero INTA, Bacanora, Buck Ombú and PROINTA Oasis as a function of the spike fertility index. The spike fertility indexes are the general means of each cultivar from data in Fig. 1. The standard errors (s.e.) of the intercept are shown in Table 3a; and the s.e. of the mean spike fertility index of each cultivar were between 8·3 and 19·3 grains/g spike.

Spike fertility index (grains/g spike) as a function of dry weight of spikes by the end of their growth period from Azul experiments. Linear regressions are: Bacanora: y=165(±11·52)−0·28(±0·07) x; R 2=0·84; D.F.=3; (P=0·028). Granero: y=159(±10·79)−0·35(±0·06) x; R 2=0·91; D.F.=3; (P=0·012). Ombú: y=131(±7·48)−0·27(±0·04) x; R 2=0·92; D.F.=3; (P=0·009). Ámbar: y=75(±15·20)−0·07(±0·07) x; R 2=0·25; D.F.=3; (P=0·393).

The duration of the SGP varied between cultivars: in Bacanora, it was shorter (25 days, mean of three experiments), while in Ámbar, the longest duration of the SGP observed was 29 days. This period was also different between experiments: in AP01 it was 25 days (mean of all cultivars), whereas in AP99 and AP00, it was 28–29 days. The shortest SGP in 2001 may have originated in the high mean temperature recorded at the beginning of the SGP (October, Table 5), due mainly to a considerable increase in the minimum temperature (3·5°C) rather than to an increase in the maximum temperature.
Control of duration of the SGP
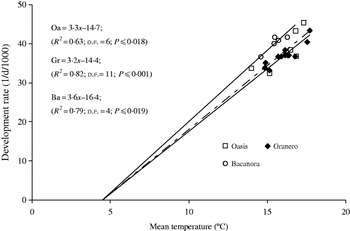
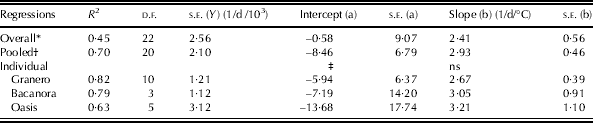
Since temperature is used to estimate the duration of SGP in the calculation of Q, the relationship between those two variables was analysed, considering the whole dataset with natural temperature and radiation. The pooled regression between the inverse to the duration of SGP (i.e. DR) and the mean temperature of the period (T m) was statistically significant (R 2=0·37; P<0·001; d.f.=31). However, the relationship was not significant for two of the five cultivars studied (Ámbar and Ombú). These two cultivars had only 3–4 observations, with little variation in T m (1·1°C), while for the remaining cultivars the number of observations was between 5 and 12 and the variation in T m was from 2·3 to 3·3°C. The association between DR and T m in Oasis, Granero and Bacanora (i.e. excluding Ámbar and Ombú) was highly significant (R 2=0·70; d.f.=20; P<0·001; Table 6), with T b between 2·2 and 4·3°C, which were statistically different. However, if these differences in T b are disregarded and the traditional value 4·5°C (Fischer Reference Fischer1985b) is used, then the regression lines fitted by each individual cultivar (Fig. 4) are also highly significant. According to this last fit, the TTs (with T b=4·5°C) during the SGP were 313, 305 and 274°Cd for Granero, Oasis and Bacanora, respectively. The TT in Bacanora was statistically lower than that in the other cultivars. These data confirm the short duration of SGP for Bacanora in Table 4.
DR as a function of mean temperature of SGP, for three cultivars: PROINTA Oasis (− · − Oa), Bacanora (- - Ba) and Granero INTA (— Gr); data of various experiments (shown in Table 2). Regressions obtained using the same base temperature (T b) (value of x when y=0; T b=4·5°C) for all cultivars.

Comparisons of linear relationships (Y=a+bX) between DR (y) and mean temperature (x) during SGP of three wheat cultivars: Granero INTA, Bacanora and PROINTA Oasis

* Regression carried out with all the data, independently of the cultivar.
† Regression adjusting a straight line for each cultivar.
‡ Significant differences between intercept or slope of cultivars regressions (P⩽0·05); ns, non-significant differences between intercept or slopes of cultivars regressions (P>0·05). s.e.: Standard error.
Assuming the bi-linear model (with a threshold photoperiod, after which the SGP is minimal) used by Miralles et al. (Reference Miralles, Spinedi, Abeledo, Abelleyra, Buck, Nisi and Salomón2007), the relationship between TT and the photoperiod of Bacanora, Granero and Oasis was not significant. Also, the possibility of photoperiodic additive effects to temperature was considered according to the model proposed by Summerfield et al. (Reference Summerfield, Roberts, Ellis and Lawn1991), but the addition of this term was not significant either.
DISCUSSION
Grain number and photothermal quotient
There was a strong linear correlation between GN and Q of all cultivars (Fig. 1a, Table 3a). A very similar result was obtained when the SGP was directly measured (in experiments at Azul; Table 3b) instead of estimating it using temperature. These similarities show that improving the precision of the determination of SGP does not contribute to important benefits regarding the traditional use of Q, possibly because the duration of the SGP of the cultivars studied (Table 4) was very close to the interval used in the calculation of Q (i.e. 30 d for sprint wheats, Table 7). Fischer (Reference Fischer1985b) found some discrepancies in the relationship between GN and Q with different groups of data: the cultivars that had better adjustment between GN and Q were those relatively less sensitive to photoperiod and vernalization.
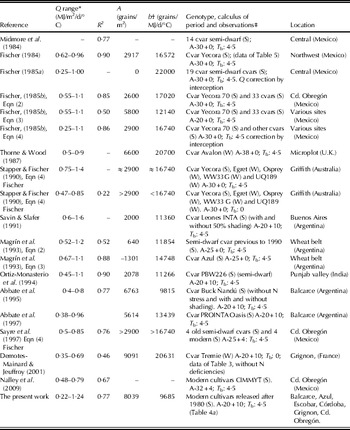
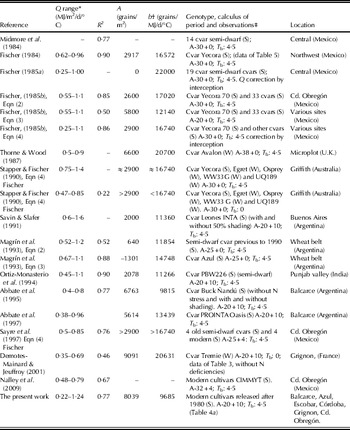
Photothermal quotient (Q, base PAR) determination coefficient and equation parameters (GN=a+b Q) by estimation of GN according to different bibliographic reports without evident N limitations for growth
* Reported Q base total radiation (QT) recalculated to Q base PAR (QPAR) as QPAR=QT×0·5.
† Reported sloped base total radiation (ST) recalculated to sloped base PAR (SPAR) as SPAR=ST×2.
‡ A-: day before anthesis, +: day after anthesis. T b: base temperature (°C). S, spring cultivar; W, winter cultivar.
In the present study, the Q values during the SGP were in the range of those obtained by other authors (Table 7). In natural conditions in wheat, Q values are between 0·25 MJ/m2/d/°C, in a low latitude site and with crops affected by incomplete solar interception (Poza Rica, México), and 1·6 MJ/m2/d/°C in Buenos Aires, Argentina (Table 7). In the Argentinean wheat belt, Magrín et al. (Reference Magrín, Hall, Baldy and Grondona1993) analysed semi-dwarf cultivars prior to 1990 and found Q values of 0·5–1·2 MJ/m2/d/°C. Some studies included treatments of decreasing incident PAR by means of crops shadowed with nets, and obtained an IPAR level similar to that obtained in the present experiments. For example, for crops without nutritional stress and with and without shading during the SGP, Abbate et al. (Reference Abbate, Andrade and Culot1995) reported Q values of 0·4–0·8 MJ/m2/d/°C.
Table 7 displays the regressions between GN and Q obtained by other authors without strong evidence of nitrogen limitations for crop growth. The slope ranged from 9685 to 22 000 grains per unit of Q. To estimate potential yields, Fischer (Reference Fischer, Villareal and Klatt1985a) suggested a Q relationship with intercept 0 and a slope of 22 000 grains/m2 per unit of Q, calculated during 20–30 days before anthesis and corrected by an incomplete intercepted radiation. This relationship for semi-dwarf cultivars was based on the variations given by sowing date and sites of central Mexico (latitude 20°N). This slope value is the largest in Table 7 for spring wheats, although it does not differ from that found by Thorne & Wood (Reference Thorne and Wood1987) or Demotes-Mainard & Jeuffroy (Reference Demotes-Mainard and Jeuffroy2001) with winter wheat. Excluding the regressions of winter wheats and the exceptionally high slopes of Fischer (Reference Fischer, Villareal and Klatt1985a), the mean slope was 13 040 grains/m2 per unit of Q. The pooled slope for the five cultivars analysed in the present study was 9685(±1068) grains/m2 per unit of Q, a value that is lower than that mentioned above. It is clear then that the cultivars used in the present work (Table 1) are less responsive.
However, the relationships in previous studies show a mean intercept of 3549 grains/m2 but differ notably between authors: from −1301 to 9091 grains/m2. Only one value was negative (Magrín et al. Reference Magrín, Hall, Baldy and Grondona1993), which could be because the Q data were not corrected for incomplete interception of radiation. This lack of correction could distort the relationship between GN and Q, causing a decrease in the intercept and an increase in the slope, since low Q values would be more affected than high ones. However, most of the regressions presented in Table 7 have positive intercepts. This does not have any biological meaning, but the regressions were obtained in experiments on crop conditions which are never extreme Q values. The average of intercepts obtained in the present work (8039 grains/m2) was similar to the highest obtained in previous reports (Table 7).
The Q equation widely used for semi-dwarf cultivars is Eqn (4) (Fischer Reference Fischer1985b) (Table 7). If the intercept value of those original linear regressions (2900 grains/m2) is compared with that obtained with the present data, it is demonstrated that all cultivars, including durum wheat (Table 3a), have a greater intercept than the average of traditional semi-dwarf cultivars (Eqn 4; Fischer Reference Fischer1985b). While the Q regressions in Table 7 seem to have very different parameters, the estimation of GN for a given Q (Q=0·5 MJ/m2/d/°C, base PAR) may be more useful when comparing equations in natural conditions. In this respect, the experiments with old semi-dwarf cultivars in Mexico (Fischer Reference Fischer, Villareal and Klatt1985a), Buck Ñandú, an old semi-dwarf Argentinean cultivar (Abbate et al. Reference Abbate, Andrade and Culot1995), and Ombú, the oldest cultivar used in the present study (Table 1), are in the range of 11 000–11 870. In Argentina (Savin & Slafer Reference Savin and Slafer1991; Magrín et al. Reference Magrín, Hall, Baldy and Grondona1993) and India (Ortiz-Monasterio et al. Reference Ortiz-Monasterio, Dhillon and Fischer1994), in works carried out with old semi-dwarf cultivars but without correction by incomplete interception, the GNs were lower (6673 and 8264, respectively). In European wheat (Thorne & Wood Reference Thorne and Wood1987; Demotes-Mainard & Jeuffroy Reference Demotes-Mainard and Jeuffroy2001), mean GN value was higher (18 178) but not much greater than 17 863 (Bacanora) analysed in the present work (Table 3a). Granero and Oasis had an intermediate value, mean 12 758, between old semi-dwarfs and European cultivars. Sayre et al. (Reference Sayre, Rajaram and Fischer1997) compared the GN estimated by the original regression proposed by Fischer (Reference Fischer1985b, Eqn 4) with old (similar to that used originally by Fischer Reference Fischer1985b) and new wheat cultivars released by CIMMYT. Sayre et al. (Reference Sayre, Rajaram and Fischer1997) noticed that both the new and the old cultivars had a GN positioned above the original regression. This was largely attributed to improvements in agronomic management. Although an increase in efficiency of new cultivars was also mentioned, Sayre et al. (Reference Sayre, Rajaram and Fischer1997) did not indicate if the slope and/or intercept were modified in new cultivars of CIMMYT. Following a similar reasoning to that used by Sayre et al. (Reference Sayre, Rajaram and Fischer1997), the differences could indicate that the management of the present experiments was better than that applied originally in the CIMMYT. However, when comparing the cultivars studied in the present work, under similar management conditions, differences in responses to Q were found in the intercept of the relationship, which remained on the same slope. In this way, the differences in behaviour were intrinsic to the cultivars and not caused by the environment and it is undeniable that there is a cultivar-specific effect on GN/Q relationships.
Estimation of GN in function of Q using a hypothetical cultivar of reference
One advantage of estimating GN or yield in function of Q is that climatic (radiation and mean temperature) and crop (IPAR and anthesis date) data are relatively simple to obtain. Q allows estimating the effects of modifying sowing dates, sites, or differences between years caused by PAR, temperature or modification of IPAR during the SGP. These estimates are useful for many of the decisions taken at the field production level, or at a local or regional scale. However, the existence of differences in responses to Q between cultivars hinders their use to estimate the GN of non-calibrated cultivars. Nevertheless, it would be feasible and useful to define parameters of equation of a hypothetical reference cultivar, in an equivalent criterion to the evapotranspiration of reference. Indeed, a GN was estimated from a hypothetical reference cultivar (GNo) by means of Eqn (2) below, which arises from the average slope and intercept from Table 7, excluding notably high slopes (Fischer Reference Fischer, Villareal and Klatt1985a; Thorne & Wood Reference Thorne and Wood1987; Demotes-Mainard & Jeuffroy Reference Demotes-Mainard and Jeuffroy2001):

An additive coefficient for each cultivar (CCV; Eqn 3) to correct the difference between the real GN of a cultivar in particular and the value calculated for GNo from the regression of reference is also introduced, so that Eqn (2) remains as:


where GNm is the mean of the GN observed and Q m is the corresponding mean of Q. This GNo would allow predicting an increase or a decrease in GN induced by environmental variations. Also, in order to calculate the GN of a certain cultivar, it is feasible to establish an additive CCV (Eqn 3) that can correct the difference between the real GN of a cultivar in particular and the value calculated for GNo from the regression of reference. As an example, the CCV of the cultivars studied were: −3501, −148, 1687, 1734 and 5955 for Ámbar, Ombú, Granero, Oasis and Bacanora, respectively. When estimating GN by applying Eqns (1) and (3), GN=(4+13Q)×103+CCV and for the five cultivars studied produced an estimation error of ±1953 grains/m2 (13%; d.f.=54), while the use of the regression originated by pondering the individual regressions of the five cultivars (Table 3a) produced an error of ±1783 grains/m2 (12%; d.f.=54), not much lower than that obtained with the method of reference cultivar. Therefore, any non-adjusted cultivar (e.g. for a new cultivar released to the market) could have a regression to estimate GN, calculating CCV from few GN and Q available data. Upon incorporating a large number of data, CCV can be estimated with high precision. Therefore, when there are enough data for the cultivar of interest, its particular regression can be adjusted. Equation (1) would also allow the effect of the cultivar of reference on GN to be calculated, when sowing dates, sites or years cause it to vary in solar radiation, temperature or growth conditions that modify the IPAR during the SGP.
It is appropriate to point out that the use of Q to estimate GN has its limitations, i.e. if the temperature is either very hot (up to 26°C) or very cold (between 10 and −4·5°C), the relationship is no longer linear (Fischer Reference Fischer, Villareal and Klatt1985a; Wall Reference Wall, Kohli and Martino1998). However, at very low Q values, the linear regression may not be reliable because, as happens in the relationship between GN and IPAR at very low IPAR values, the response of GN is not maintained (Abbate et al. Reference Abbate, Andrade, Culot and Bindraban1997). The positive intercepts suggest that this might be the case. Additionally, it should be borne in mind that Q is a reliable estimator of GN in the absence of environmental limitations, i.e. in potential conditions of growth or near them. As a simple example, it could be mentioned that the equation that relates GN with Q could be used when fast estimations of yield potential (using the mean weight/grain for each cultivar) are required to quantify the differences between this potential yield and actual yields, affected by droughts, diseases, etc. The mean grain weights of cultivars were 35·5, 35·2, 32·7, 41·8 and 47·0 mg for Oasis, Granero, Bacanora, Ombú and Ámbar, respectively. The GN estimated from the equations proposed multiplied by the grain weight of each cultivar produced an error of ±99·69 g/m2 (0·6%; d.f.=54) in yield estimation. The differences between cultivars in yield estimations were less evident than in GN estimations.
Q is based on the temperature effect on the DR, and the association between DR and T m was high (R 2=0·70; d.f.=20; P<0·001; Table 6) with a T b between 2·2 and 4·3°C. However, Ritchie & NeSmith (Reference Ritchie, Nesmith, Hanks and Ritchie1991) demonstrated the problems associated with accuracy in T b determination from field studies due to lack of data near the origin. The T b value usually used in wheat, when considering development stages from crop emergence, is 0°C (Ritchie & NeSmith Reference Ritchie, Nesmith, Hanks and Ritchie1991). However, the values obtained are consistent with the idea that the T b increases with the successive development stages (Fischer Reference Fischer1985b). The T b values calculated for the three cultivars analysed are all above 0 and very close to the 4·5°C proposed by Fischer (Reference Fischer1985b) for this particular development phase. However, differences between cultivars in the duration of the SGP reached −11% (for Bacanora with respect to other two cultivars analysed) using the traditional value of 4·5°C (Fig. 4).
Another factor that may affect the duration of SGP is photoperiod, since effects were detected in early reproductive stages, prior to anthesis (Wall Reference Wall1979). In Argentinean cultivars, Miralles et al. (Reference Miralles, Spinedi, Abeledo, Abelleyra, Buck, Nisi and Salomón2007) reported effects on TT from the first node detectable to anthesis. This phase is larger than the SGP and includes it. The photoperiod effect could be especially marked in the dataset now analysed, because a large part of the temperature variation was obtained throughout sites located at different latitudes. The photoperiod for Bacanora ranged from 12·1 to 15·5 h, while for Granero and Oasis it was higher, from 13·3 to 17·6 h. This range corresponds to that which can be found in most wheat regions throughout the world. The critical photoperiod defined by Miralles et al. (Reference Miralles, Spinedi, Abeledo, Abelleyra, Buck, Nisi and Salomón2007), i.e. 14·4 h, is in the middle portion of the range of photoperiods analysed in the present work. However, there were no photoperiodic effects on the SGP duration in any of the cultivars analysed. Whitechurch (Reference Whitechurch2005) analysed a wide group of Argentine cultivars, including Oasis and Granero in two sowings dates. Since in these experiments the TT between the first node detectable and anthesis was slightly variable between sowing dates, it could be inferred that the photoperiodic effect was very low at this phase. The results of the present study reinforce the idea that these two cultivars and also Bacanora are not sensitive to the photoperiod specifically during the SGP. However, in both field studies the lack of response to the photoperiod could be masked by opposite effects due to vernalization requirements. Although for Oasis, Granero and Bacanora, i.e. cultivars with great amount of data and variations in sowing dates, sites or years, only a significant effect of the temperature was detected. In summary, a significant effect of temperature on the duration of the SGP or their inverse, the rate of development, was evident, but none of the relationships that included the photoperiod improved the estimate of SGP achieved only through mean temperature.
Grain number, spike dry weight and photothermal quotient
It is known that GN varies depending on solar radiation and temperature and also that GN is associated strongly with SDW at the end of the SGP (Fischer Reference Fischer, Smith and Banks1984; Abbate et al. Reference Abbate, Andrade, Culot and Bindraban1997). No single relationship between GN and SDW between cultivars was obtained (Fig. 1b, Table 3c). The differences in regressions between cultivars, in the same way as in the relationship between GN and Q, reflect the differences in spike fertility index (Fig. 3).
Values much larger than 0 in intercepts of the regression between GN and SDW or Q (Table 3) may provide evidence for the existence of a bilinear (or curvilinear) relationship such as that proposed by Abbate et al. (Reference Abbate, Andrade, Culot and Bindraban1997) for cvar Oasis, since it is expected that the GN should be near zero at lower values of SDW or Q. In contrast to the findings of Abbate et al. (Reference Abbate, Andrade, Culot and Bindraban1997), who found changes in the relationship below 100 g/m2, the lowest SDW value found with the present data for Oasis was 107 g/m2. Figure 1 shows that for Q values lower than 0·3 MJ/m2/d/°C or SDW lower than 100 g/m2, some points seem to deviate from the general relationship (Bacanora datum between brackets in Fig. 1), although the limited data availability near the origin (the same problem as the data of Abbate et al. Reference Abbate, Andrade, Culot and Bindraban1997) cannot confirm the real shape of the curve. However, the linear regressions, with no such extreme values, were very strong, which justifies the use of Q or SDW to estimate GN in most agronomic situations. Further, Fig. 3 shows that the spike fertility index increases at low values of SDW. The association between both variables was strong in bread wheat (average R 2=0·89), without differences in slopes (P⩾0·943), average −0·32±0·08 grain/m2 but with different intercepts (P⩽0·031); while in single cultivar of durum wheat tested, this association was not significant (Fig. 3). Dreccer et al. (Reference Dreccer, van Herwaarden and Chapman2009) reported the existence of a strongly negative correlation in individual spikes and also in spike per unit area, in a re-analysis data from a study by Shearman et al. (Reference Shearman, Sylvester-Bradley, Scott and Foulkes2005) on lines released in the UK from 1972 to 1995. The slope of this last regression was −0·31±0·12 grain/m2, a value that did not differ from that obtained with the data from the experiments carried out in Azul presented in Table 5 (Fig. 3). According to Dreccer et al. (Reference Dreccer, van Herwaarden and Chapman2009), this relationship was not apparent when a particular cultivar was subjected to shading until now (Abbate et al. Reference Abbate, Andrade and Culot1995). In contrast, the present results demonstrate that the negative relationship is caused by the different cultivars or by IPAR in an individual cultivar, assuming that changes in SDW or Q were caused mainly by IPAR. This negative relationship can be deduced from data without limitation of nutrients in Abbate et al. (Reference Abbate, Andrade and Culot1995, Reference Abbate, Andrade, Culot and Bindraban1997) since the relationship between NG and SDW for two particular cultivars subjected to radiation levels had a positive intercept. However, the cause of this negative relationship is still unclear. The spike fertility index was associated with the proportion of some of the spike morphological components, but none of these associations were significant. Abbate et al. (Reference Abbate, Andrade, Lázaro, Bariffi, Berardocco, Inza and Marturano1998b) studied Argentinean cultivars released after 1980 and did not find an association between spike fertility index and the rachis proportion. Fischer (Reference Fischer2007) also reported that it is not clear whether there is a relationship between spike fertility index and the weight of glumes or awns. While the existence of a negative relationship between these components (spike fertility index and SDW) raises concern about the possible negative consequences of using spike fertility index as a component useful in selecting for genetic improvement, the existence of parallel relationships between cultivars encourages the finding of cultivars presenting high SDW together with a high spike fertility index.
The association between SDW 1 week after anthesis and Q was strong (R 2=0·84; P⩽0·001; d.f.=54), without differences between cultivars (P=13·4); Bassu et al. (Reference Bassu, Giunta and Motzo2010) also obtained a unique relationship by comparing durum wheats. The intercept was higher than zero, because when the crop growth diminished (low Q), the partitioning towards the spike increased, as reported by Fischer (Reference Fischer1985b) and Abbate et al. (Reference Abbate, Andrade and Culot1995, Reference Abbate, Andrade, Culot and Bindraban1997). If there are differences in responses of GN to Q between cultivars but these differences are not manifested in SDW/Q relationships, it is evident that the differences are generated by the spike fertility index. Also, if the intercepts in the linear regressions between GN and SDW are not different from 0, the slope value would represent the spike fertility index of the cultivar and would be very stable when varying the SDW. However, as the regressions obtained do not pass through the origin, then spike fertility index varies according to the SDW or Q considered. Nevertheless, as the slopes between cultivars are not different (Fig. 1), the relative differences in spike fertility index between cultivars are reflected in the intercept and remain reasonably stable in SDW or Q. Bacanora always had a higher spike fertility index, whereas Ámbar had the lowest. At least for the cultivars used in the present study, the differences in CCV (Eqn 3) are attributable mainly to differences in spike fertility index. It seems more reliable to estimate GN for Q above 0·3 MJ/m2/d/°C (base PAR) or SDW greater than 100 g/m2.
The association between yield and Q was significant and the differences between cultivars were not significant. So, only with this relationship, the yield of crops without water or nutrient limitations and free of pests or diseases of any of the cultivars studied may be estimated, although the error of estimation (±104·2 g/m2, equal to 16%) was slightly higher than with GN calculated from Q (11%, Table 3a).
CONCLUSIONS
The responses of GN to Q (computed from 20 days before to 10 days after anthesis) differed between wheat cultivars. A very similar result was obtained when Q was computed during the measurement of SGP, showing that improving the precision in the determination of SGP does not produce an important benefit regarding the traditional use of Q. No photoperiod effect during SGP was found for the cultivars studied; however, differences between cultivars in the duration in the TT of the SGP reached 11%. These regressions of GN on Q of individual cultivars varied in intercept, with relatively similar slopes. The use of a regression of a ‘hypothetical cultivar of references’ (Eqn 2) was proposed. This would facilitate the estimation of potential GN and yield starting from few data relatively simple to obtain for any user, with changes in sowing dates, sites or years, which alter incident PAR, temperature or other crop growth conditions that modify the IPAR before anthesis.
However, the GN components (according to Fischer's model (1984) at crop level based on the supply of carbohydrates to growing spikes) presented little shading×cultivar interaction, and never involved changes in the rank order of cultivars (no cross interaction). The differences between cultivars in GN on Q regressions were caused by changes in spike fertility index (number grains/g spike). The association between spike fertility index and SDW was strongly negative in bread wheat. This may also be inferred from intercepts greater than 0 in both GN v. Q and GN v. SDW regressions. In lower level of Q or SDW, the spike fertility index increased in all cultivars, at least when changes in SDW or Q were produced mainly by IPAR, but the present results demonstrate that there were also differences between cultivars in this relationship.
We would like to thank Silvia Benson for her help in the preparation of the English version of the manuscript.