Implications
Biopsying is frequently used for tissue and organ sampling instead of killing the animals before sampling. Biopsying makes it possible to study the immune response kinetics or disease pathogenesis over time in the same individuals, but can be associated with side effects or interfering inflammatory reactions because of tissue trauma and medical treatment. This study investigates a minimally invasive biopsying technique used for sampling liver and mammary gland as an alternative research tool for studying the local and systemic inflammatory response during E. coli mastitis and how they interact.
Introduction
Bacterial mastitis is a frequent and costly inflammatory condition of the mammary gland in dairy cows affecting animal welfare (Petrovski et al., Reference Petrovski, Trajcev and Buneski2006; Hertl et al., Reference Hertl, Schukken, Bar, Bennett, Gonzalez, Rauch, Welcome, Tauer and Grohn2011).
Escherichia coli is the most common Gram-negative bacterium causing acute clinical mastitis during early lactation (Bradley et al., Reference Bradley, Leach, Breen, Green and Green2007; Hertl et al., Reference Hertl, Schukken, Bar, Bennett, Gonzalez, Rauch, Welcome, Tauer and Grohn2011). E. coli mastitis induces a local and systemic acute phase response (APR) in the infected cows (Suojala et al., Reference Suojala, Orro, Jarvinen, Saatsi and Pyörälä2008; Mitterhuemer et al., Reference Mitterhuemer, Petzl, Krebs, Mehne, Klanner, Wolf, Zerbe and Blum2010). The APR is often associated with reduced production performance with severe clinical symptoms such as fever, anorexia and decreased milk production and altered milk composition (Blum et al., Reference Blum, Dosogne, Hoeben, Vangroenweghe, Hammon, Bruckmaier and Burvenich2000; Burvenich et al., Reference Burvenich, Van Merris, Mehrzad, Diez-Fraile and Duchateau2003). Further, the E. coli infection results in high somatic cell counts (SCC) with a large number of polymorphonuclear neutrophilic leukocytes (PMN) migrating into the udder from the blood (Paape et al., Reference Paape, Mehrzad, Zhao, Detilleux and Burvenich2002). In blood and milk, large quantities of acute phase proteins (APP) such as haptoglobin, serum amyloid A (SAA) and milk amyloid A (MAA) can be measured in relation to the E. coli mastitis (Jacobsen et al., Reference Jacobsen, Niewold, Kornalijnslijper, Toussaint and Gruys2005; Suojala et al., Reference Suojala, Orro, Jarvinen, Saatsi and Pyörälä2008).
Despite prevention and control strategies, acute E. coli mastitis is frequently observed in high-producing dairy cows and is associated with a higher risk of dying and early culling (Hertl et al., Reference Hertl, Schukken, Bar, Bennett, Gonzalez, Rauch, Welcome, Tauer and Grohn2011). One approach to investigate the susceptibility to E. coli mastitis in dairy cows is to study the underlying molecular mechanisms in udder and liver tissue using gene expression (Buitenhuis et al., Reference Buitenhuis, Røntved, Edwards, Ingvartsen and Sørensen2011; Jørgensen et al., Reference Jørgensen, Buitenhuis, Røntved, Jiang, Ingvartsen and Sørensen2012). Biopsying the mammary gland or other organs during mastitis allows for repeated gene expression measurements in vivo in the same animal over time, which may contribute to a further insight into the pathogenesis of mastitis. Hence, biopsying could be a preferable research tool compared with killing the animals for tissue collection. However, as biopsying causes minor tissue trauma and may be painful and stressful for the cow (Mølgaard et al., Reference Mølgaard, Damgaard, Bjerre-Harpøth and Herskin2012), the procedure potentially could induce a local APR, as trauma, inflammation and stress trigger an APR (Cray et al., Reference Cray, Zaias and Altman2009). Thus, biopsying may be associated with side effects that influence the disease response and kinetics. Earlier we found that the collection of repeated liver biopsies using a minimally invasive biopsy technique had no effect on the cows’ production parameters, clinical disease response or systemic hepatic APP when performed in healthy dairy cows or cows with E. coli lipopolysaccharide-induced mastitis (Vels et al., Reference Vels, Røntved, Bjerring and Ingvartsen2009). In contrast, others have reported that taking udder biopsies in healthy dairy cows causes hemorrhage and a transient reduction in milk yield (Oxender et al., Reference Oxender, Askew, Benson and Emery1971; Knight et al., Reference Knight, Hillerton, Teverson and Winter1992; Farr et al., Reference Farr, Stelwagen, Cate, Molenaar, Mcfadden and Davis1996). Further, udder biopsying increases the SCC and change the milk composition (Farr et al., Reference Farr, Stelwagen, Cate, Molenaar, Mcfadden and Davis1996). Moreover, as discussed in Knight et al. (Reference Knight, Hillerton, Teverson and Winter1992), cows are at risk of developing mastitis if they are not treated prophylactic with antibiotic. However, in these former studies, relatively large biopsies (1 to 10 g) were collected from the mammary gland on laterally recumbent or standing sedated cows. Recently, we conducted repeated liver and udder biopsies simultaneously in dairy cows to investigate the hepatic and mammary gland transcriptome during E. coli mastitis (Buitenhuis et al., Reference Buitenhuis, Røntved, Edwards, Ingvartsen and Sørensen2011; Jørgensen et al., Reference Jørgensen, Buitenhuis, Røntved, Jiang, Ingvartsen and Sørensen2012). In this study, we used the same local anesthetic procedure followed by the minimally invasive biopsy technique as described in Vels et al. (Reference Vels, Røntved, Bjerring and Ingvartsen2009) for collection of liver and udder tissue samples. Compared with the earlier studies on udder biopsies the size of the udder tissue samples in our study were relatively small (10 to 50 mg). In addition, when biopsying the udder, the cows were given a mild sedation and the skin surface of the udder was anestesized using a local anesthetic in a spray form to reduce kicking and minimize bleeding during sampling. By using this approach, we hypothesized that we could reduce the local udder damage caused by biopsying. Moreover, we hypothesized that it was possible to conduct liver and udder biopsies simultaneously in the same individual, without causing any major disturbances to the systemic and local APR during disease.
The objectives of the present study were therefore to investigate whether the minimally invasive technique for biopsying is an acceptable and improved tool for udder tissue collection during disease, and second, to investigate the effects of conducting repeated liver and udder biopsies (combined biopsying) in the same trial on the production, clinical and inflammatory responsiveness in dairy cows with experimental E. coli mastitis.
Material and methods
Selection of animals
The animal trial was conducted at the Aarhus University's (AU) dairy barn. The AU dairy herd is free of major contagious pathogens such as Salmonella dublin, Bovine viral diarrhea virus, group B streptococcus, Infectious bovine rhinotracheitis virus and has a low Paratuberculosis status.
Forty-two primiparous Danish Holstein-Friesian cows in early lactation were screened for the E. coli biopsy study. The cows were observed for their temperament during handling and their general health and udder health status were evaluated on the basis of rectal body temperature, white blood cell count (WBC), the glutaraldehyde test, the California Mastitis Test (CMT) on a scale from 1 to 5 (Kruuse, Marslev, Denmark) and bacteriological examinations of foremilk samples. Thirty-two manageable cows with normal body temperature and WBC, negative glutaraldehyde test, low CMT score (1 to 2) and free from major mastitis pathogens were selected for the E. coli biopsy study. The remaining 10 cows served as reserves until the day of E. coli inoculation that was conducted 4 to 6 weeks after parturition.
All the procedures involving animals were approved by the Danish Animal Experiments Inspectorate in accordance with the Danish Ministry of Justice Law no. 726 (September 9, 1993) and acts 739 (December 6, 1988) and 687 (July 25, 2003) concerning animal experimentation and care of experimental animals.
Experimental design
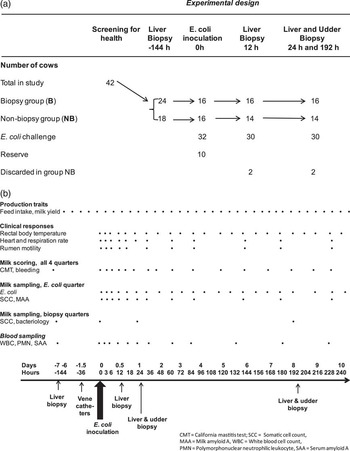
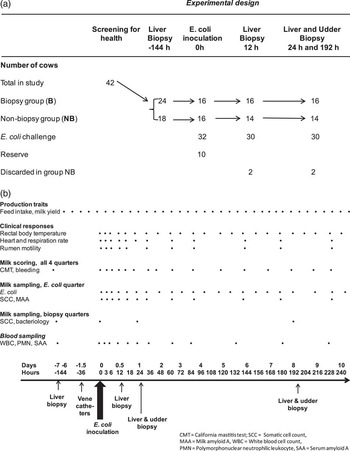
The experimental design is illustrated in Figure 1a. One week (−192 h PI) before E. coli inoculation 24 of the 42 cows were randomly selected for biopsy collection. At first, cows were biopsied only from liver at −144, 12 h PI and then they underwent combined liver and udder biopsy procedures at 24 and 192 h PI. Of the 42 cows, 32 were challenged intramammarily with E. coli; this was set as time point 0 h. Of the 24 biopsied cows, 16 continued in the E. coli trial as the biopsy group (B). The remaining 16 E. coli-infected cows were grouped as non-biopsied cows (NB). To minimize the work load, the E. coli challenge was repeated four times with eight cows, including four cows from the B group and four cows from the NB group in each challenge. The cows’ pre-challenge period served as a control period for establishing baseline values for the investigated parameters.
(a) Experimental design of the Escherichia coli biopsy trial conducted in dairy cows. (b) The timeline illustrates the recordings of production data, clinical measurements and scores, and collection of blood and milk samples in relation to intramammary E. coli inoculation and liver biopsies, followed by repeated combined liver and udder biopsies.
Housing, feeding and milking
The cows were housed in a straw-bedded tie-stall barn. Eight days before the disease trial, they were moved so that each cow was kept with the neighboring empty tie-stalls in between them during the remaining study period. Their mean BW were 543 kg ± 78 kg v. 547 kg ± 44 kg and body condition scores 3.0 ± 0.4 v. 2.9 ± 0.4 on a scale from 1 to 5 (Kristensen, Reference Kristensen1986), for groups NB and B, respectively. A total mixed-ration diet based on corn silage plus minerals and vitamins was fed ad libitum twice a day in equal portions at about 0800 and 1530 h. The total mixed ration diet and mineral supplementation were formulated to fulfill the nutrient requirements for dairy cows according to Danish standards. Feed intake was measured twice a day and the cows had free access to water. The cows were milked twice a day at 0600 and 1700 h.
Preparation and intramammary inoculation of bacteria
The procedures for preparation and intramammary inoculation of the bacteria were described by Buitenhuis et al. (Reference Buitenhuis, Røntved, Edwards, Ingvartsen and Sørensen2011). The Danish field isolate, E. coli strain (k2bh2) isolated from a cow with severe, acute mastitis, was used in this experiment. Each cow was inoculated with 10 ml pyrogen-free 0.9% sodium chloride solution containing 20 to 40 E. coli cfu in one front quarter after the evening milking, following the inoculation procedure described in Vels et al. (Reference Vels, Røntved, Bjerring and Ingvartsen2009).
Collection of liver and udder biopsies
Liver biopsies were collected four times at −144, 12, 24 and 192 h. Udder biopsies were collected twice at 24 and 192 h PI immediately after the liver biopsies (Figure 1b).
To collect liver biopsies, an incision was made into the skin and underlying fat, muscular tissue and fascia of the right abdominal wall of the cows. Local anesthesia was administered by using 10 ml 2% lidocaine (Skanderborg Apotek, Skanderborg, Denmark). Ten minutes after injecting the local anesthetic, a 0.3 to 0.6 cm long incision was made with a scalpel and samples were collected using a minimally invasive biopsy pistol developed for muscle biopsies in humans (Manan Automatic Biopsy System; Marmon/MDTech, Gainesville, FL, USA). The needle of the biopsy pistol was 14 gauges with a 17 mm notch, which is capable of collecting 10 to 15 mg tissue per biopsy. After the biopsy, the skin incision was closed with a single-use metal skin staple (35W Auto Suture, Appose ulc, Tyco Healthcare UK Ltd, Gosport, UK) and sprayed with a disinfecting wound spray (Tar Plaster, Jorgen Kruuse A/S, Marstal, Denmark). The following liver biopsies were conducted above the former biopsies.
Both front quarters of each cow were biopsied. Before biopsying, foremilk samples of these quarters were scored with the CMT test and SCC enumerated using the portable DeLaval Cell Counter (DCC; DeLaval, Tumba, Sweden; range 1 to 6000 × 103 cells/ml). On three occasions, SCC was above the acceptable limit, and the hind quarter with the lowest SCC was picked as control quarter instead. After the liver biopsy, the cows were sedated by i.v. administration of 0.1 ml domosedan Vet per 100 kg BW (10 mg/ml Detomidin; Orion Pharma, Espoo, Finland). In the middle of each quarter (lobuli-alveolar gland region), a skin area of 10 × 10 cm was cleaned, shaved and disinfected (with 70% ethanol), followed by local anesthesia by xylocaine (1% lidocaine; Astra Zeneca A/S, Albertslund, Denmark). Incision was made directly with the biopsy needle avoiding large subcutaneous blood vessels. A prophylactic antibiotic treatment against infection with Gram-positive bacteria was administered after biopsying by i.m. injection of 30 ml of Penovet vet (300.000 IE benzylpenicillinprocain/ml; Boehringer Ingelheim Danmark A/S, Copenhagen, Denmark). To avoid major hematomas, no attempt was made to stop the local udder bleeding caused by biopsying, apart from a manual sterile pressure applied on the incision wound. Before and after milking, the mammary glands of cows exposed to biopsies were thoroughly massaged and milked by hand. This was done to remove potential blood coagels blocking the milk flow within the tissue. The procedure was performed until the milk regained its normal white color.
Milk sampling
Milk samples were collected as foremilk samples before milking at multiple time points (Figure 1b). Samples for bacteriological investigations were aseptically collected as 10 ml sterile foremilk from the E. coli-inoculated quarter. The negative control quarter was sampled before the udder biopsies collected at 24 and 192 h PI, or if the CMT test indicated the presence of mastitis in other quarters than the inoculated quarter. Samples for SCC and MAA analysis were collected after the samples for bacteriological analysis. The milk was collected in 50-ml sterile tubes and filtered through a funnel containing a 100 μm filter to remove major pus aggregates before it was distributed into minor tubes. SCC was conducted immediately after sampling, and all other samples were kept on ice and frozen at −20°C until further analysis.
Blood sampling
Thirty-six hours before the E. coli inoculation, sterile catheters were inserted into the cows’ jugular vein (Figure 1b). The catheters were maintained and flushed with a sterile 0.9% sodium chloride solution containing 50 to 200 IU Na-heparin (Loevens Kemiske Fabrik, Ballerup, Denmark) as described in Vels et al. (Reference Vels, Røntved, Bjerring and Ingvartsen2009). Two sets of blood samples were drawn aseptically with a syringe from the catheters at various time points (Figure 1b). One set of blood samples was transferred to an ethylenediaminetetraacetic acid (K3EDTA) tube and analyzed for total and differential WBC count. The other set was transferred to a 9 ml vacuette blood tube stabilized with Na-heparin and placed on ice immediately after sampling. The blood tubes were centrifuged at 2000 g, 4°C for 20 min. Plasma was collected and stored at −20°C until SAA analysis.
Production and clinical parameters
The parameters used for production performances were daily feed intake (kg/day) and daily milk yield (l/day) collected from the barn record twice a day (Figure 1b). The daily feed intake was calculated as the allowance in the morning and afternoon minus the total leftover. The clinical responses: rectal body temperature (°C), heart rate (beats/min), respiration rate (breaths/min) and rumen motility (contractions/3 min) were measured on various time points in relation to the E. coli inoculation (Figure 1b).
Inflammatory milk and blood parameters
The milk parameters included E. coli (counts/ml), SCC (cells/ml) MAA ng/ml) as described in Buitenhuis et al. (Reference Buitenhuis, Røntved, Edwards, Ingvartsen and Sørensen2011) and scoring of bleeding and blood coagels. Bleeding was scored from 1 to 4 (+ no trace, ++ trace of pink to brownish blood colors, +++ blood coagels, ++++ major bleeding and coagels). Furthermore, at several time points, 10 μl aliquots of foremilk from the E. coli-infected quarter and the negative control quarters used for biopsying were cultured on blood agar and tryptic soy agar for 48 h at 37°C to test for the presence of other mastitis pathogens than E. coli.
The blood parameters included: WBC (million/ml), PMN (million/ml) and SAA (ng/ml) as described in Vels et al. (Reference Vels, Røntved, Bjerring and Ingvartsen2009) WBC and leukocyte differential counts were made using a hemacytometer (Cell-Dyn 3500, Abbott Laboratories A/S, Copenhagen, Denmark). Only WBC and PMN data are reported in this study.
MAA and SAA concentrations were measured by a commercially available ELISA kit (Tridelta Development Ltd., Bray, Co. Wicklow, Ireland) and performed according to the manufacturer's instructions. The milk samples were diluted 1 : 2500 and the plasma samples were diluted from 1 : 500 to 1 : 1000. All samples were tested in duplicate. The interassay and intraassay CVs for the ELISA were < 12% for positive controls in the range of 16.1 to 155.1 μg/ml at a dilution of 1 : 50 000 and < 20% (428.5 μg/ml) at a dilution of 1:50 000 of the positive control. The detection limit of the ELISA was 0.1 μg/ml and 9.5 to 150 μg/ml for milk and plasma, respectively.
Statistical analysis
The data were analyzed using the nlme (package 3.1 to 96) function in R (version 2.12.1, http://www.r-project.org/). The systemic and local udder traits were considered as response variables to test for any effect of taking the biopsies. Clinical and paraclinical responses at different time points were analyzed using a linear mixed model. The following models (M) were used in the analyses,
 $${\rm{M1}}\,{\rm{:}} \ {{y}_{ijk}}\,{\rm{ = }}\,{{t}_i}\, + \,{{b}_j}\,{\rm{ + }}\,{{t}_i}\,\times \,{{b}_j}\,{\rm{ + }}\,{{a}_k}\,{\rm{ + }}\,{{e}_{ijk}}$$
 $${\rm{M2:}} \ {{y}_{ijk}}\, = \,{{t}_i}\, + \,{{b}_j}\, + \,{{a}_k}\, + \,{{e}_{ijk}}$$
 $${\rm{M3:}} \ {{y}_{ik}}\, = \,{{t}_i}\, + \,{{a}_k}\, + \,{{e}_{ik}}$$
Where yijk was the APR-associated parameters, ti was the ith time point measured in the day for daily feed intake and daily milk yield in h for the other parameters, bj was the biopsy effect of the jth biopsy (B or NB), ak was the random effect of the k th cow and eijk was the random error associated with the measurement at the ith time point for the jth biopsy and the kth cow. Measurements at different time points for the same animal were assumed to be correlated using a first-order autoregressive structure.
In the interaction model M1, the biopsy effects were time-dependent; in the additive model M2, the biopsy effect was additive and constant over time and the null model M3 represents the effect of only sampling time. The differences between M1 and M2 indicate that biopsying had an interaction effect, which varies between time samplings. P values for these differences are described as PT. Similarly, differences between M2 and M3 stated that biopsying had a consistent effect over time. P values for these differences are described as PC in the text and figures. All tests were two-sided and the responses were considered significant if P < 0.05. In order to obtain normally distributed data SCC, MAA, PMN and E. coli, was log2 transformed. Pearson correlation coefficients (r) were calculated for all the investigated parameters within the B and NB groups during E. coli mastitis. P values were only reported for r ⩾ 0.3. The numerical differences of the r values were calculated by subtracting the r values of group NB from group B.
Results
The intramammary E. coli inoculation resulted in acute clinical E. coli mastitis in 31 of the 32 cows. The E. coli-infected cows had a transiently decreased feed intake, milk yield and rumen motility, and increased rectal body temperature, respiration rate, heart rate, SCC, MAA and SAA concentrations. Furthermore, the cows developed leukopenia briefly followed by leukocytosis (Figures 2–5). The noninfected cow and a cow with additional spontaneous disease during the E. coli trial were discarded from the NB group (Figure 1a). Two group B cows were given a medical treatment, one because of severe clinical mastitis and another with minor leg injury (Khatun et al., Reference Khatun, Sørensen, Jørgensen, Sahana, Sørensen, Lund, Ingvartsen, Buitenhuis, Vilkki, Bjerring, Thomasen and Røntved2013). However, owing to the relative late medical treatment compared with the acute experimental disease these were kept in the study. Hence, 16 cows in group B and 14 cows in group NB were included in the statistical analysis (Figure 1a).
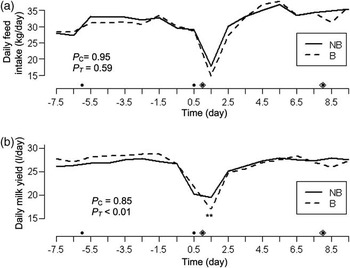
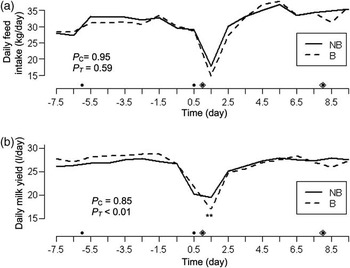
Alterations in production parameters in biopsy (B, n = 16) and non-biopsy (NB, n = 14) cows before and after intramammary Escherichia coli inoculation of dairy cows at 0 h/day. Results are in LSM and show the difference of each group at different time recordings (Interaction model, M1). (a) Daily feed intake (kg/day), (b) daily milk yield (kg/day), round (●): liver biopsies were collected at −6, 0.5, 1 and 8 days, Diamond (◊): Udder biopsies were collected at 24 h (1 day) and 192 h (8 days). The s.e.m. for daily feed intake and daily milk yield ranged from 1.7 to 1.9 and 1.8 to 1.9 for groups NB and B, respectively. PC: the P value of the constant additive effect of biopsy. PT: the P value of the temporary interaction effect of biopsy. The significant stars mark the overall temporary difference for the groups NB and B.
Effect of biopsying on production parameters
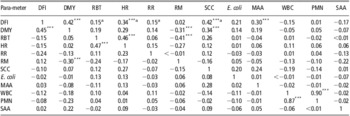
Liver biopsying at −144 h PI had no effect on the dairy cows’ daily feed intake and milk yield (Figure 2). Liver biopsying at 12 h PI followed by combined biopsying at 24 h PI had no significant effect on daily feed intake (Figure 2a), but reduced the daily milk yield transiently (P T < 0.01) in the acute disease stage by 15.7% in group B compared with group NB (Figure 2b). A minor numerical dip was observed in the daily feed intake (8.4%) and milk yield (4.3%) in group B after the second combined biopsy conducted at 192 h PI, whereas group NB remained unchanged. Daily feed intake was correlated with daily milk yield by r = 0.45 and r = 0.42 (P < 0.001) in group NB and group B, respectively (Table 1). R values for the daily feed intake of the B group were affected by more than 0.3 for the same r values in the NB group when these were correlated to the rectal body temperature, heart rate, respiration rate and SCC, respectively.
Pearson correlations of production, clinical responses, milk and blood parameters in biopsy (B) group (upper right r values) and non-biopsy (NB) group (lower left r values) during experimentally induced E. coli mastitis
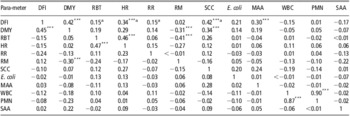
DFI = daily feed intake; DMY = daily milk yield; RBT = rectal body temperature; HR = heart rate; RR = respiration rate; RM = rumen motility; SCC = somatic cell count; MAA = milk amyloid A; WBC = white blood cell count; PMN = polymorphonuclear neutrophilic leukocyte; SAA = serum amyloid A.
P values were only calculated for r values ⩾ 0.3. ***P < 0.001.
aThe r values that numerically differed between group B and group NB ⩾ 0.3.
Effect of biopsying on clinical responses
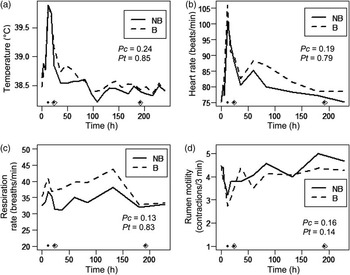
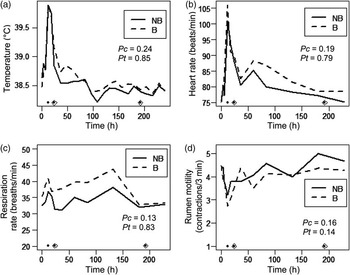
Numerical differences were observed between groups B and NB; however, liver biopsying at 12 h PI followed by combined biopsying at 24 h PI had no transient or constant effect on the clinical response parameters after 24 h in the acute stage or after 192 h PI in the recovery stage (Figure 3). The elevated heart rate followed the pattern of the rectal body temperature. The heart rate was correlated with the rectal body temperature by r = 0.47 and r = 0.46 (P < 0.001) in group NB and group B, respectively (Table 1). The rumen motility was negatively correlated with the daily milk yield by r = −0.30 and r = −0.31 (P < 0.001) in group NB and group B, respectively. Furthermore, in group B, heart rate was correlated with the daily feed intake by r = 0.34 (P < 0.001) and rumen motility was negatively correlated with the rectal body temperature by r = −0.41 (P < 0.001).
Differences in clinical responses in biopsy (B, n = 16) and non-biopsy (NB, n = 14) cows after intramammary Escherichia coli inoculation of dairy cows at 0 h. Results are in LSM and show the difference of each group at different time recordings (Interaction model, M1). (a) Rectal body temperature (°C), (b) Heart rate (beats/min), (c) respiration rate (breaths/min), (d) rumen motility (contractions/3 min), Round (●): liver biopsies were collected at −144 h (not shown), 12, 24, 192 h. Diamond (◊): Udder biopsies were collected at 24 and 192 h. The s.e.m. was for body temperature: 0.1 v. 0.1; heart rate: 2.9 to 5.6 v. 2.6 to 4.7; respiration rate: 2.6 to 4.7 v. 2.5 to 4.1 and rumen motility: 0.3 v. 0.3 for groups NB and B, respectively. P C: the P value of the constant additive effect of biopsy. P T: the P value of the temporary interaction effect of biopsy.
Effect of biopsying on inflammatory milk parameters
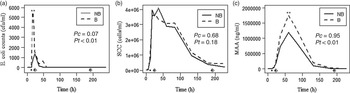
The effects of liver biopsying at 12 h PI followed by combined biopsying at 24 h on E. coli counts were transiently significant (PT < 0.05) and close to being constantly significant (PC =0.07) in the acute disease stage. Similarly, the E. coli counts in milk was consistently higher in group B than in group NB (P < 0.05) before the recovery period (up to 72 h PI; Figure 4a). Numerically, however, the level started to differ already in the milk sample collected at 12 h PI just before taking the liver biopsy at 12 h PI. Until 108 h PI, the counts of E. coli remained numerically higher in group B than in group NB. After 120 h PI, the presence of E. coli fluctuated in the milk samples. From 120 to 396 h PI, E. coli was isolated from only one cow (at one time point) in group NB but from five cows (at 11 time points) in group B. Combined biopsies at 192 h PI did not affect the presence or counts of E. coli in milk after this time point.
Differences in milk parameters of the infected quarter in biopsy (B, n = 16) and non-biopsy (NB, n = 14) cows after intramammary Escherichia coli inoculation of dairy cows at 0 h. Results are in LSM and show the difference of each group at different time recordings (Interaction model, M1). (a) Escherichia coli counts (cfu/ml), (b) SCC level (cells/ml), (c) milk amyloid A level (MAA, ng/ml), round (●): liver biopsies were collected at −144 h (not shown), 12, 24 and 192 h. Diamond (◊): udder biopsies were collected at 24 and 192 h. The s.e.m. was for E. coli level: 0.7 v. 0.7; SCC level: 0.3 v. 0.3 and MAA level: 0.5 v. 0.4 to 0.5 for groups NB and B, respectively. P C: the P value of the constant additive effect of biopsy. P T: the P value of the temporary interaction effect of biopsy. The significant stars mark the overall temporary differences for the groups NB and B.
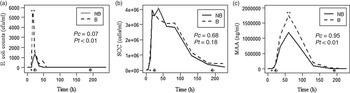
After the liver biopsy conducted at 12 h PI, followed by the combined biopsying at 24 h PI, the numerical SCC in group B remained below that of group NB until ∼72 h PI. However, this shifted toward a higher SCC in group B compared with group NB in the remaining periods (Figure 4b). Biopsying at 192 h PI numerically prolonged the SCC recovery period, with the NB group having a 41% lower SCC compared with the B group when comparing the SCC values before (180 h PI) and after (228 h PI) biopsying. SCC was correlated with the daily feed intake by r = 0.42 (P < 0.001) and daily milk yield by r = 0.34 (P < 0.001) in group B (Table 1).
Blood was observed in milk from group B cows at 36 h (12 cows), 60 h (9 cows) and 84 h (3 cows) PI, whereas no blood was observed in the milk from group NB cows. Hence, in the acute disease stage, taking udder biopsies were associated with bleeding and blood coagels in the udder for 12 to 60 h post biopsying (1 to 5 milkings). In the recovery stage, blood was observed in 13 of 16 cows for at least 36 h post biopsying, but was not determined after 228 h PI.
Biopsying at 12 h PI, followed by combined biopsying at 24 h PI, resulted in significantly higher MAA concentrations (PT < 0.01) in group B than in group NB in the acute disease stage (Figure 4c). In the recovery period, the NB group regained MAA base levels earlier than the B group. No increase in MAA concentrations were observed after the second combined liver and udder biopsies conducted in the recovery period at 192 h PI. In group B, MAA was correlated with the daily feed intake by r = 0.30 (P < 0.001; Table 1).
Effect of biopsying on inflammatory blood parameters
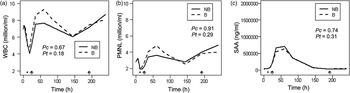
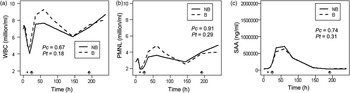
In blood, the numerically mean values for WBC, PMN and SAA were higher for group B than group NB in the acute disease stage. However, none of the parameters were significantly affected by liver biopsying at 12 h PI, followed by combined biopsying at 24 h PI at any time point or over time (Figure 5). Combined biopsying at 192 h PI did not alter the level or kinetics of any of the inflammatory-related blood parameters in the following period. The PMN followed the kinetics of the WBC. PMN was correlated with WBC by r = 0.87 and r = 0.90 (P < 0.001) in group NB and group B, respectively (Table 1).
Differences in blood parameters in biopsy (B, n = 16) and non-biopsy (NB, n = 14) cows after intramammary Escherichia coli inoculation of dairy cows at 0 h. Results are in LSM and show the difference of each group at different time recordings (Interaction model, M1). (a) White blood cell (WBC, million/ml) count, (b) polymorphonuclear neutrophilic leukocyte (PMN, million/ml) count, (c) serum amyloid A level in serum (SAA, μg/ml), round (●): liver biopsies were collected at −144 h (not shown), 12, 24, 192 h. Diamond(◊): udder biopsies were collected at 24 and 192 h. The s.e.m. was for WBC: 0.6 v. 0.5 to 0.6; PMN: 0.1 v. 0.1 and SAA level: 33.3 to 33.6 v. 30.9 to 31.9 for groups NB and B, respectively. P C: the P value of the constant additive effect of biopsy. P T: the P value of the temporary interaction effect of biopsy.
Discussion
The first objective of the present study was to investigate whether our minimally invasive technique for biopsying was an improved tool for udder tissue collection during disease. The second objective was to investigate whether the combined liver and biopsy approach could be used to study the systemic and local APR in dairy cows with experimental E. coli mastitis without affecting the production, clinical and inflammatory responsiveness of the cows. Indeed, our study showed that it is possible to conduct repeated combined liver and udder biopsies during experimentally induced E. coli mastitis for systemic and local pathophysiological investigations. Though, some precautions must be taken for parameters related to the local inflammatory response. Liver biopsying, followed by two additional liver and udder biopsying (combined biopsying), had no effects on the cows’ daily feed intake, clinical responses, SCC and the systemic inflammatory-related blood parameters during the E. coli infection. In contrast, this combined biopsy procedure significantly affected daily milk yield, milk E. coli counts and MAA concentrations in the B group with acute E. coli mastitis compared with group NB that were not exposed to the intensive biopsy procedure. An effect of biopsy was only seen in the acute disease stage (24 h PI) but not in the recovery stage (192 h PI). Hence, it was possible to conduct liver and udder biopsies simultaneously in the same individual without causing any major disturbances to the systemic APR during disease, whereas some local inflammatory parameters are affected.
E. coli mastitis often results in lower feed intake and milk production (Burvenich et al., Reference Burvenich, Van Merris, Mehrzad, Diez-Fraile and Duchateau2003; Pezeshki et al., Reference Pezeshki, Stordeur, Wallemacq, Schynts, Stevens, Boutet, Peelman, Spiegeleer, Duchateau, Bureau and Burvenich2011; Fogsgaard et al., Reference Fogsgaard, Røntved, Sørensen and Herskin2012). Both parameters were affected in this study after E. coli inoculation, and combined biopsying enhanced the effect on milk yield even further. As documented by Vels et al. (Reference Vels, Røntved, Bjerring and Ingvartsen2009), we found that liver biopsying in the pre-inoculation period had no effect on the healthy dairy cows's milk yield. Hence, the udder biopsying seemed to be the cause of the additional reduced milk yield in our E. coli trial. This finding is in accordance with an earlier biopsy study on udder conducted in healthy dairy cows in which a 15% reduction in the milk yield post biopsying was found (Farr et al., Reference Farr, Stelwagen, Cate, Molenaar, Mcfadden and Davis1996). The reduced milk yields observed in our two biopsy studies are likely to be related to pain caused by tissue trauma and hematoma in the udder after collecting the udder biopsies. In our study, bleeding and blood coagels were observed in the milk up to 60 h post biopsying, which is a shorter time period than time period of 4.5 days reported by Farr et al. (Reference Farr, Stelwagen, Cate, Molenaar, Mcfadden and Davis1996). As the lost milk yield was not regained before 3.5 days, it is likely that major blood coagels lowered the cows’ milk let down and blocked the milk passage from the mammary gland alveolars and cisterne leading to a reduced milk production. Although we avoided surgical procedure for tissue collection and our biopsies were up to a 100-fold to a 1000-fold smaller than described by others, we did not avoid significant internal udder bleeding with our minimal invasive biopsy technique. The observation that bleeding in the udder could be related to pain is in accordance with findings reported by Fogsgaard et al. (Reference Fogsgaard, Røntved, Sørensen and Herskin2012) who found a reduction in the cows’ lying time in cows exposed to the biopsy procedure while investigating for sickness behavior.
In addition to bleeding, the reduced milk yield could also have been associated with the altered E. coli kinetics in the two cow groups as much higher E. coli counts were found in group B compared with group NB. It could be a coincidence that higher E. coli counts were found in group B because higher E. coli counts were already present in this group before the second liver biopsy conducted at 12 h PI and the combined liver and udder biopsy at 24 h PI. As Farr et al. (Reference Farr, Stelwagen, Cate, Molenaar, Mcfadden and Davis1996) and Sheehy et al. (Reference Sheehy, Della-Vedova, Nicholas and Wynn2004) administered a single dose of antibiotics systemically to group B after the combined biopsying at 24 and 192 h PI. The prophylactic antibiotic treatment prevented a biopsy induced-infection in the control quarters. Moreover, it did not reduce the E. coli counts in group B compared with group NB. Therefore, our findings suggest that if the milk yield goes down and the milk passage is blocked by blood coagels, this could potentially prolong the growth of E. coli in the udder.
Using a low-dose E. coli model for intramammary inoculation resulted in a high variance in the clearance of E. coli, which varied from 18 to 120 h PI in group NB. Only one cow had not recovered within 216 h PI. This is in agreement with recovery recordings (∼144 h) in Blum et al. (Reference Blum, Dosogne, Hoeben, Vangroenweghe, Hammon, Bruckmaier and Burvenich2000) and Suojala et al. (Reference Suojala, Orro, Jarvinen, Saatsi and Pyörälä2008), although they used a high-dose (104, cfu/ml) and moderate- (1500, cfu/ml) dose E. coli model. Hence, shedding of E. coli followed the kinetics of previous reported E. coli models in group NB. The recovery times were longer (24 to 216 h PI) in group B with one cow shedding E. coli until 300 h PI. E. coli was never observed in the negative control quarter used for biopsying. However, whether biopsying the E. coli-infected quarter could result in a further spreading of E. coli and tissue damages within the same quarter, thereby prolonging the infection is difficult to say.
The subsequent elevated body temperature (fever), heart rate and respiration rates following the E. coli inoculation were within the same time frame (12 to 18 h PI) as reported by others (Blum et al., Reference Blum, Dosogne, Hoeben, Vangroenweghe, Hammon, Bruckmaier and Burvenich2000; Suojala et al., Reference Suojala, Orro, Jarvinen, Saatsi and Pyörälä2008; Mitterhuemer et al., Reference Mitterhuemer, Petzl, Krebs, Mehne, Klanner, Wolf, Zerbe and Blum2010). Furthermore, E. coli mastitis significantly lowered rumen motility as described by Pezeshki et al. (Reference Pezeshki, Stordeur, Wallemacq, Schynts, Stevens, Boutet, Peelman, Spiegeleer, Duchateau, Bureau and Burvenich2011). Although the majority of parameters appeared numerically different in group B and group NB, none of the clinical responses were significantly worsened by the combined biopsy procedure. Hence, these findings are in accordance with our previous study on taking repeated liver biopsies using a minimally invasive biopsy technique (Vels et al., Reference Vels, Røntved, Bjerring and Ingvartsen2009).
In both groups B and NB, the E. coli infection in the udder drastically increased the SCC as reported by others (Bannerman et al., Reference Bannerman, Paape, Lee, Zhao, Hope and Rainard2004; Suojala et al., Reference Suojala, Orro, Jarvinen, Saatsi and Pyörälä2008; Rasmussen et al., 2011). Although combined biopsying resulted in additional udder bleeding, this had no statistically significant effect on the recorded SCC in milk in the acute stage or in the recovery stage. However, recovery based on the SCC return to normal base levels seemed to be delayed in group B compared with group NB. Farr et al. (Reference Farr, Stelwagen, Cate, Molenaar, Mcfadden and Davis1996) found an increased SCC post biopsying in healthy cows using a more invasive biopsy instrument. To what degree the E. coli infection were able to disguise the effect on SCC in the acute stage is difficult to say. Opposite SCC, we found a significantly higher MAA level that was induced directly or indirectly by injuries inflicted by biopsying the udder. MAA, also known as SAA isotype 3, is produced extrahepatically not only in organs such as the udder (Jacobsen et al., Reference Jacobsen, Niewold, Kornalijnslijper, Toussaint and Gruys2005; Mitterhuemer et al., Reference Mitterhuemer, Petzl, Krebs, Mehne, Klanner, Wolf, Zerbe and Blum2010) but also in the liver (Vels et al., Reference Vels, Røntved, Bjerring and Ingvartsen2009). Indeed, the higher level of E. coli in milk of the biopsied cows is likely to have contributed to the additional increase in the MAA concentration as bacteria count, and the degree of tissue trauma was shown to be correlated with the level of MAA (Jacobsen et al., Reference Jacobsen, Niewold, Kornalijnslijper, Toussaint and Gruys2005). In accordance with Jacobsen et al. (Reference Jacobsen, Niewold, Kornalijnslijper, Toussaint and Gruys2005), the SAA levels in blood increased by more than a 20-fold than the basal blood level, the concentration during the acute disease stage. This was about three times less as the concentration of MAA in milk. Therefore, the presence of blood-derived SAA in milk is unlikely to have contributed to the increased MAA levels in group B. The fact that the second udder biopsy conducted at 192 h PI, when E. coli counts and blood SAA levels were low, did not result in any rise in MAA concentrations also supports these theories. Our study provided further information that neither repeated liver biopsying (Vels et al., Reference Vels, Røntved, Bjerring and Ingvartsen2009) nor combined liver and udder biopsies had any effect on blood WBC, PMN levels or SAA kinetics. Hence, these three systemic parameters can be investigated during repeated combined biopsies without compromising the results.
Correlations were performed on the production, clinical response and milk and blood parameters within group B and group NB during experimentally induced E. coli mastitis. As expected, strong and significant correlations were found between the WBC and the PMN response, followed by the heart rate and the rectal body temperature, the daily milk yield and daily feed intake, but also the rumen motility and daily milk yield within group B and group NB, respectively. No differences were observed for these correlations between the two treatment groups. Group B did, however, result in more significant correlations than group NB within the clinical response and milk parameters. Moreover, some of the r values for the daily feed intake of group B were affected by more than 0.3 for the same r values in group NB when these were correlated to the rectal body temperature, heart rate, respiration rate, and SCC, respectively. Hence, biopsy either strengthened or weakened the correlations of several parameters during E. coli mastitis.
In summary, the minimally invasive biopsy technique used for combined repeated liver and udder biopsies had no effect on the daily feed intake, clinical disease response and the inflammatory-related blood parameters in the dairy cows. In contrary, udder biopsying transiently affected daily milk yield and some milk parameters (i.e. the presence of blood in milk, increased E. coli level, MAA levels). The significant effects of the combined biopsies were only pronounced in the acute disease stage and not in the recovery stage.
In conclusion, by using a minimally invasive biopsy technique for collecting udder biopsies, we were able to reduce but not remove some of the inflammatory side effects reported by others. Nevertheless, we recommend combined liver and udder biopsying as an alternative research tool for studying disease pathogenesis in dairy cows instead of killing the animals, especially if the intention is to follow the hepatic APR and how it interacts with the udder's APR. However, the time of sample collection, the possible side effects of taking udder biopsies, and the related local and systemic medical treatments should be considered when using this tool in bovine mastitis trials.
Acknowledgments
The study was partly funded by the EU programme ‘Sustainable Animal Breeding’ (SABRE), Work Package (WP) 5, Mammary gland function and by the BIOSENS project granted by the Danish Ministry of Food, Agriculture and Fisheries (Innovations Law), Lattec I/S, the Danish Cattle Association, and Aarhus University (AU). AU granted the first author's tuition-free enrollment and Scholarship, which is given to master students of developing countries. We thank Dr Helle Daugaard Larsen, Danish Meat Research Institute (DMRI), Roskilde, Denmark for the E. coli bacteria. The AU laboratory technicians and barn staff are thanked and acknowledged for their excellent technical assistance.