Introduction
Modern society generates large amounts of municipal solid waste (MSW), causing ecological and public health risks (Li et al., Reference Li, Cai, Puppala and Liu2018). Landfilling, as a containment strategy, involves burial of MSW through engineered stabilization systems consisting of basal liners, vertical barriers, waste mass compartments, and capping layers (Kamdar et al., Reference Kamdar, Ali, Bennui, Techato and Jutidamrongphan2019; Nanda and Berruti, Reference Nanda and Berruti2021). Leachate-induced chemical degradation during the post-closure phases includes everything from liner-system integrity through to barrier-property deterioration (Wan et al., Reference Wan, Chen, Liu, Hu, Wu and Xue2022). While systematic leachate extraction mitigates the impact on the longevity of the infrastructure, this remediation technique alters overburden stresses and induces structural alterations in liner materials (Mishra et al., Reference Mishra, Tiwary, Ohri and Agnihotri2019; Zhang et al., Reference Zhang, Chen, Liu, Bowden, Townsend and Solo-Gabriele2024). These processes initiate consolidation–rebound deformation cycles that destabilize engineered barriers, ultimately jeopardizing landfill rehabilitation efficacy (Jang et al., Reference Jang and Kim2007). This mechanistic understanding forms the foundation for ensuring landfill structural integrity and operational safety through rigorous analysis of linear material deformation behavior.
Landfill leachate contains complex types of pollutants, with organic pollutants making up a significant proportion (Al-Yaqout and Hamoda, Reference Al-Yaqout and Hamoda2020; Nguyen et al., Reference Nguyen, Kusakabe and Takaoka2024). Using materials with significant adsorption properties for preparing the underlying cushion layer is crucial in preventing leachate leakage into groundwater. Soils mixed with bentonite are the main component (particularly sand–bentonite mixed soil, the most widely used soil). Owing to its unique structure, bentonite adsorbs and retains pollutants effectively. When mixed with sand, it optimizes particle gradation, enhances compaction performance and water permeability, and further improves overall anti-seepage efficiency, thus effectively safeguarding groundwater environmental quality (Sobti and Singh, Reference Sobti and Singh2017; Li et al., Reference Li, Zhang, Gorgy and Grace2019).
Research on landfill deformation characteristics is important. Many researchers have used GPS and leveling instruments to monitor garbage mounds at various landfill stages, revealing complex settlement patterns. The initial rapid settlement slows gradually over time and is influenced by waste composition and degree of compaction. Laboratory tests on MSW soil consolidation deformation have been conducted by several researchers (e.g. Elk et al., Reference Elk, Corrêa and Ritter2019). Li et al. (Reference Li, Chen, Shi and Fan2024) reported that an increase in temperature increases MSW soil volume shrinkage deformation, and Li and Shi (Reference Li and Shi2022) and Zhang et al. (Reference Zhang, Guo, Zhang, Wu, Xu, Liu and Cheng2019) reported high compressibility in MSW soil. Some studies have modeled deformation by treating the overlying layer, garbage mound, and underlying cushion as a system (Cheng et al., Reference Cheng, Hu and Chen2020). However, little research has been done which focuses solely on the underlying cushion layer. Existing studies have addressed primarily pure bentonite mixed soils or bentonite contaminated by inorganic salts (Oztoprak and Pisirici, Reference Oztoprak and Pisirici2011; Du et al., Reference Du, Fan, Liu, Reddy and Jin2015; Li et al., Reference Li, Cai, Puppala and Liu2018; He et al., Reference He, Wang, Wu, Zhang, Chen and Ye2021), with even fewer investigations on consolidation deformation of the underlying cushion under organic pollution. Thus, current research on the deformation characteristics of the underlying cushion is incomplete.
Considerable research has been conducted on the deformation characteristics of natural soils under organic pollutant influence, yielding relatively consistent findings. Researchers generally attribute the enhanced soil mass consolidation deformation capacity to the lubricating effect of organic pollutants, which reduces inter-particle friction and increases deformability (Pincus et al., Reference Pincus, Meegoda and Ratnaweera1994; Ratnaweera and Meegoda, Reference Ratnaweera and Meegoda2006; Khamehchiyan et al., Reference Khamehchiyan, Charkhabi and Tajik2007; Safehian et al., Reference Safehian, Rajabi and Ghasemzadeh2018). This explanation may not apply to sand–bentonite cushion layers; however, owing to their distinct particle composition, sand–bentonite soils exhibit an agglomerate skeleton structure of sand and bentonite, with smaller bentonite agglomerates/particles filling pores. During consolidation, particle movement, rearrangement, and agglomerate fragmentation mechanisms are far more complex (Oztoprak and Pisirici, Reference Oztoprak and Pisirici2011), and the evolutionary mechanism of the consolidation deformation characteristics of an organically polluted cushion layer is unclear.
Research on soil-mass rebound characteristics has also been a focus of research. For example, Zhu et al. (Reference Zhu, Liu and Zhang2008) reported that more severe acid–base pollution is correlated with greater soil rebound indices, which are attributed to particle gradation and liquid–plastic limits. Chen et al. (Reference Chen, Zhao, Liu, Chen and Dang2020) reported that the rebound time–history curves of muddy soil conform to those of the Burgers constitutive model (Yan et al., Reference Yan, Chang, Liu, Xu, Feng and Sun2025), dividing the rebound curves into three stages. Wang et al. (Reference Wang, Cui, Zhu, Wu and Wang2021) reported that the repeated loading–unloading modulus of calcareous sand follows the Duncan–Chang model’s unloading rebound modulus estimation method, whereas Gao and Wang (Reference Gao and Wang2016) reported no significant changes in sandy soil rebound characteristics after multiple loading–unloading cycles. However, none of these studies considered organic pollutants because of their different application contexts. Current research on the rebound characteristics of organically polluted soils remains extremely limited, representing a notable gap in our knowledge.
The focus of the present study was to examine the consolidation and rebound behavior of sand–bentonite barriers under diesel erosion to predict the long-term performance of landfill remediation. Conventional consolidation tests, along with micro-scale analyses, including particle-size distribution, pore structure, cation exchange capacity (CEC), and oil-blocking effects, were carried out to reveal the evolution patterns and mechanisms of these properties at both macro- and micro-scales.
Materials and methods
Experimental soil and organic contaminants
The bentonite used in the present study, which was sourced from Zhengzhou, Henan, China, consisted primarily of montmorillonite (85.0%) with minor amounts of illite, gypsum, quartz, and albite (based on analysis by X-ray diffraction (XRD)). Physical properties were tested using the Chinese Standard for Geotechnical testing GB/T 50123–2019. The material had a natural water content of 15.72%, passed completely through a 325-mesh sieve (45 μm), and was classified as 100% fine-grained. Its liquid limit (L L) and plastic limit (P L) were 147.42% and 38.97%, respectively, yielding a high plasticity index (P I) of 108.45%. The relative density (d s) was 2.62. The quartz sand, from Suzhou, Jiangsu, China, was predominantly silica (SiO₂) with a particle density of 2.65. The test material was commercial No. 0 diesel from China, which was light green in color. It had a relative density of 0.856 and a dynamic viscosity of 3.95 mPa·s at 20°C. The full physicochemical specifications are provided in Table 1.
Basic physical properties of the experimental soil sample

 $ {w}_{\mathrm{n}} $
represents natural moisture content. L
L is the liquid limit. P
L is the plastic limit. P
I stands for plasticity index. d
s is the relative density of bentonite.
 $ {w}_{\mathrm{b}} $
is the moisture content of sand.
 $ {w}_{\mathrm{S}} $
is the content of SiO2 in sand. d
sa is the relative density of sand. d
D is the relative density of diesel. μ is the viscosity coefficient of diesel.
Experimental scheme
Field conditions require the expansion of experimental parameters to account for non-uniform distributions of sand–bentonite mixtures and organic pollutants in cut-off walls. The sand content ranged from 0 to 50%, and the diesel concentration was set at 0.0, 2.0, 4.0, and 6.0 wt.%. The samples were compacted to a dry density of 1.31 g cm–3 at a 30% water content. The investigation into the micro-mediation of deformation in contaminated mixed-soil cushion materials involves mercury intrusion porosimetry, stereomicroscopy, laser diffraction, and CEC measurements
Experimental methods
Preparation of diesel-polluted sand–bentonite
Diesel-contaminated sand–bentonite mixtures were prepared by oven-drying bentonite at 100°C for 8 h and storing both materials sealed (during the experiment, a zipper-style pocket was used to hold contaminated soil and seal it, while a black cloth bag was placed outside the sealed bag to create a dark environment for maintenance). Mixtures with target sand ratios were blended using a cement slurry mixer, then placed in layers in a non-absorbent mold. Each layer was sprayed sequentially with diesel and water to achieve target contamination levels at a constant water content of 30%. Samples were sealed and cured in darkness for ≥30 days to ensure the homogeneity of the diesel and moisture (Chun et al., Reference Chun, Liu, Liu, Zhou, Huang, Su and Liang2023a). For consolidation–rebound tests, three parallel specimens were prepared. A total of 235.8 g of loose material was required; considering preparation loss, 283.0 g of dry soil and 84.9 g of water were used and divided equally among the specimens. Following curing, the diesel-contaminated soil was compacted to the target dry density into a cake measuring ϕ 61.8 mm × 20 mm. The loading rate was set to 0.01 mm s–1, which is consistent with the method of Li and Zhang (Reference Li and Zhang2009). The dry density was calculated using Eqn (1):
 $$ {\unicode{x03C1}}_{\mathrm{d}}=\frac{m_{\mathrm{s}}}{V}, $$
where
 $ {\unicode{x03C1}}_{\mathrm{d}} $
is the dry density (g cm–3); m
s is the total quality of the sand and bentonite (g); and V is the volume of the ring cutter (V=2×(3.14×ϕ2)/4=2×(3.14×6.182)/4=59.96 cm3).
Standard consolidation–rebound experiment
The consolidation–rebound test was performed according to the Standard for geotechnical testing method (GB/T 50123–2019). The consolidation phase used loading steps of 50, 100, 200, 400, and 800 kPa, followed by unloading at 400, 200, 100, 50, and 0 kPa. The compression coefficient, compression modulus, void ratio after stabilization, rebound ratio, and rebound modulus were calculated as described by Han et al. (Reference Han, Zou, Pei, Wang and Zhang2023) and Dong et al. (Reference Dong, Wang, Wang, Xu and Yang2023):
 $$ {C}_{\mathrm{c}}=\frac{e_1\hbox{--} {e}_2}{\log {p}_2\hbox{--} \log {p}_1}=\Delta e/\log \left({p}_2/{p}_1\right) $$
 $$ {E}_s=\frac{\Delta P}{\left({e}_1-{e}_2\right)/\left(1+{e}_1\right)} $$
 $$ {e}_{\mathrm{i}}={e}_0-\left(1+{e}_0\right)\frac{\sum \Delta {h}_{\mathrm{i}}}{h_0} $$
 $$ \delta =\frac{e_{\mathrm{max}}-{e}_{\mathrm{i}}}{e_{\mathrm{max}}} $$
 $$ {E}_{\mathrm{r}}=\frac{P_{\mathrm{max}}-{P}_{\mathrm{i}}}{e_{\mathrm{i}}-{e}_{\mathrm{min}}}\left(1+{e}_{\mathrm{min}}\right) $$
where e
0 is the initial void ratio, eᵢ is the stabilized void ratio at a given pressure, h
0 is the initial sample height (20 mm), and Δhᵢ is the height change (cm) at that pressure.
 $ {\mathrm{e}}_1 $
and
 $ {\mathrm{e}}_2 $
are the porosities at 100 kPa and 200 kPa,
 $ {p}_1 $
and
 $ {p}_2 $
denote these consolidation pressures,
 $ \Delta P $
is the difference between them, and
 $ {P}_{\mathrm{max}} $
is the pressure at 800 kPa. pᵢ refers to the pressure after unloading at step i, and eᵢ is the corresponding void ratio.
 $ {e}_{\mathrm{min}} $
is the void ratio at 800 kPa.
 $ {E}_{\mathrm{r}} $
is the rebound modulus.
Pore structure experiments by mercury intrusion porosimetry
Mercury intrusion porosimetry was performed by Shandong High-Precision and Advanced Testing Technology Co., Ltd, China. Soil samples were flash-frozen in liquid nitrogen (–196°C) for ≥2 h and then vacuum freeze-dried for 24 h to remove free water. Cubic specimens (5 cm × 5 cm × 5 cm) were stored in sealed containers with desiccant until analysis. Testing covered a pressure range of 0.2–60,000 psi and pore diameters from 0.003 to 1000 nm. All procedures followed standard protocols under controlled laboratory conditions (Chun et al., Reference Chun, Zhou, Liu, Liu, Liang, Su and Huang2023b).
Microscopic morphology testing experiment
This test examined the morphology of diesel–bentonite agglomerates. The samples were kept intact without freeze drying. The stereomicroscope offered the opportunity for direct observation without sample pretreatment (Song et al., Reference Song, Ma, Liu and Yue2023). Eyepiece and focus adjustments were made to achieve clarity before the magnification was selected.
Particle-size distribution testing experiment
Particle-size distribution was determined using a MAZ3000 laser diffraction analyser (range: 0–3800 μm). According to standard pedological classification (Chun et al., Reference Chun, Liu, Zhou, Wu, Su and Luo2021; Supriyo et al., Reference Supriyo, Matsue and Yoshinaga2012), particles were classified as clay (<0.002 mm), silt (0.002–0.02 mm), or sand (>0.02 mm). Dried and ground samples were dispersed ultrasonically with a dispersant to form a homogeneous suspension. After calibration, the suspension was analyzed via laser diffraction, and characteristic sizes (d 10, d 50, d 60) along with cumulative percentages were recorded.
Hydration capacity of soil particles
The CEC of diesel-contaminated sand–bentonite composites was measured to assess hydration capacity, following the forestland soil standard LY/T 1243–1999 (Chun et al., Reference Chun, Du, Zhou, Liu, Liang, Qin and Su2022). Air-dried samples were treated with neutral ammonium acetate to saturate exchangers, washed with ethanol to remove excess salts, and then displaced with ammonium chloride. The eluate collected was analyzed via atomic absorption spectroscopy or inductively coupled plasma-optical emission spectroscopy (ICP-OES) to determine cation concentrations and calculate the CEC.
Data processing
During the experimental process, MATLAB (MathWorks Company) (Das et al., Reference Das, Dutta, Gupta, Singhal, Barak and Almohsen2025) was used to process the data, and ‘Origin 2018’ (OriginLab Company) (Li et al., Reference Li, Liu, Wang and Wei2025) and Microsoft Powerpoint were used to construct the figures (Chun et al., Reference Chun, Liu, He, Wei and Su2024).
Under consolidation pressure, the soil aggregates in both uncontaminated and contaminated samples underwent fragmentation, although the extent of fragmentation varied (Saleth et al., Reference Saleth, Inocencio, Noble and Ruaysoongnern2009). To quantify this breakage, a breakage rate was defined as follows:
 $$ \zeta =\frac{{\mathrm{SV}}_{i+1}-{\mathrm{SV}}_i}{{\mathrm{SV}}_{i+1}} $$
where
 $ {\mathrm{SV}}_i $
represents the sand grain content (vol.%) under the i level of consolidation pressure, which is 0, 50, 100, 200, and 400 kPa.
Results and Discussion
Consolidation deformation characteristics of diesel-contaminated sand–bentonite soil
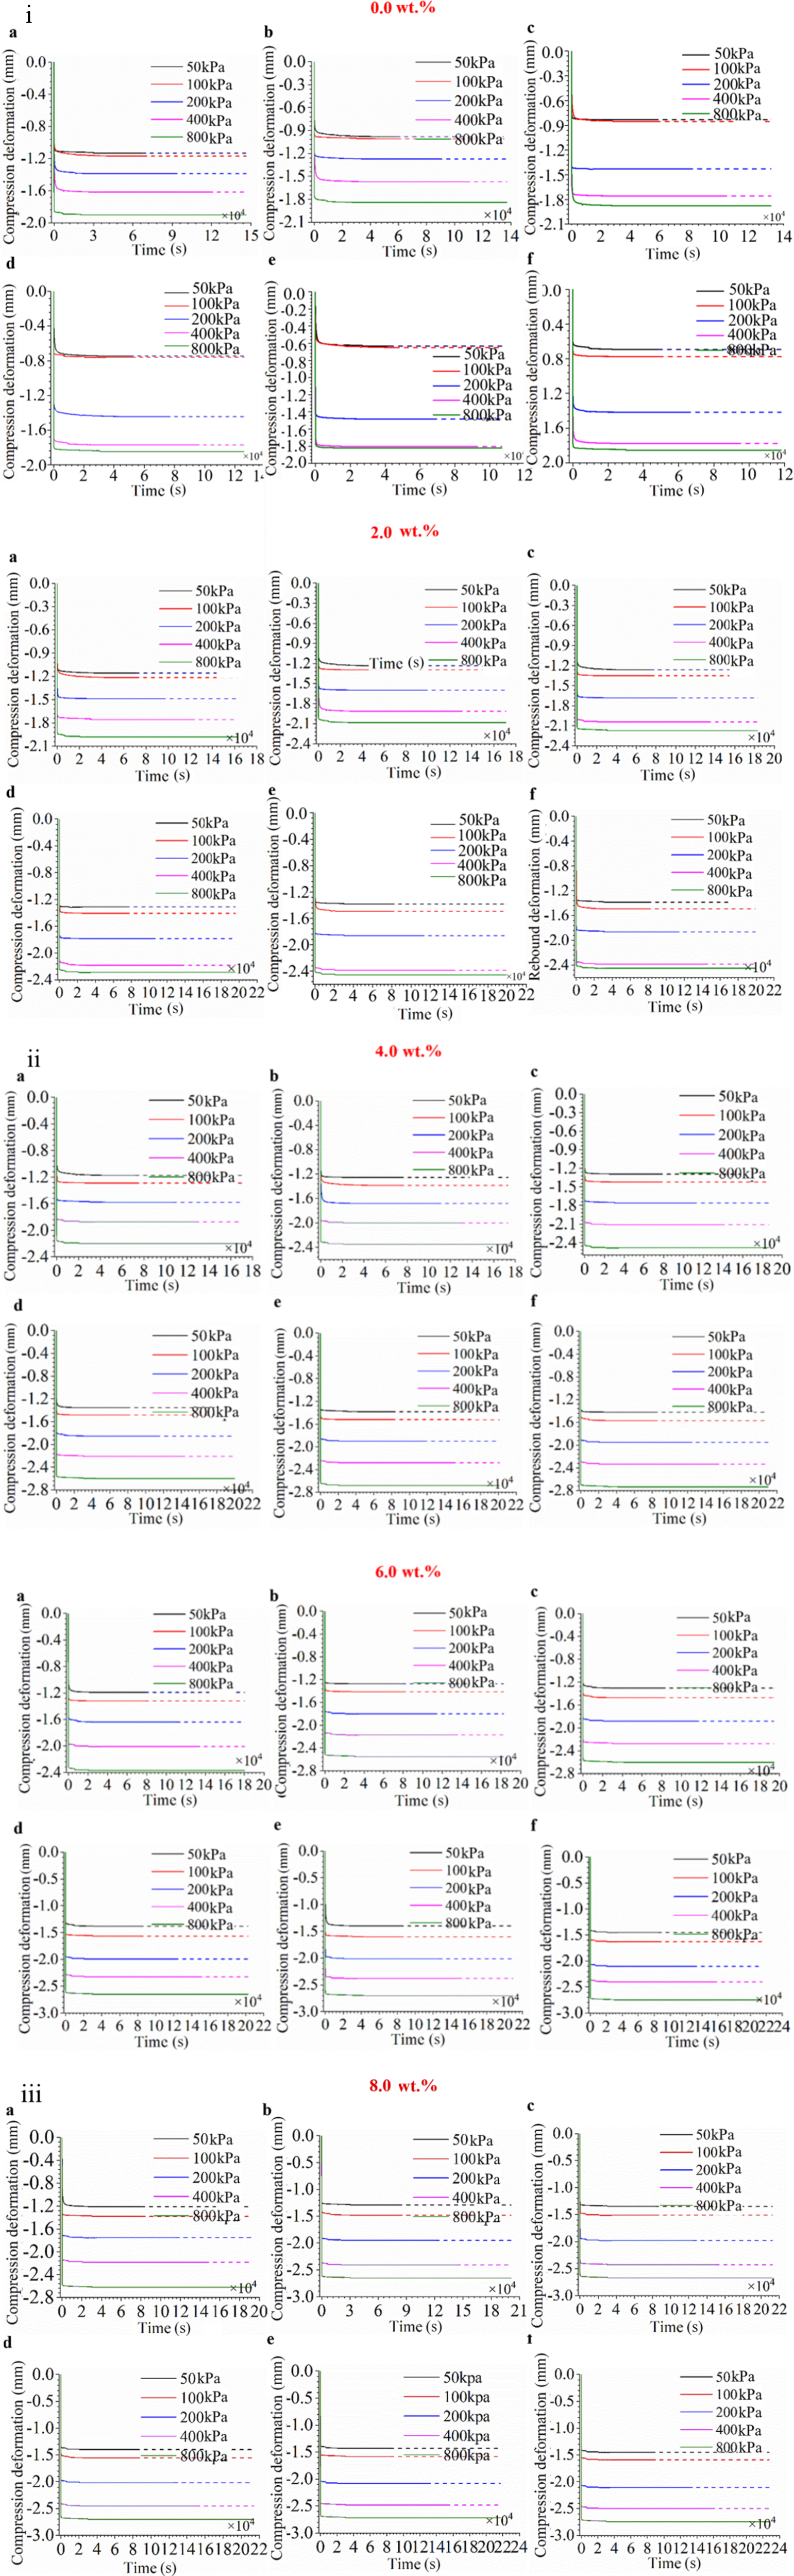
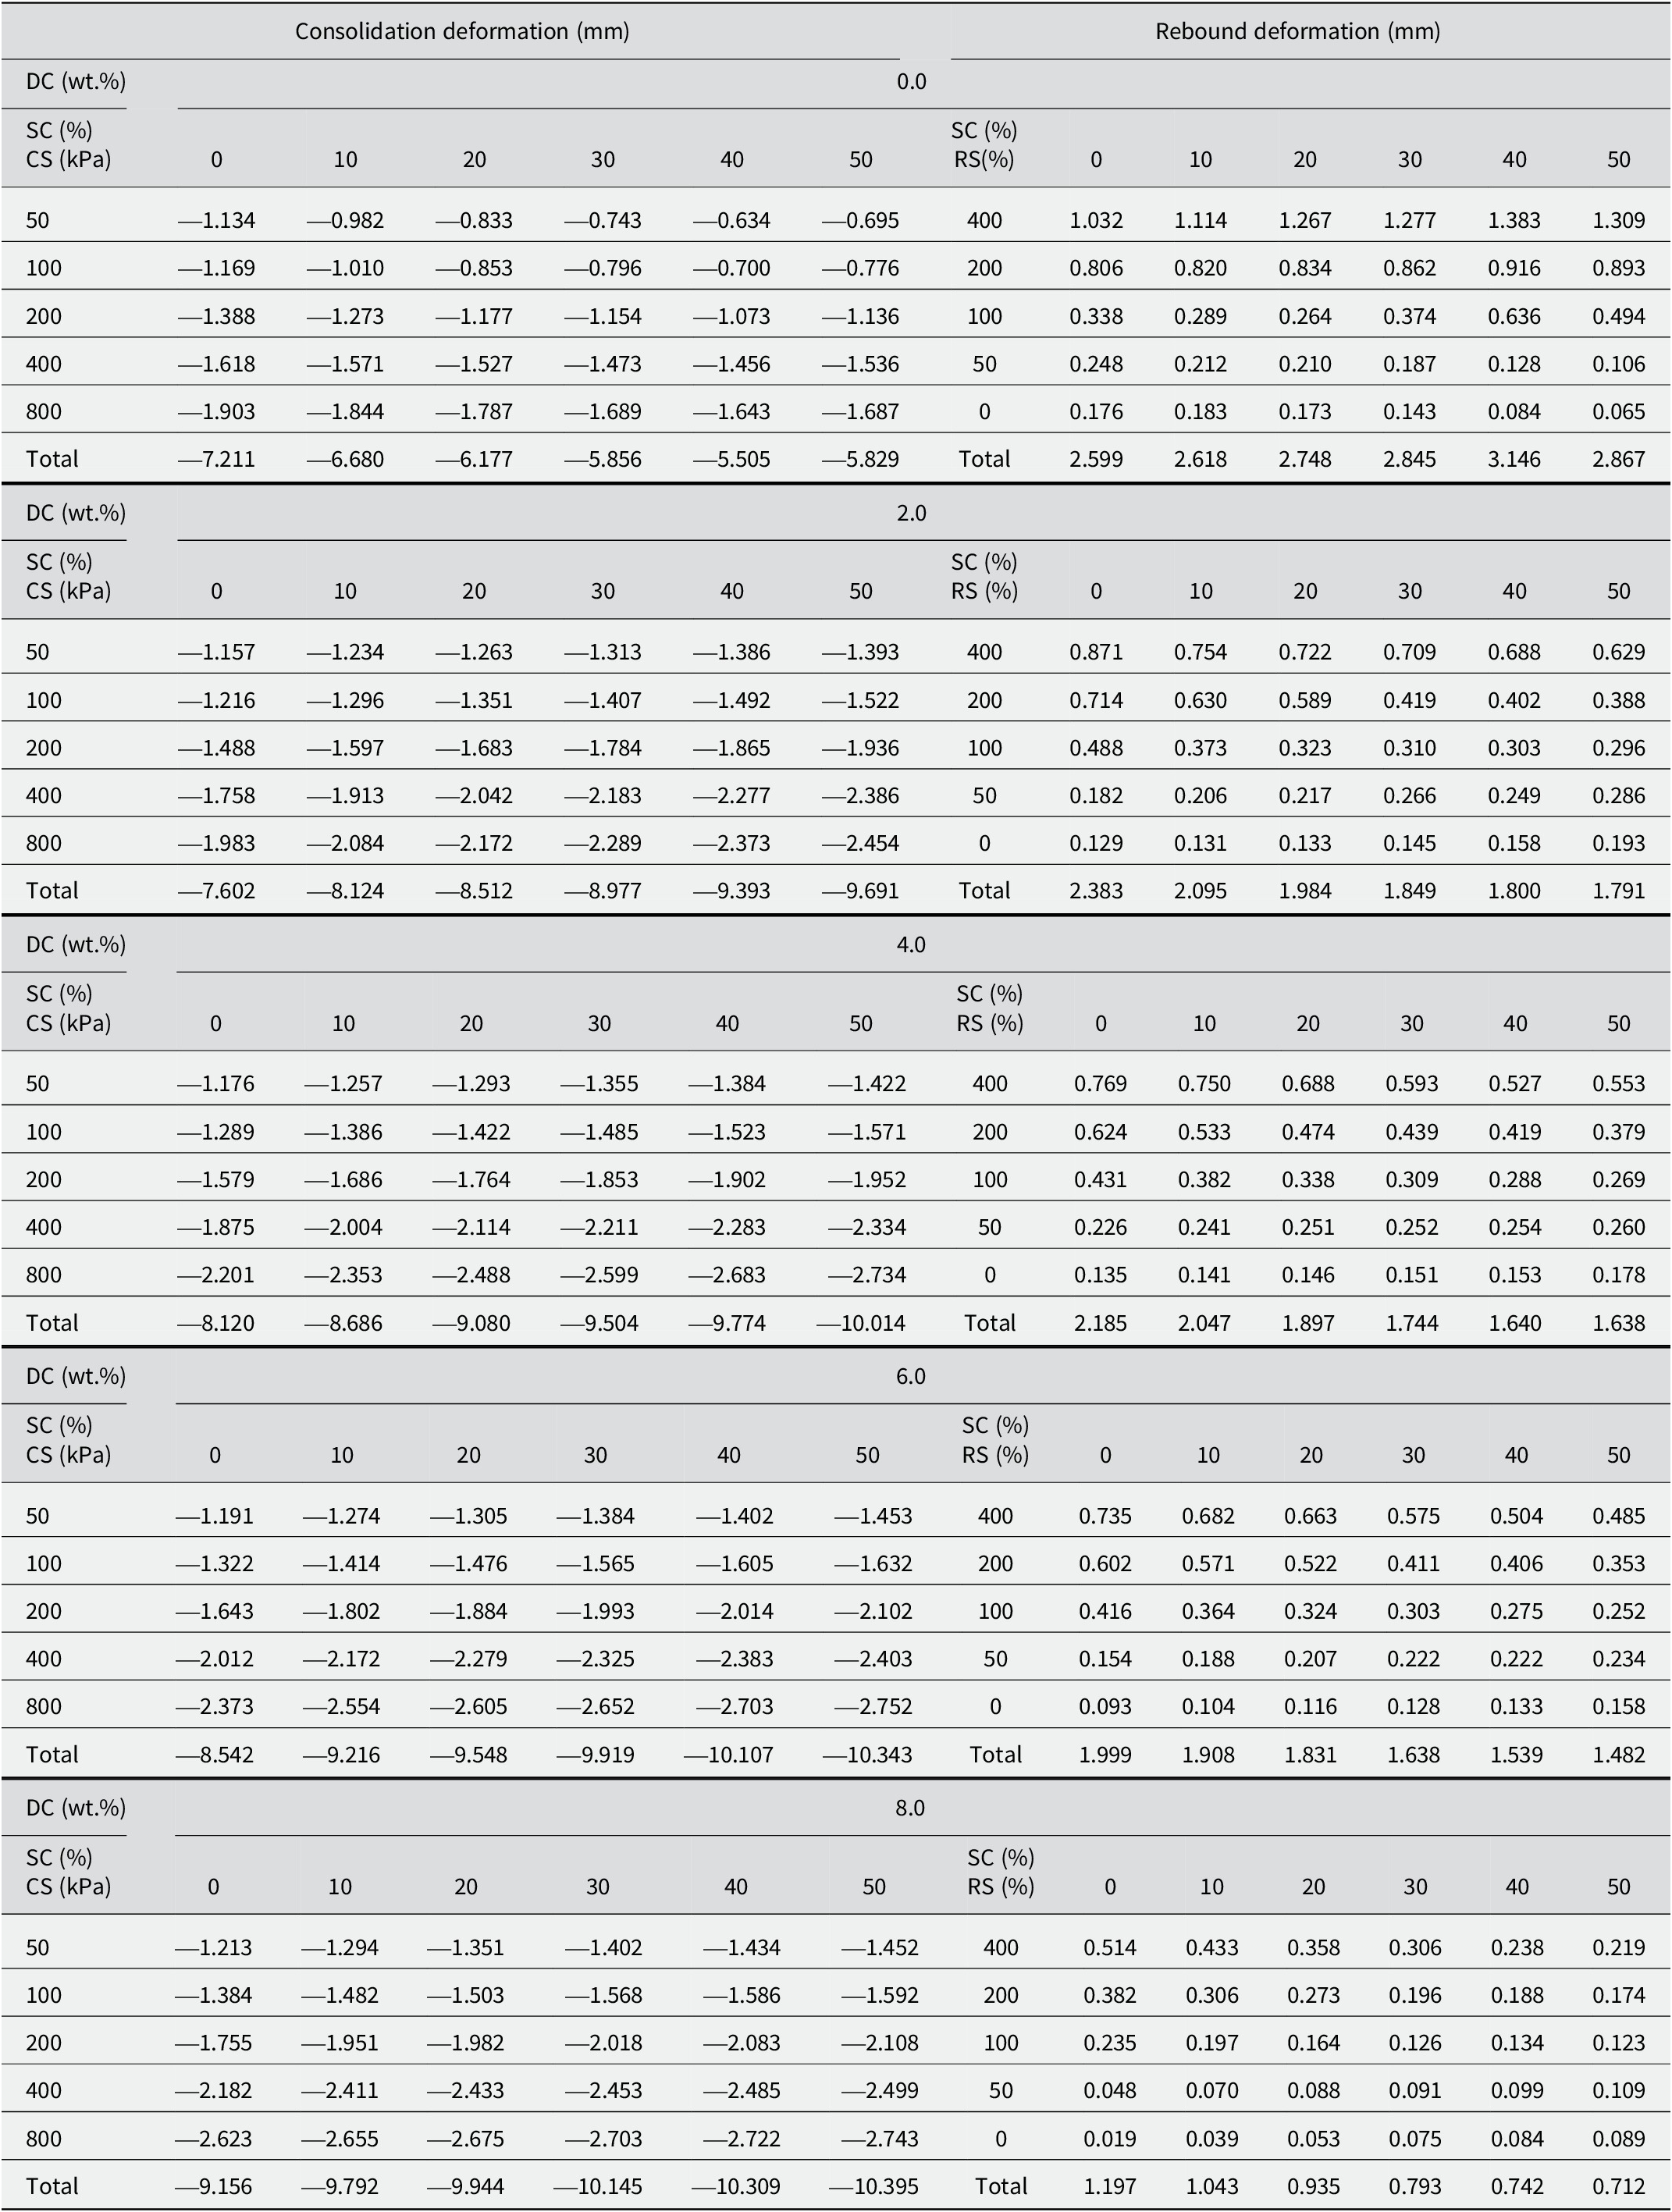
The consolidation deformation–time curves of soil mixtures with various diesel contents and sand proportions subjected to multi-level consolidation pressures are shown in Fig. 1. Figures 1i–iii correspond to diesel contents of 0, 2.0, 4.0, 6.0, and 8.0 wt.%, respectively. The stabilized displacement values under each consolidation pressure are listed in Table 2. The results demonstrated that diesel contamination markedly altered the consolidation deformation mechanism of the soil mixtures with increasing sand content, resulting in evolution patterns distinct from those of conventional behaviors.
(i) Consolidation deformation–time curves of soil mixtures under diesel contamination levels of 0.0 wt.% and 2.0 wt.%; (a–f) sand contents of 9%, 10%, 20%, 30%, 40%, and 50%, respectively. (ii) Consolidation deformation–time curves of soil mixtures under diesel contamination levels of 4.0 wt.% and 6.0 wt.%; (a–f) sand contents of 0%, 10%, 20%, 30%, 40%, and 50%, respectively. (iii) Consolidation deformation–time curves of soil mixtures under diesel contamination levels of 8.0 wt.%; (a–f) sand contents of 0%, 10%, 20%, 30%, 40%, and 50%, respectively.

Consolidation/rebound deformation of mixed soil under various diesel and sand contents

DC = diesel content (wt.%); SC = sand content (%); CS = consolidation stress (kPa); RS = rebound stress (kPa); the units for consolidation/rebound displacement in the table are millimeters.
Specifically, in uncontaminated soils, the total displacement initially decreased but then increased with increase in sand content, identifying 40% sand as a critical threshold for behavioral transition. Ural and Burak (Reference Ural and Burak2019) achieved similar research results, but the findings by Anderson (Reference Anderson1968) contradict them. For instance, at 100 kPa, the displacement decreased from 1.169 mm to 0.700 mm as the sand content increased from 0% to 40%, but rebounded to 0.776 mm at 50% sand. Thus, the sand content substantially influences the deformation mechanism, with a clear threshold beyond which qualitative changes in the soil behavior occur.
The deformation response of diesel-contaminated soil exhibited a distinct pattern, with the total displacement showing a monotonically increasing trend with increasing sand content. For instance, at a diesel content of 4.0 wt.%, the displacement increased from 8.120 mm to 10.014 mm. Furthermore, under a constant sand content, displacement increased with increasing diesel concentration. For example, at 40% sand content, the displacement increased from 5.505 mm at 0 wt.% diesel to 10.309 mm at 8.0 wt.%. Diesel contamination also influenced deformation development under various pressure levels. Although all the mixtures showed increasing displacement with increasing consolidation pressure, their deformation potential varied markedly. When the diesel content was <4.0 wt.%, the increase in displacement gradually increased within the 0–400 kPa range, peaking at 0.3987 mm between 200 and 400 kPa, and decreased to 0.107 mm above 400 kPa. In contrast, when the diesel content exceeded 4.0 wt.%, the increase in displacement continued to increase with increasing pressure without an initial increase followed by a decrease. These results indicate that the coupling effect of sand and diesel alter the consolidation deformation behavior of mixed soils significantly through a complex mechanism closely related to the threshold contents in the material formulation.
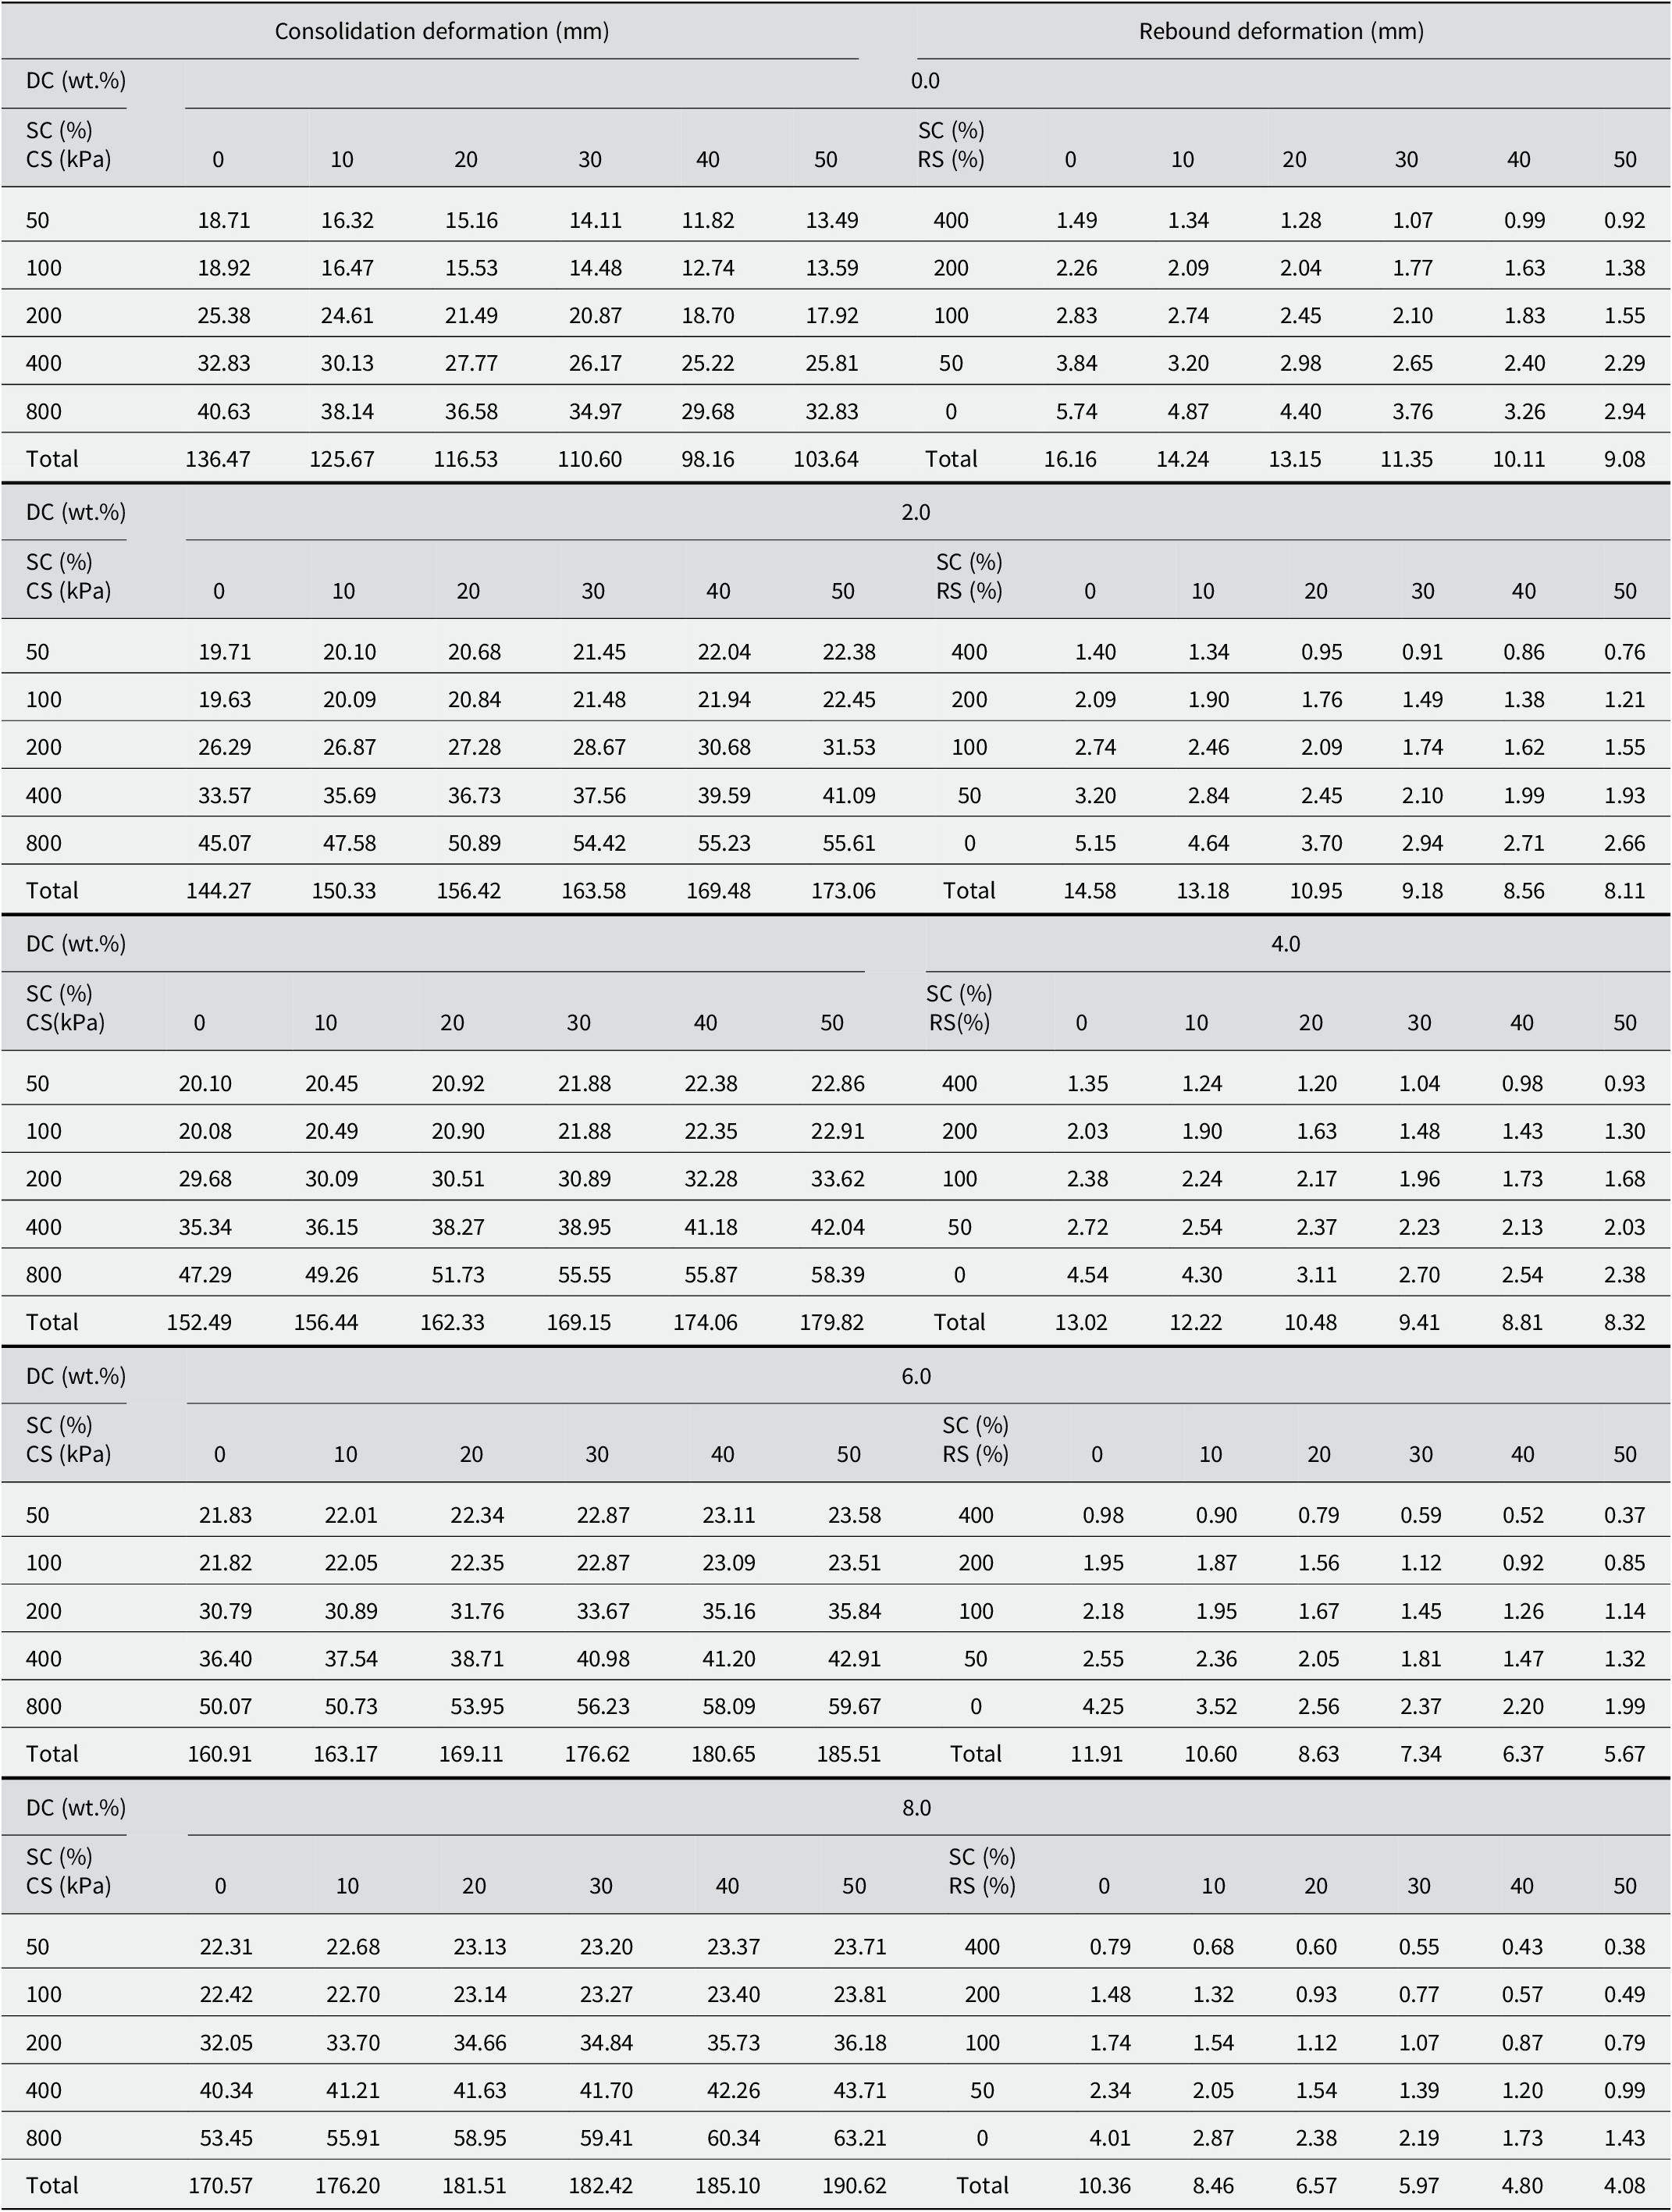
The present study also examined the effects of the diesel and sand contents on the time required for soil to reach consolidation stabilization. Table 3 details the stabilization times under various conditions. The results reveal distinct trends between uncontaminated and contaminated soils. In uncontaminated soils, the stabilization time initially decreased from 136.47 h to 98.16 h and then increased to 103.64 h with increasing sand content, with 40% sand content representing the transition point. A consistent pattern was observed across consolidation pressure levels. In contrast, for contaminated soils, the stabilization time increased with both the diesel and sand contents. At 10% sand content and 50 kPa consolidation pressure, the stabilization time increased from 16.32 h to 22.01 h as the diesel content increased from 0 to 6.0 wt.%. Similarly, at 6.0 wt.% diesel and 50 kPa, the stabilization time increased from 21.83 h to 23.58 h with increasing sand content. These findings demonstrate that increased diesel and sand contents prolong the consolidation stabilization time in contaminated soils, highlighting the dependency on material composition and reflecting the complexity of consolidation behavior under contaminated conditions.
Stable time for consolidation/rebound deformation of mixed soil under various diesel and sand contents

DC = diesel content (wt.%); SC = sand content (%); CS = consolidation stress (kPa); RS = rebound stress (kPa); the units for consolidation/rebound displacement in the table are millimeters.
Rebound deformation characteristics of diesel-contaminated sand–bentonite soil
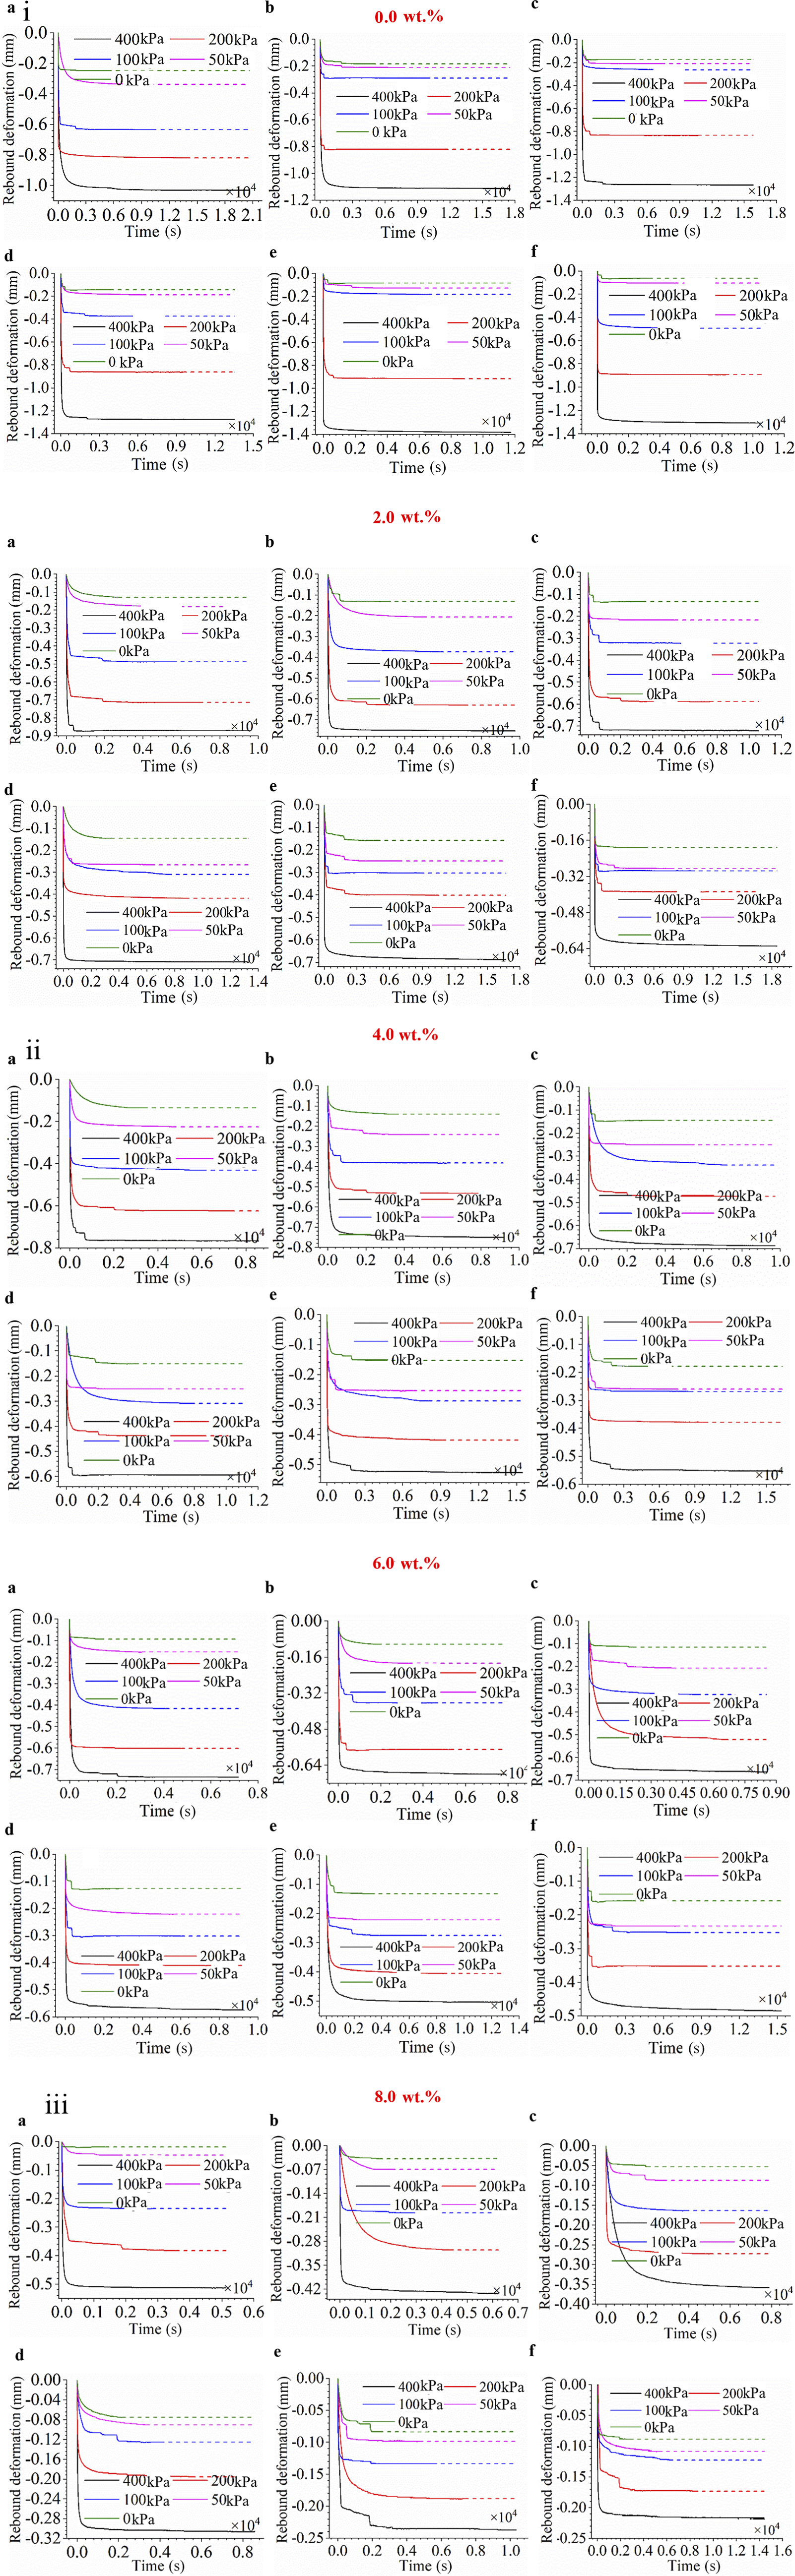
In the present study, the rebound deformation behavior of both uncontaminated and diesel-contaminated soils was analyzed systematically to investigate further the influence of diesel pollution on soil-deformation characteristics. The rebound deformation–time curves of the soil mixtures at diesel concentrations of 0.0, 2.0, 4.0, 6.0, and 8.0 wt.% are shown in Fig. 2i–2iii. The results indicated that the rebound deformation of uncontaminated soil exhibited distinct, two-stage, non-linear behavior with increasing sand content. As the sand content increased from 0 to 40%, the rebound deformation increased from 2.599 to 3.146 mm, indicating a continuous upward trend. When the sand content further increased from 40% to 50%, the rebound deformation decreased from 3.146 mm to 2.867 mm, indicating a declining trend. This pattern of initial increase followed by decrease was opposite to that observed in the consolidation phase, revealing a unique response mechanism during rebound. Furthermore, the rebound deformation increased monotonically with increasing consolidation pressure, a trend consistent with that in the consolidation stage, indicating the significant influence of consolidation pressure on the mechanical behavior of soils across different deformation stages.
(i) Rebound deformation–time curves of soil mixtures under diesel contamination levels of 0.0 wt.% and 2.0 wt.%; (a–f) sand contents of 0%, 20%, 30, %, 40%, and 50%, respectively. (ii) Rebound deformation–time curves of soil mixtures under diesel contamination levels of 4.0 wt.% and 6.0 wt.%; (a–f) sand contents of 0%, 10%, 20%, 30%, 40% and 50%, respectively. (iii) Rebound deformation–time curves of soil mixtures under diesel contamination levels of 8.0 wt.%; (a–f) sand contents of 0%, 10%, 20%, 30%, 40%, and 50%, respectively.

The rebound deformation of diesel-contaminated soils decreased significantly with increasing diesel content. For example, at 30% sand content, the rebound deformation decreased markedly from 2.845 mm to 0.793 mm as the diesel content increased, indicating an inhibitory effect of diesel contamination on the elastic recovery capacity of the soil. The influence of the sand content on the rebound characteristics of contaminated soils was more complex and depended on the consolidation pressure. Within the higher pressure range of 100–400 kPa, rebound deformation decreased with increasing sand content. For instance, at 6.0 wt.% diesel and a consolidation pressure of 200 kPa, the rebound deformation decreased from 0.602 mm at 0% sand content to 0.353 mm at 50% sand content. Conversely, under lower consolidation pressures of 0–50 kPa, rebound deformation increased with increasing sand content. At 6.0 wt.% diesel and 50 kPa, it increased from 0.154 mm to 0.234 mm as the sand content increased from 0 to 50%. These results demonstrate that the effect of the sand content on the rebound behavior of contaminated soil is not governed by a single mechanism but is significantly modulated by the level of consolidation pressure, reflecting the non-linear response characteristics of contaminated soils under complex environmental conditions.
Relationship between void ratio, e, and consolidation pressure
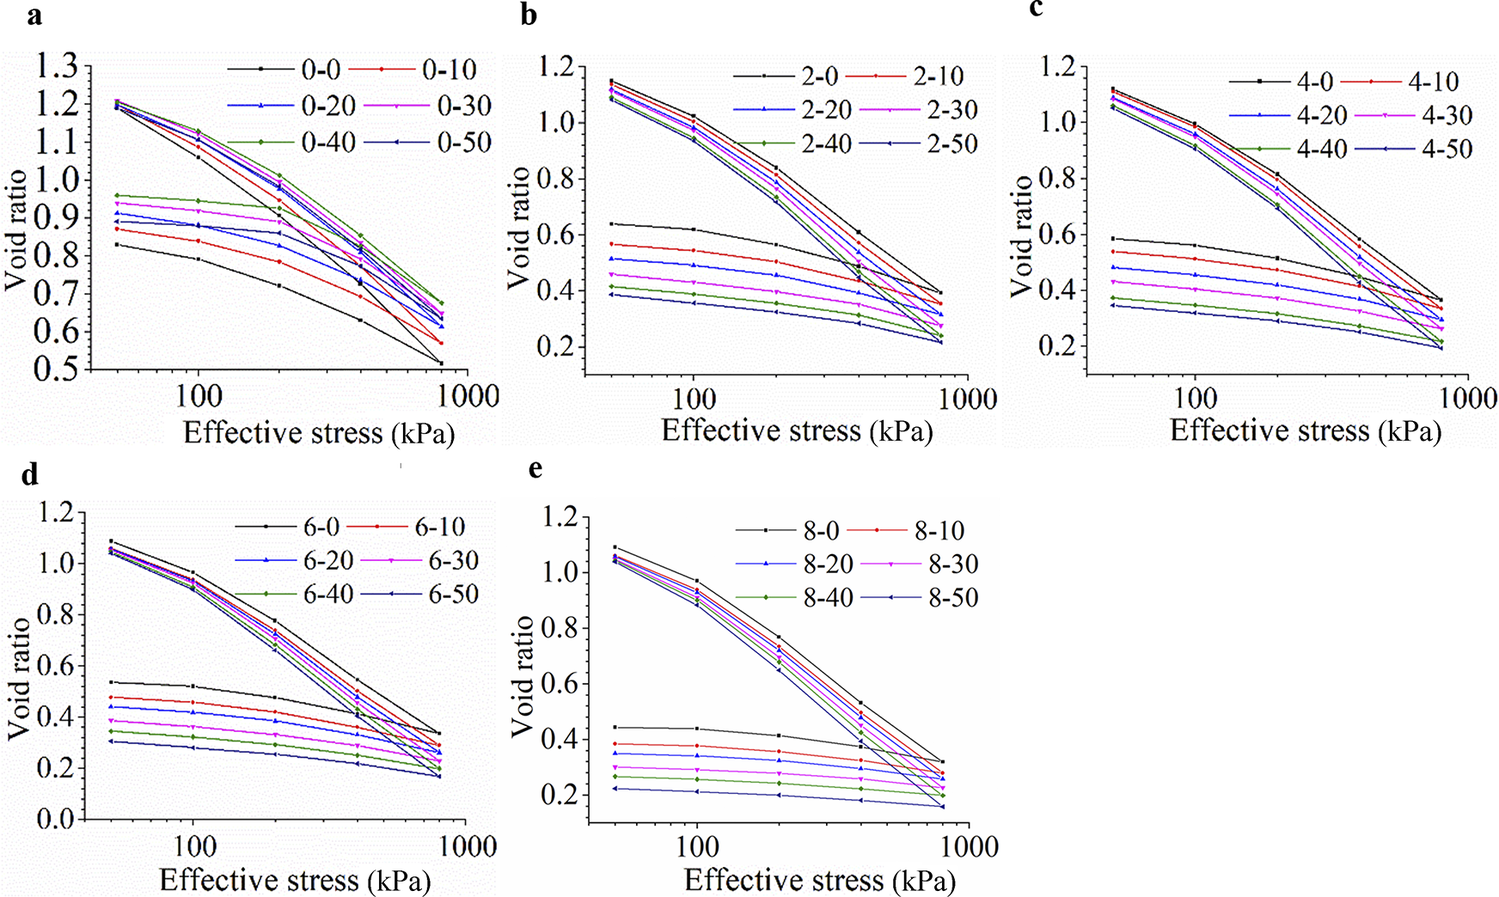
Compression curves (e–logp curves) for sand–bentonite mixtures with various sand and diesel contents were plotted with void ratio, e, on the vertical axis and logarithmic stress, log p, on the horizontal axis. The diesel contents of 0.0, 2.0, 4.0, 6.0, and 8.0 wt.% are shown in Fig. 3a–e, respectively. The curves exhibited a consistent shape across all proportions, and the compression behavior generally conformed to that typical of cohesive soils, although the magnitude of the void ratio variation differed significantly. Under uncontaminated conditions (0 wt.% diesel), the void ratio, e, increased initially but then decreased with increasing sand content, increasing from 1.19 at 0% sand to 1.22 at 40% sand and then declining to 1.20 at 50% sand. This non-monotonic trend was closely related to changes in the particle-size distribution and pore structure. As the consolidation stress increased, the void ratio decreased gradually in all specimens. When the effective stress exceeded 100 kPa, the e–logp relationship entered a linearly decreasing phase, indicating that the soil had reached a normally consolidated state. However, the compression index was significantly influenced by both sand and diesel contents. A greater sand content resulted in a faster decrease in the void ratio, e. Diesel contamination altered the compressive response further: contaminated samples generally had lower void ratios, with increasing sand and diesel contents, and the rate of linear decrease in e was greater at higher sand contents. These findings demonstrate that diesel and sand act synergistically to enhance the compression deformation effect.
The relationship between the stage void ratio and consolidation pressure. (a–e) Diesel contents of 0.0 wt.%, 2.0 wt.%, 6.0 wt.%, and 8.0 wt.%, respectively.

During the unloading–rebound stage, e of the uncontaminated specimens increased as the stress decreased, although the change was not entirely linear, differing from the linear rebound behavior observed in previous studies (Ural and Burak, Reference Ural and Burak2019). The increase in e was relatively rapid in the initial rebound phase and gradually slowed in the later stage, suggesting a potentially complex response during unloading. In contrast, e of the contaminated specimens increased approximately linearly during rebound, with the growth rate increasing as the sand content increased, indicating that diesel enhanced the rebound capacity of the mixed soil. In summary, both sand and diesel contamination influenced quantitatively the compressibility and rebound behavior of the sand–bentonite mixture, particularly under high-stress conditions and during unloading.
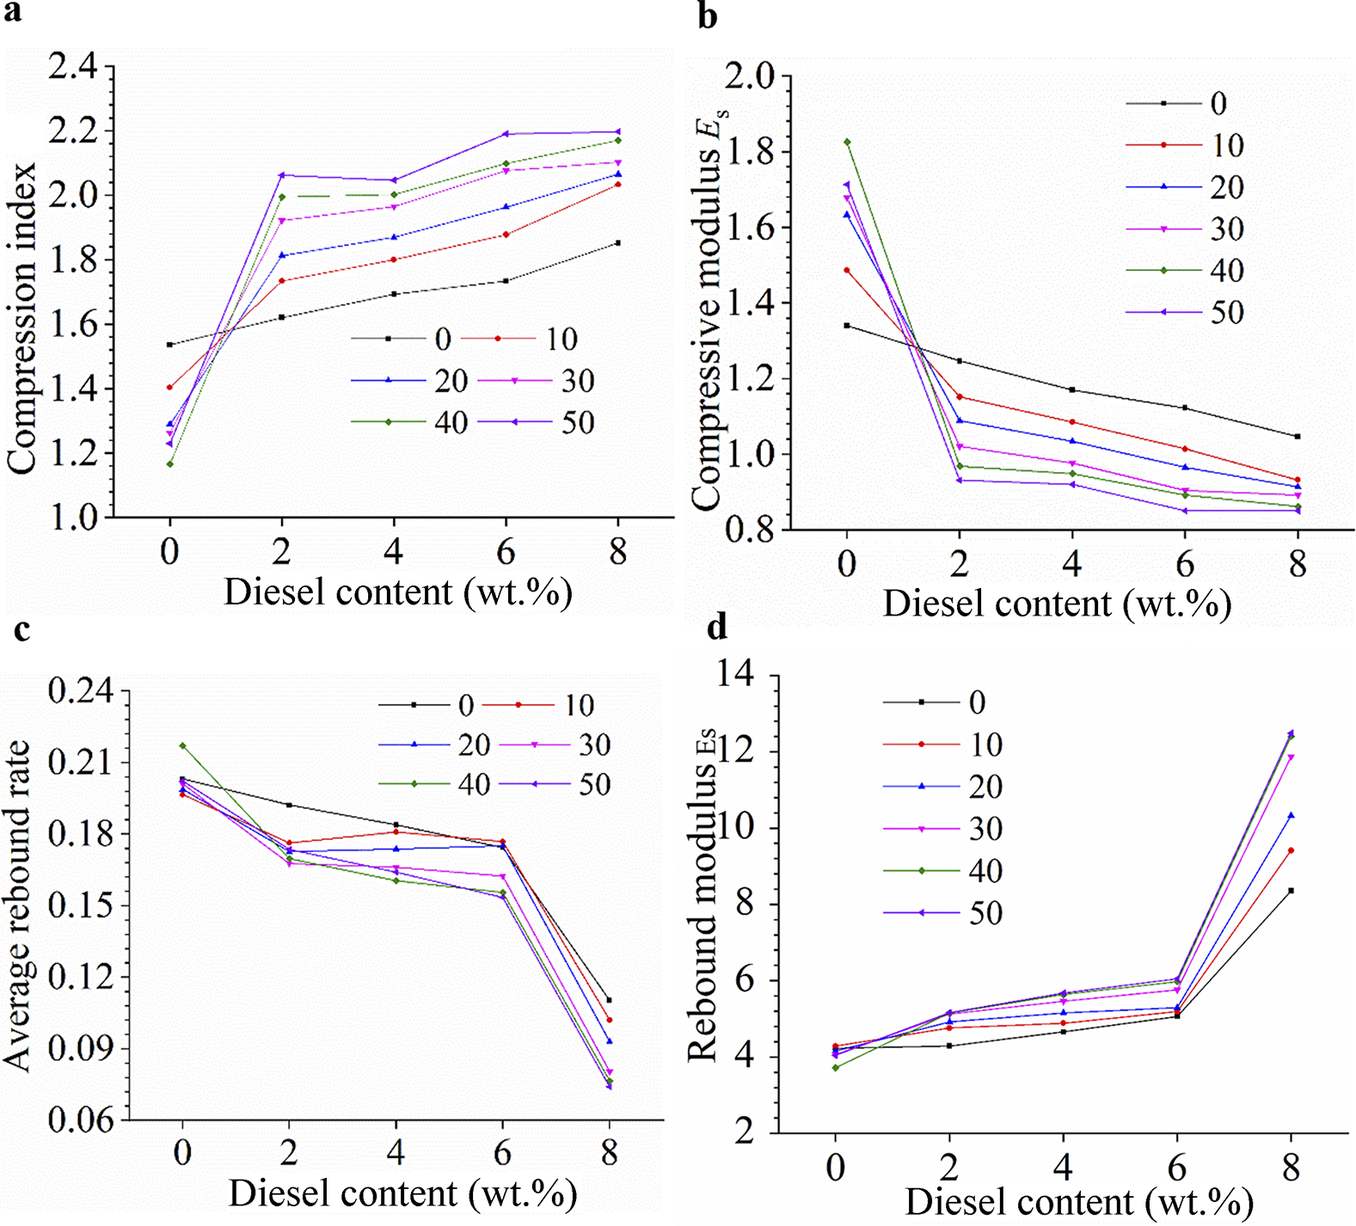
Analysis of the e–logp curves provided compressibility parameters, including the compression index (C c) and compression modulus (E s), for soils under varying sand contents and diesel contamination levels, as summarized in Fig. 4. The results indicated that the compression index, C c, of uncontaminated soil decreased initially from 1.53 at 0% sand to 1.16 at 40% sand and then increased to 1.23 at 50% sand. Similarly, the compression modulus, E s, first increased from 1.34 to 1.82 and then decreased to 1.71 at 50% sand content. This non-monotonic behavior suggests that a moderate sand content enhances the soil’s structural stability and compression resistance, whereas an excessive sand content leads to increased compressibility. With respect to contaminated soil, the C c consistently increased with increasing diesel content. For instance, at 30% sand content, C c increased from 1.26 at 0.0 wt.% diesel to 2.10 at 8.0 w.t%, whereas E s decreased accordingly. Moreover, under a fixed diesel content, C c tended to increase continuously, and E s continued to decrease with increasing sand content, indicating that the coupled effect of sand and diesel further amplifies soil compressibility. This differs sharply from the behavior of uncontaminated soil at medium to high sand contents. In conclusion, the influence of the sand content on the compressibility of uncontaminated soil is optimal, beyond which the compressibility increases again, whereas diesel contamination significantly increases soil compressibility, and its synergistic interaction with the sand content leads to further deterioration in mechanical performance.
Consolidation–rebound deformation parameters of soil under various diesel and sand contents: (a) compression coefficient, (b) compression modulus, (c) rebound rate, and (d) rebound modulus.

The rebound ratio, δ, of uncontaminated soil increased initially followed by a decrease with increasing sand content, increasing from 0.51 for 0% sand to 0.58 for 40% sand before decreasing to 0.54 for 50% sand. This trend, which contrasts with that of the compression index, C c, indicates that a moderate sand content enhances the elastic recovery capacity of the soil, whereas an excessively high sand content may reduce the elastic performance. Under contaminated conditions, the rebound ratio, δ, decreased gradually with increasing sand content. For example, at a diesel content of 4.0 wt.%, δ decreased from 0.18 at 0% sand to 0.16 at 50% sand, demonstrating a systematic deterioration in elastic recovery with increasing sand content. Moreover, the rebound modulus, E c, showed an opposite trend to that of δ, further confirming the significant coupled influence of diesel contamination and sand particles on the elastoplastic response of the soil. These results suggest that under uncontaminated conditions, incorporating sand within a certain range improves the rebound behavior, with the soil transitioning from a lower to a higher rebound state, whereas excessive sand content leads to reduced rebound capacity. In diesel-contaminated environments, increased sand content not only fails to enhance the structure but also synergizes with pollutants to promote permanent deformation, resulting in a continued decrease in rebound capacity.
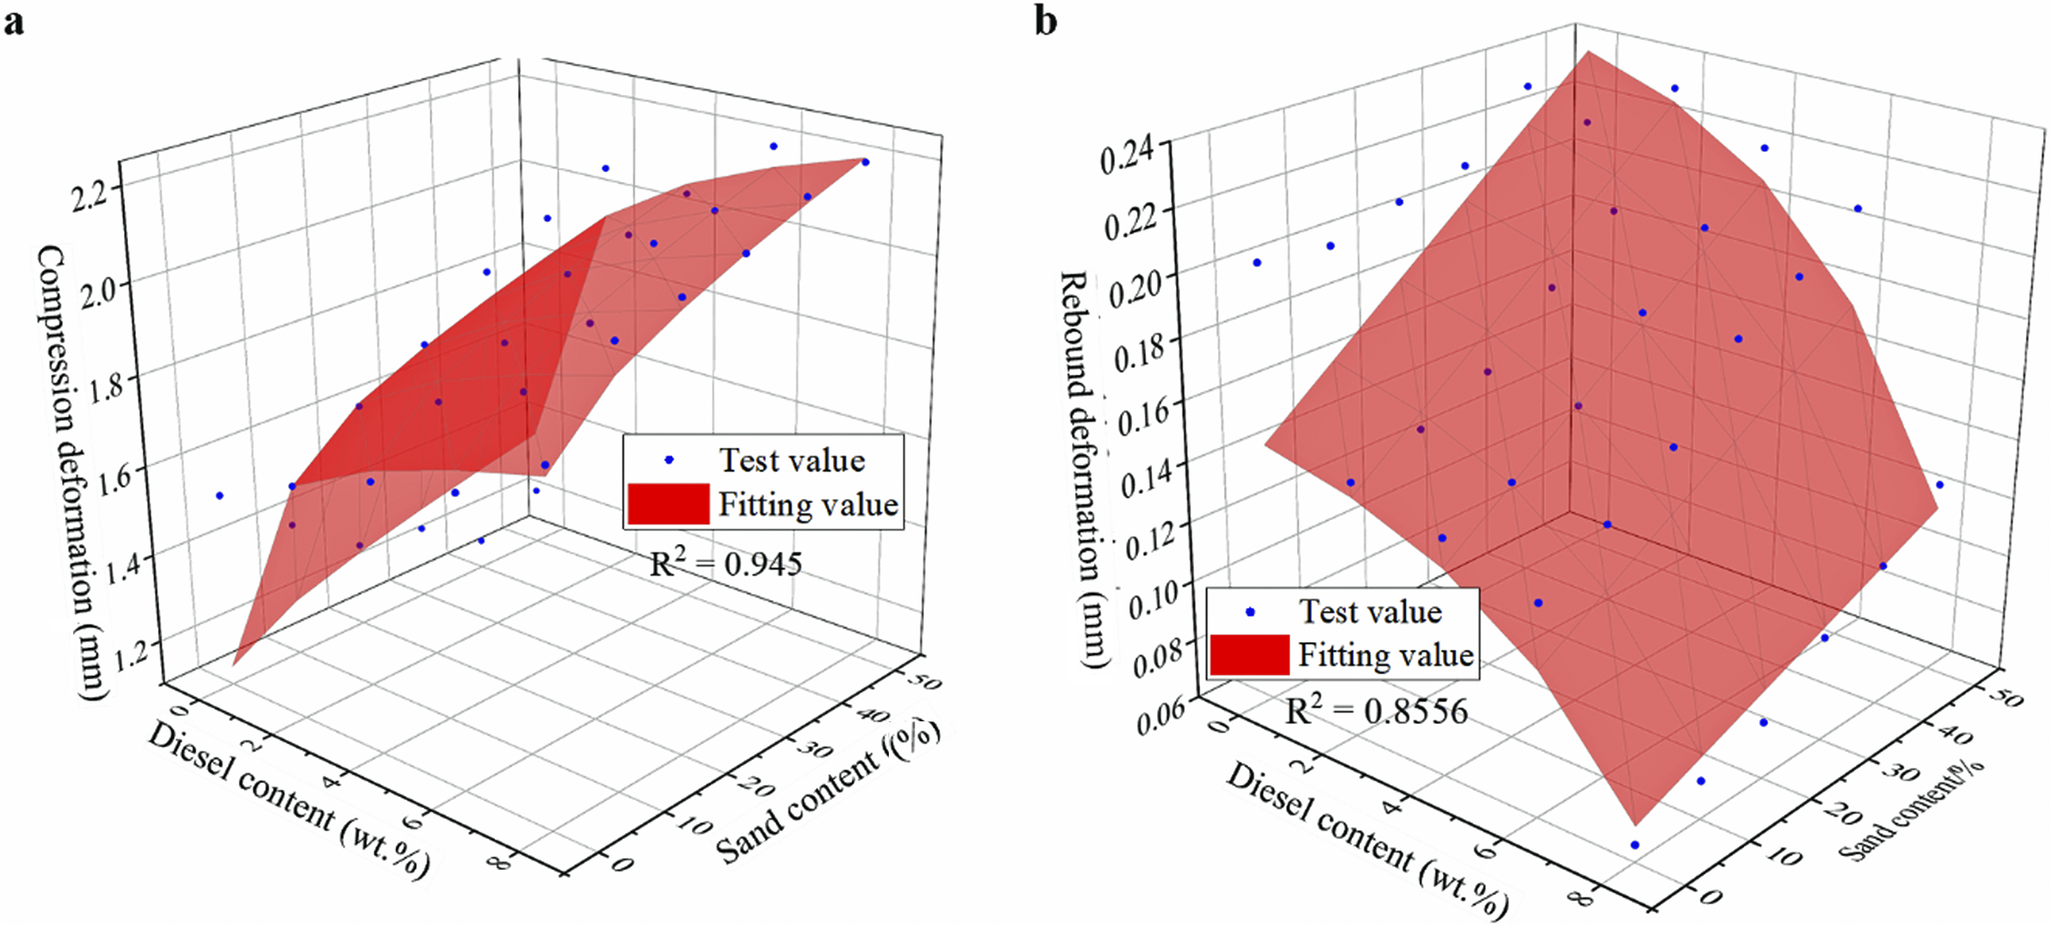
In this study, the evolution characteristics of the deformation behavior of sand–bentonite mixtures under the influence of diesel and sand content were analyzed comprehensively, and mathematical fitting methods were applied. The results (Fig. 5) indicated that the relationship between the sand and diesel contents and the compression index can be expressed by the function C c=(1.248+0.4383wd 0.2609)×(0.9138+0.016 ws 0.6299), with a goodness-of-fit R 2 of 0.945. Similarly, the relationship between the sand and diesel contents and the rebound rate, δ, are described by the function y=(–19.24+1.338wd)×(–1.008+0.999ws), with a goodness-of-fit R 2 of 0.8856.
Compression coefficient and rebound rate test values and fitted values. (a) Soil graph fitted with compression coefficient; (b) soil graph fitted with rebound rate.

Effect of the soil microstructure on the consolidation deformation
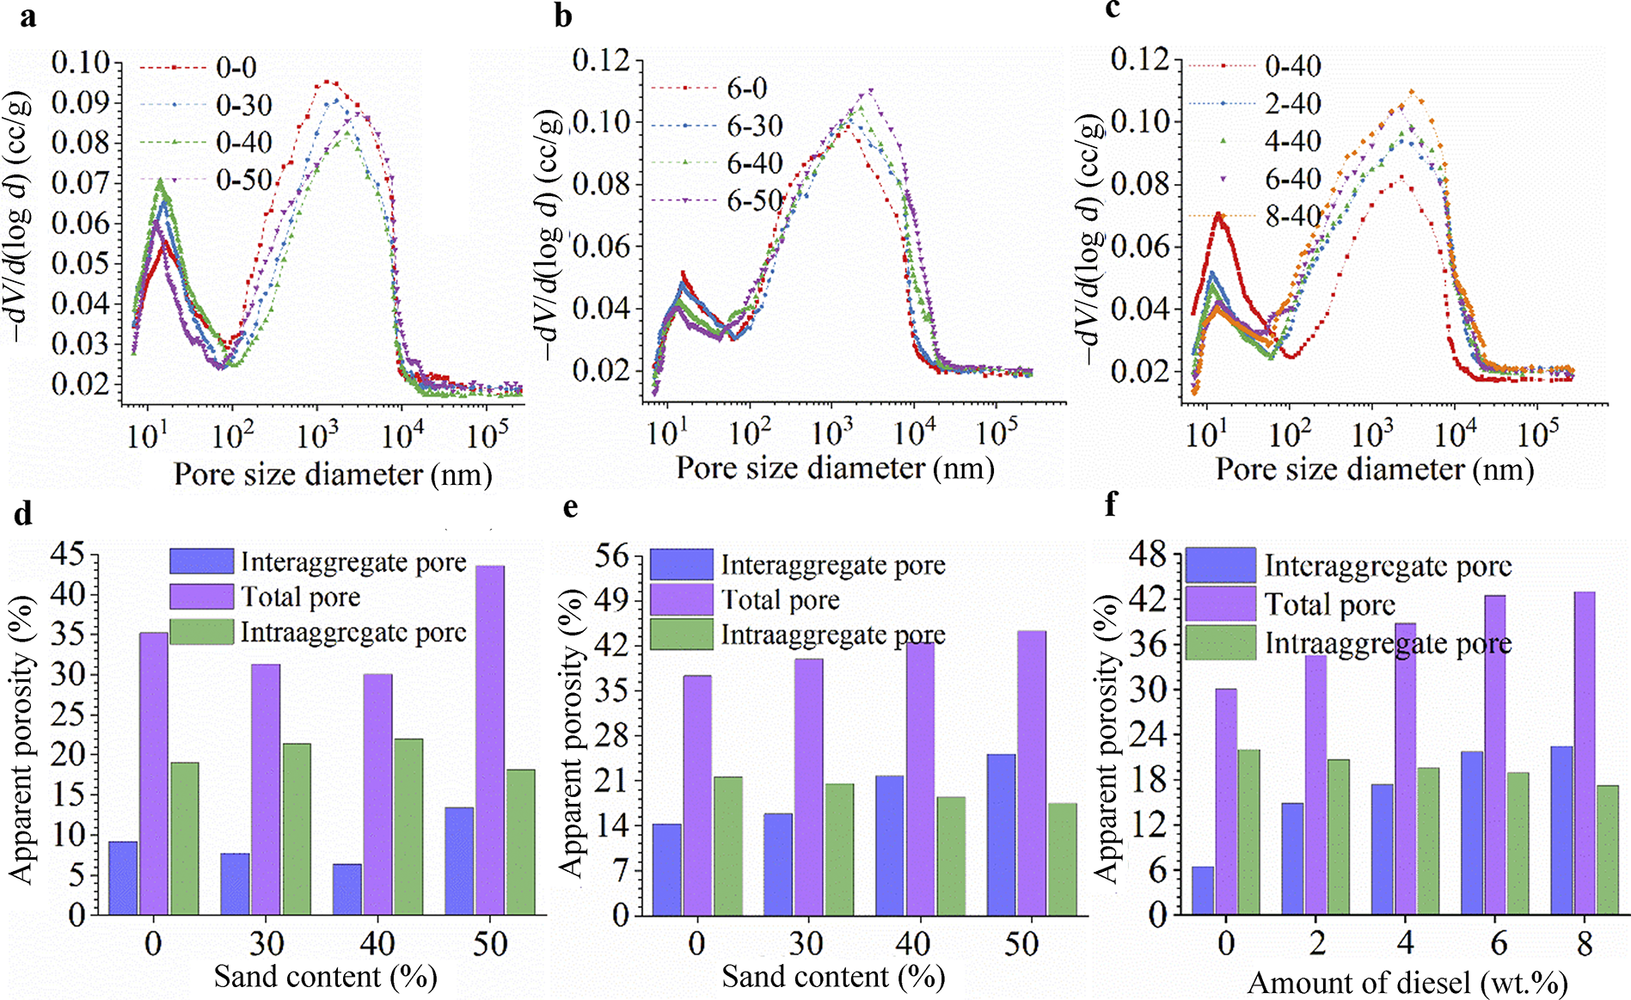
According to Terzaghi’s consolidation theory, soil consolidation deformation is fundamentally a process involving the displacement and rearrangement of soil particles, with its deformation capacity governed primarily by the size and distribution of internal pore spaces (Wu et al., Reference Wu, Tan and Yang2013a; Pal and Deb, Reference Pal and Deb2023). To investigate the consolidation behavior and microscopic mechanisms of sand–bentonite mixtures under diesel contamination, systematic pore structure tests, including mercury intrusion porosimetry (MIP), pore-size distribution curves, and variations in key pore structural parameters were conducted under various diesel and sand contents. The results (Table 4; Fig. 6) revealed a typical bi-modal pore-size distribution across all mixture proportions, indicating that the pore system consists mainly of two types of pores: inter-aggregate pores, with sizes predominantly ranging between 19,088.13 and 69.03 nm, and intra-aggregate pores, mostly concentrated within 69.03–6.69 nm. The distribution ranges and peak locations of these pores varied significantly with changes in the sand and diesel contents, reflecting substantial alterations in the soil structure due to the additives.
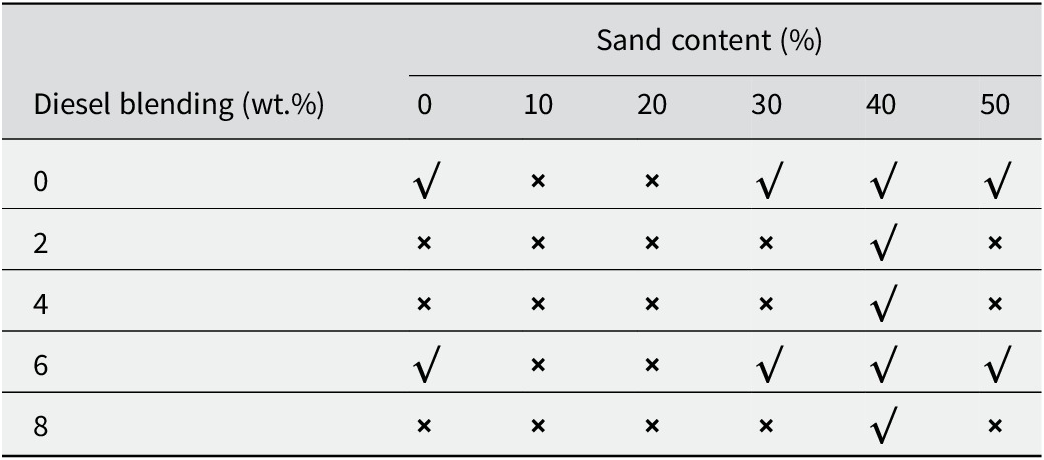
Pore-structure and soil-particle size distribution measurement scheme

√ = experiments conducted; × = no experiments conducted.
Pore-distribution curve and pore-structure parameters of soil under various diesel and sand contents. (a–c) Soil-pore distribution curve; (e–f) porosity-variation characteristics.

Further analysis of porosity changes revealed that uncontaminated and contaminated soils exhibited distinct responses to increasing sand content. In uncontaminated soils, the total porosity first decreased from 35.23% at 0% sand to 30.05% at 40% sand, and then increased to 43.57% at 50% sand. The inter-aggregate porosity followed a similar trend, declining gradually from 9.23% to 6.38% at 40% sand before increasing markedly to 13.43% at 50% sand, whereas the intra-aggregate porosity first increased from 19.05% to 22.01% at 40% sand and then decreased to 18.17% at 50% sand. This non-monotonic variation suggested that moderate sand content (≤40%) filled larger pores and enhanced compactness, whereas excessive sand content (50%) resulted in structural loosening because of particle skeleton formation and disruption of the original fabric.
In the contaminated soils, the porosity increased continuously with increasing sand content. For instance, in the 6.0 wt.% diesel group, the total porosity increased from 37.32% to 44.31%, the inter-aggregate porosity increased significantly from 14.30% to 25.14%, and the intra-aggregate porosity decreased from 21.57% to 17.47%, indicating that diesel contamination weakened the inter-particle connections and that the higher sand content further exacerbated structural instability and overall loosening.
With the sand content fixed at 40%, increasing the diesel content from 0 to 8.0 wt.% led to an increase in total porosity from 30.05 to 43.02%, a substantial increase in inter-aggregate porosity from 6.49 to 22.49%, and a gradual decrease in intra-aggregate porosity from 22.01 to 17.24%, a trend consistent with previous research by Ural and Burak (Reference Ural and Burak2019), demonstrating that diesel contamination significantly reduced soil compactness and structural stability.
A looser soil structure offers less resistance to particle displacement and rearrangement under consolidation pressure (Wu et al., Reference Wu, Yang and Zhang2013b; Shi et al., Reference Shi, Jiang, Wang, Sun, Yuan and Pan2021); hence, soils with greater porosity are more prone to particle reorganization, resulting in greater consolidation deformation. Based on this mechanism, as the sand content increased, the consolidation deformation capacity of uncontaminated soil initially decreased because of reduced total porosity but subsequently increased with the recovery of porosity, whereas in contaminated soil, the deformation capacity increased continuously with both increasing total porosity and increasing sand content. Similarly, increased diesel content led to increased porosity in contaminated soil, further promoting consolidation deformation (Kanth and Maheshwari, Reference Kanth and Maheshwari2022; Paul and Chakrabortty, Reference Paul and Chakrabortty2024).
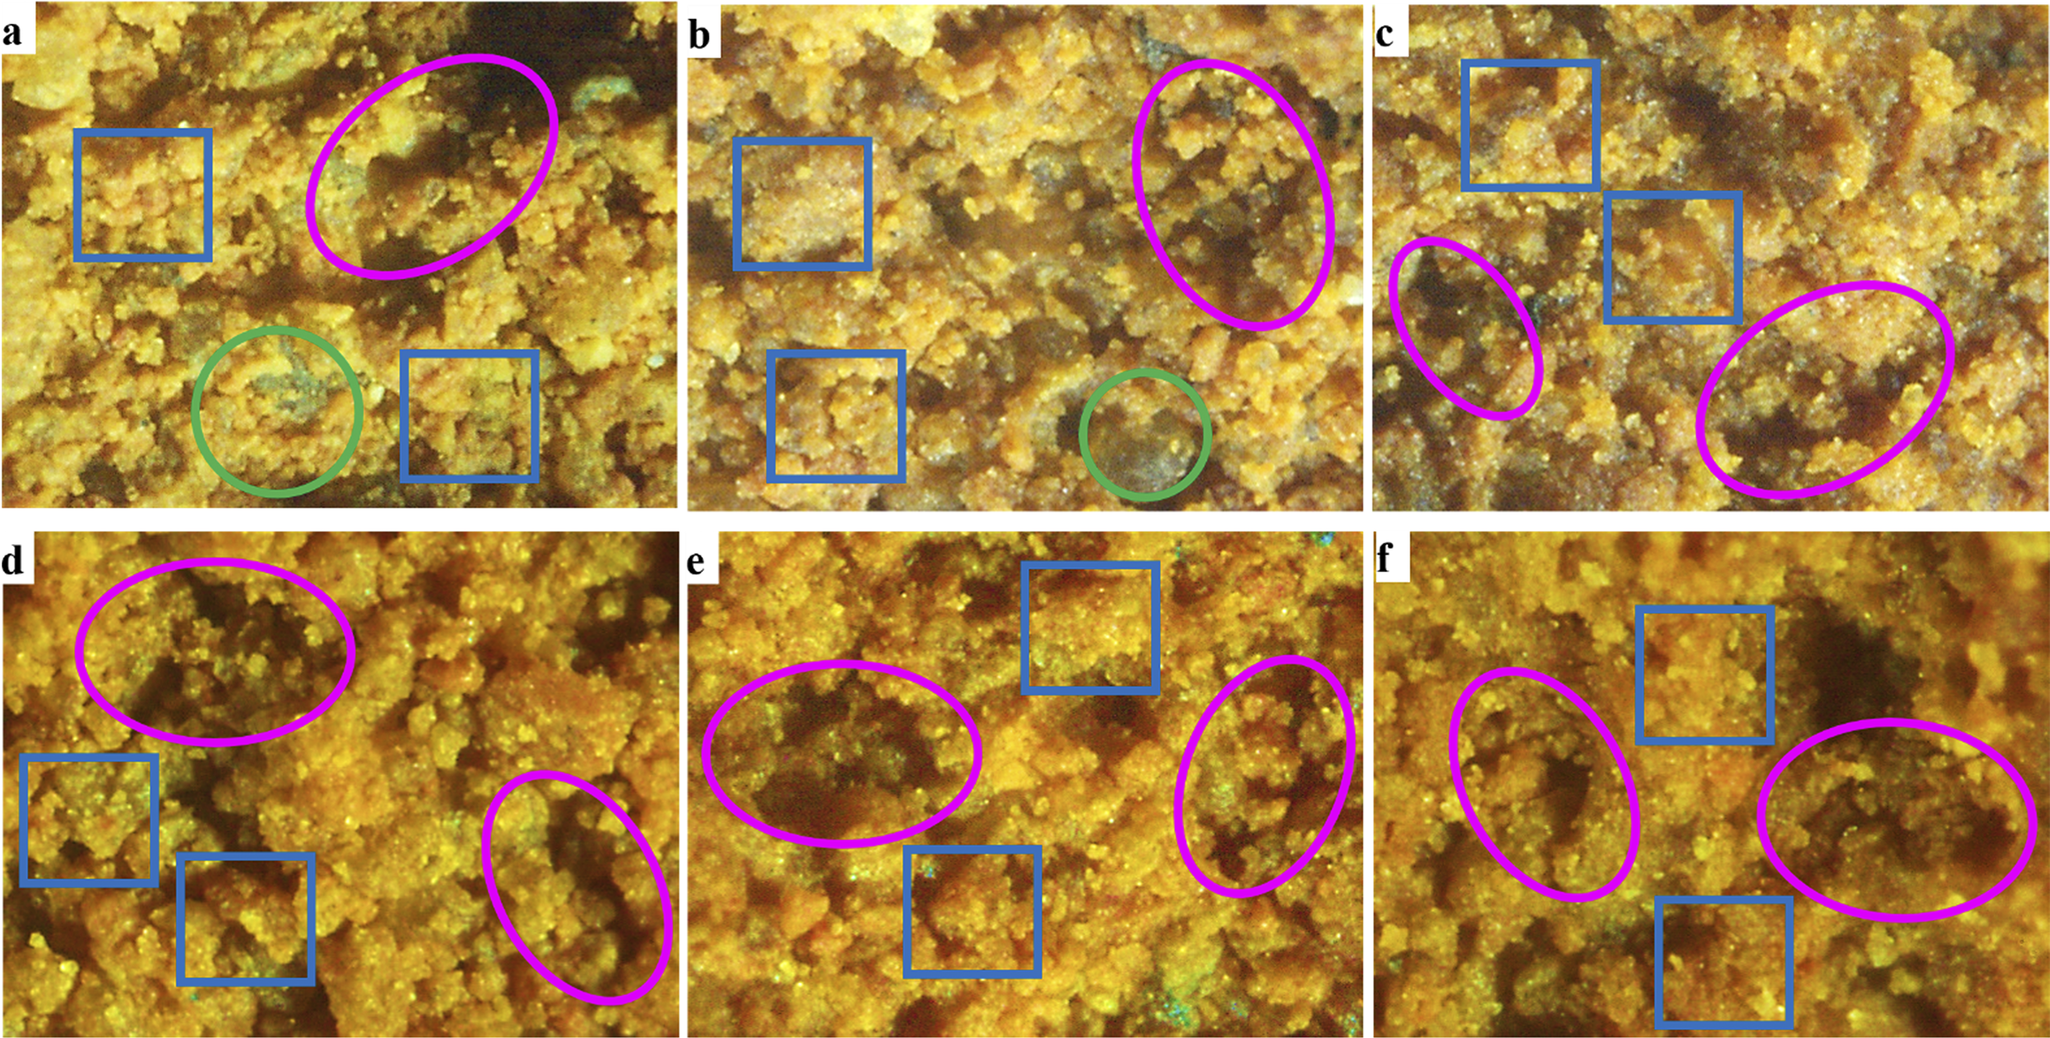
Notably, pores of different sizes play distinct roles during consolidation (Zimmerman, Reference Zimmerman1984). In the initial stage, deformation was dominated primarily by the translation of aggregate particles and the infilling of inter-aggregate pores, with the deformation magnitude primarily controlled by the inter-aggregate porosity (Wu et al., Reference Wu, Yang and Zhang2013b; Zeinali et al., Reference Zeinali and Abdelaziz2023). A higher inter-aggregate porosity implies greater deformation potential. Therefore, under consolidation pressures of 50 kPa and 100 kPa, the deformation of uncontaminated soil first decreased followed by increase with increasing sand content, whereas that of contaminated soil increased continuously. Comparisons between Fig. 7a and 7b revealed that after 100 kPa consolidation, the uncontaminated soil (0.0 wt.%, 40%) exhibited denser inter-aggregate packing and significantly reduced pore size (indicated by pink ellipses), whereas the diesel-contaminated soil (6.0 wt.%, 40%) initially showed larger pore structures and looser aggregates (Fig. 7d). Although some pores were compressed under the same pressure (pink ellipses in Fig. 7), partial aggregate breakdown occurred (blue boxes), indicating more irreversible microstructural adjustments under contamination.
Microscopic morphologies of the soil with diesel contents of 0.0 wt.% and 6.0 wt.% and a sand content of 40%. (a–c) Microscopic morphologies of the soil with a diesel admixture content of 0.0 wt.% under consolidation pressure of 0 kPa, 100 kPa, and 800 kPa, respectively; (d–f) microscopic morphologies of the soil with a diesel admixture content of 6.0 wt.% under consolidation pressures of 0 kPa, 100 kPa, and 800 kPa, respectively.

As consolidation progressed, the inter-aggregate pores were gradually compressed (Cavarretta et al., Reference Cavarretta, Coop and O’Sullivan2010; Yu et al., Reference Yu, Su and Peng2022), increasing the resistance to particle movement, and the first stage of consolidation ended (Delage et al., Reference Delage and Lefebvre1984; Altuhafi and Coop, Reference Altuhafi and Coop2011; Li et al., Reference Li, Gao and Chai2011). Under greater consolidation pressures (200–800 kPa), larger aggregates subsequently broke down, causing the initially stable skeleton structure to collapse and release new pore spaces, which triggered secondary particle rearrangement, marking the beginning of the second consolidation stage. The deformation capacity in this stage was closely related to the intra-aggregate porosity; greater intra-aggregate porosity provided more compressible space and greater deformation potential. In uncontaminated soil, the deformation in this stage increased with increasing intra-aggregate porosity, peaked, and then decreased. Microstructural images (Fig. 7c) revealed that the inter-aggregate pores mostly disappeared and that the aggregate boundaries became blurred.
The response of the contaminated soil differed distinctly during this stage, as deformation continued to increase despite the reduced intra-aggregate porosity (Izdebska-Mucha and Trzciński, Reference Izdebska-Mucha and Trzciński2021). This anomalous behavior was attributed to the presence of adsorbed diesel. During MIP testing, pore water was removed during freeze-drying, but the diesel phases adsorbed on the particle surfaces were retained (Hashemi et al., Reference Hashemi, Massart, Salager, Herrier and François2015; Sun et al., Reference Sun, Maín, Najser, Neděla and Navrátilová2020). These residual diesel components not only hindered mercury intrusion, leading to under-estimated porosity values, but more importantly, significantly weakened the interparticle bonding strength under high stress (Omotoso et al., Reference Omotoso, Munoz and Mikula2002; Stoffyn-Egli and Lee, Reference Stoffyn-Egli and Lee2002; Ji et al., Reference Ji, Boufadel, Zhao, Robinson and Lee2021). Although diesel-contaminated soil formed seemingly larger and more stable aggregates because of diesel binding, these aggregates underwent breakdown under high pressure (Fig. 7f), resulting in continued structural collapse and deformation development. Thus, the deformation capacity of the contaminated soil increased even during high-pressure consolidation.
In summary, the evolution of pore structure clearly delineates soil consolidation into two stages: the first dominated by the compression of inter-aggregate pores, and the second governed mainly by the compression of intra-aggregate pores and aggregate breakdown.
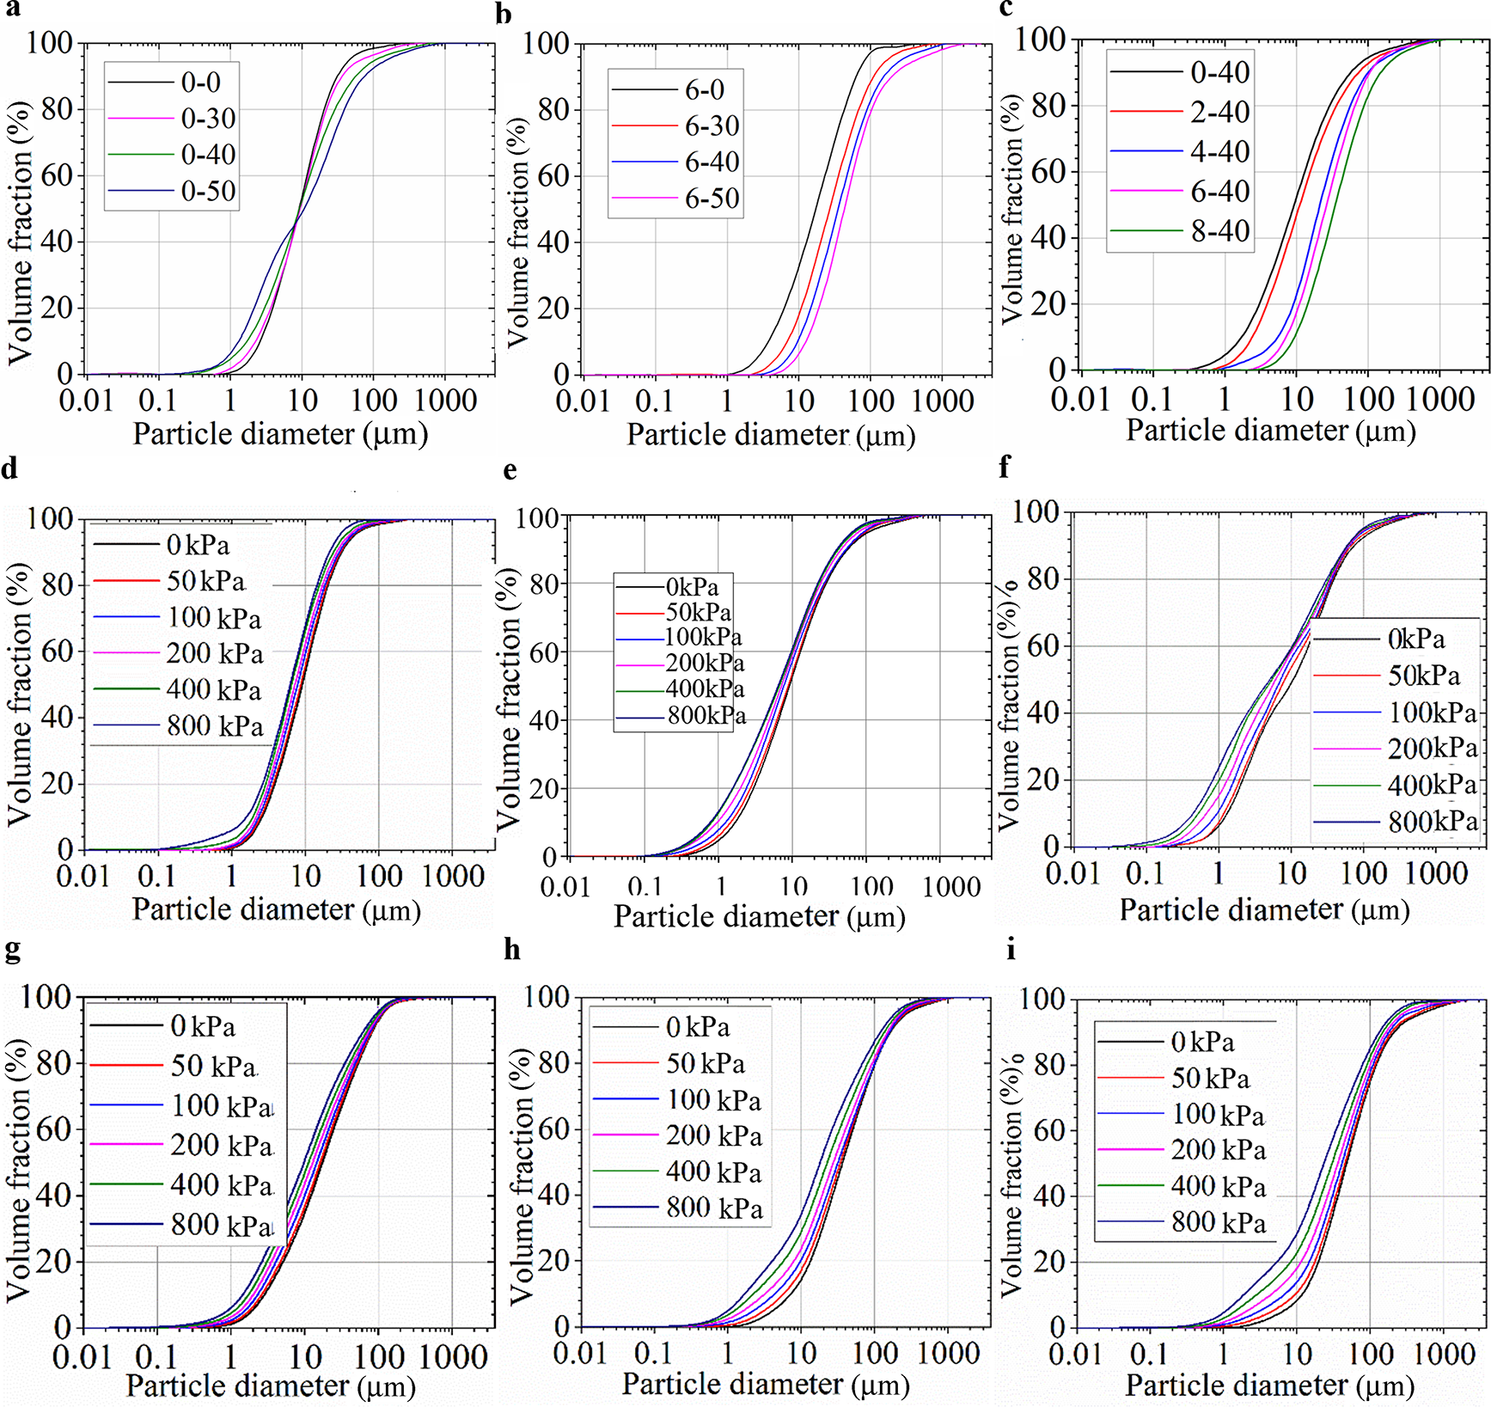
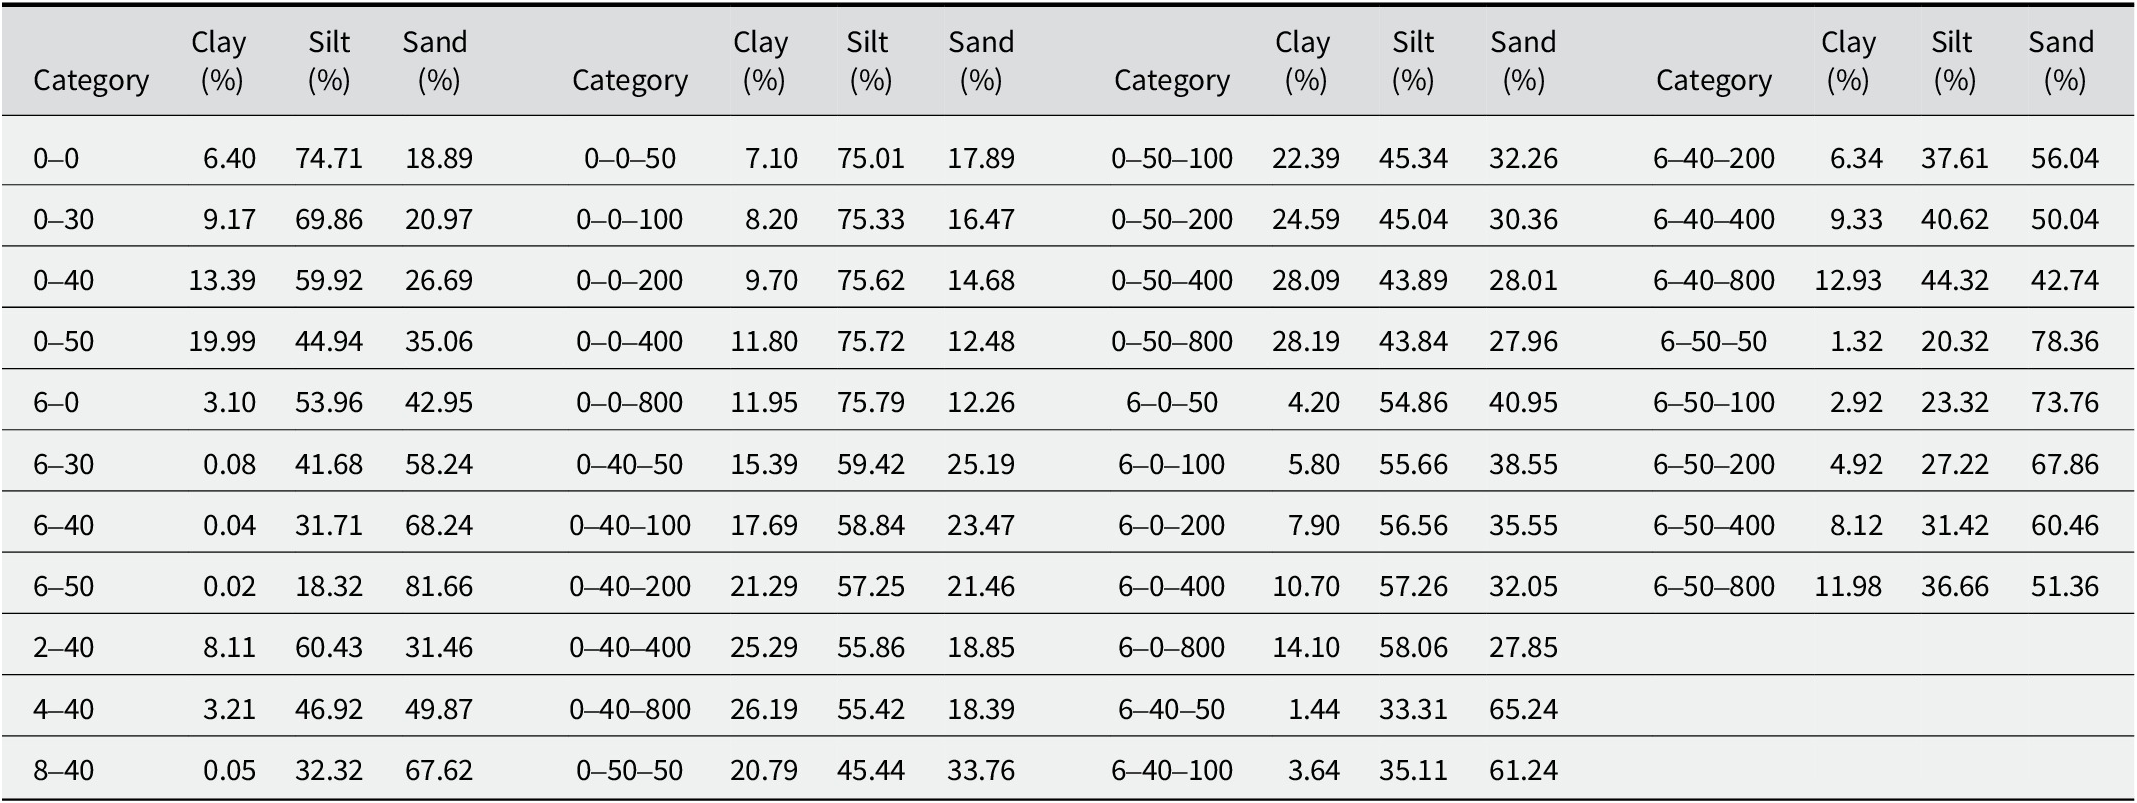
Systematic testing and analysis of the soil-particle size distribution clarified the effects of sand and diesel incorporation on the graded composition and revealed the dynamic evolution of the aggregate size distribution during consolidation. The testing protocol is detailed in Table 4. The particle-size distribution curves (Fig. 8) with specific diesel and sand contents and the summary of characteristic parameters of particle-size distribution (Table 5) indicated that with increasing sand content, the volume fractions of sand and clay particles increased, whereas the silt content decreased in uncontaminated soil; however, in contaminated soil, the clay and silt contents decreased, and the sand fraction increased. Diesel contamination further reduced the amounts of clay and silt, with a corresponding increase in the sand fraction. These changes in particle gradation led directly to the reorganization of particle arrangement, consequently inducing microstructural evolution, as detailed in the literature (Chun et al., Reference Chun, Liu, Liu, Zhou, Huang, Su and Liang2023a).
Particle-size distribution curves of soil with different diesel contents. (a–c) Particle-gradation curves of the soil with sand content of 40% and diesel admixture contents of 0.0 wt,% and 6.0 wt.%. (d–i) Particle-gradation distribution curves of the soil under different consolidation pressures with diesel and sand contents of 0.0 wt.% and 0%, 0.0 wt.% and 40%, 0.0 wt.% and 50%, 6.0 wt.% and 40%, and 6.0 wt.% and 50%, respectively.

Characteristic parameters of soil particle-size distribution under various diesel and sand contents

For ‘0–0–50’, the first value, 0, represents the diesel content; the second value represents the sand content; and the third value is the consolidation pressure.
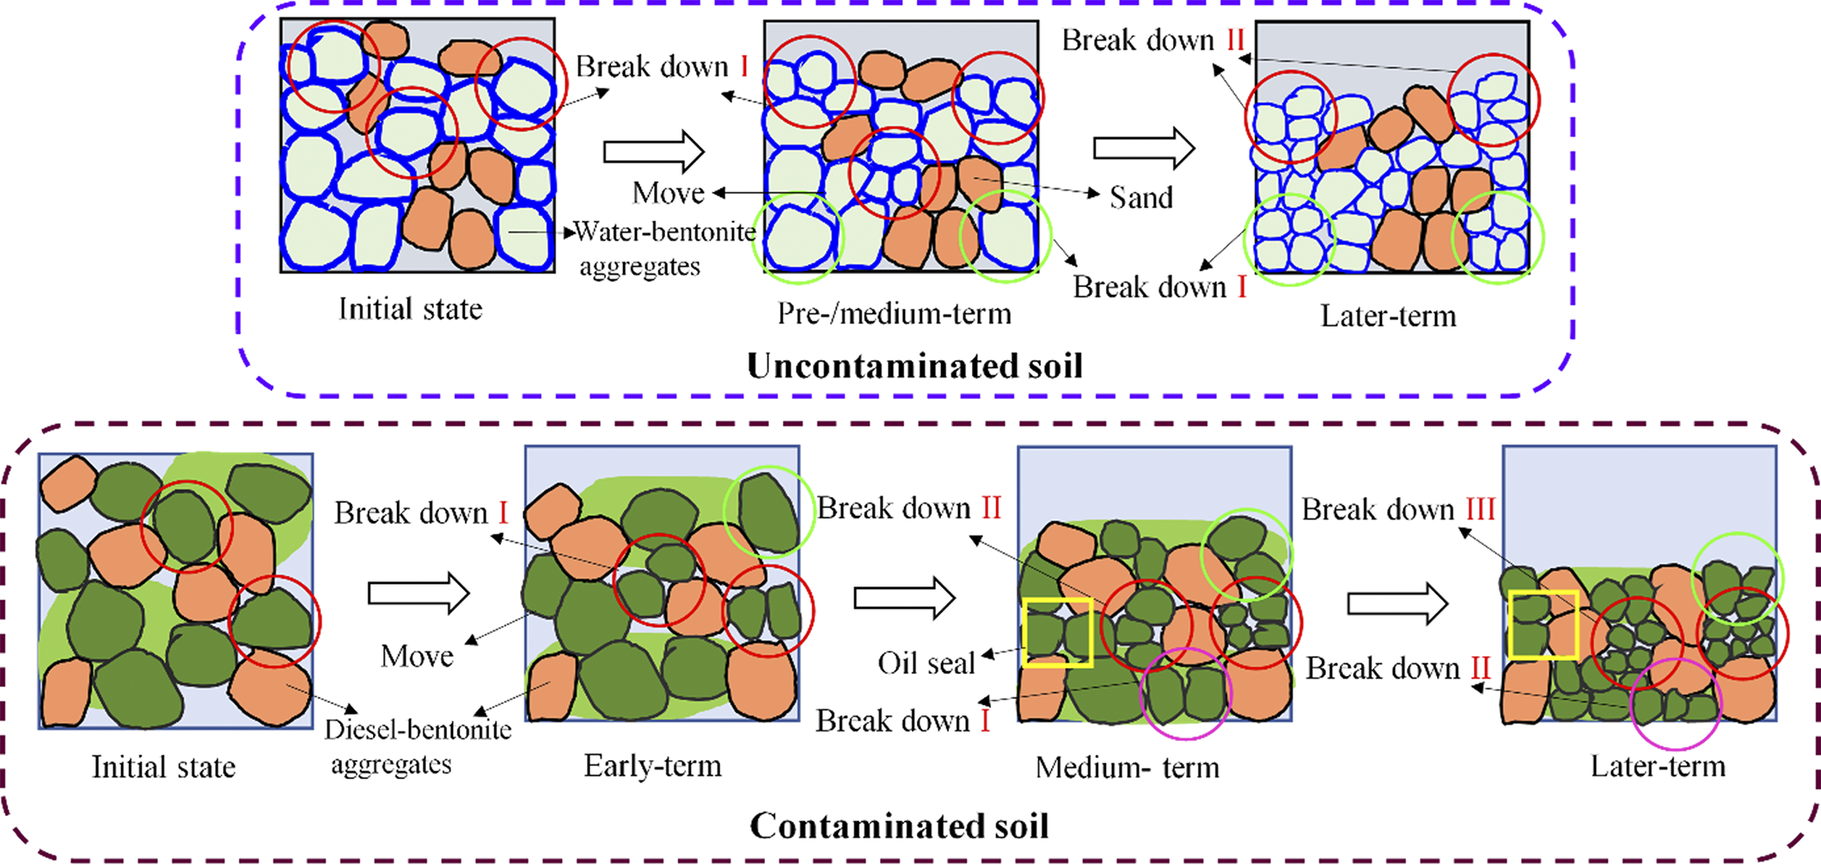
Under consolidation pressure, the aggregates broke down in both uncontaminated and contaminated soils, but the degree of fragmentation differed significantly. The aggregate breakdown characteristics at various consolidation pressures were quantified depending on the previously defined breakdown ratio. Analysis revealed that the breakdown of aggregates in uncontaminated soil exhibited distinct stage-specific characteristics. For example, in uncontaminated soil with 0% sand content, the breakdown ratios were 5.29, 7.94, 10.87, 14.99, and 1.76% under progressively increasing consolidation pressures. In contrast, the breakdown trend of the contaminated soil increased continuously; for instance, in the samples with 6.0 wt.% diesel and 0% sand, the breakdown ratios were 4.66, 5.86, 7.78, 9.85, and 13.11%, respectively.
Notably, aggregate breakdown occurred not only during the high-pressure stage (second stage), which was dominated by intra-aggregate pore compression but also partially during the low-pressure stage (first stage), dominated by inter-aggregate pore compression, contributing to the overall deformation. In this stage, the breakdown ratio was greater in uncontaminated soil than in contaminated soil, which was attributed to the greater viscosity of diesel than that of water, providing contaminated aggregates with greater structural strength and resistance to breakdown (Stoffyn-Egli and Lee, Reference Stoffyn-Egli and Lee2002; Ye et al., Reference Ye, Manning and Hsu2020; Sun et al., Reference Sun, Wang, Yang, Zhang, Chen and Zhao2024).
Upon entering the high-pressure consolidation stage (200–800 kPa), significant breakdown in uncontaminated soil occurred mainly between 200 and 400 kPa, contributing to deformation within this interval only, whereas contaminated soil experienced continuous breakdown throughout the entire 200–800 kPa range, leading to more frequent particle reorganization and skeletal adjustment and consequently greater deformation. These results indicated that contaminated soil underwent more frequent cycles of aggregate breakdown and reorganization during consolidation, which readily induced repeated structural collapse and pore-space release, thereby increasing overall compressibility.
Furthermore, with increasing sand and diesel contents, the number and size of large aggregates increased in the soil, making them more prone to multi-stage breakdown during progressive loading, which further contributed to consolidation deformation (Dai et al., Reference Dai, Zhang, He, Zhang, Shan and Xia2021; Yuan et al., Reference Yuan, Gan, Chen, Tan and Zhao2023). This process was validated directly through microstructural images.
Effect of soil microstructure on consolidation time
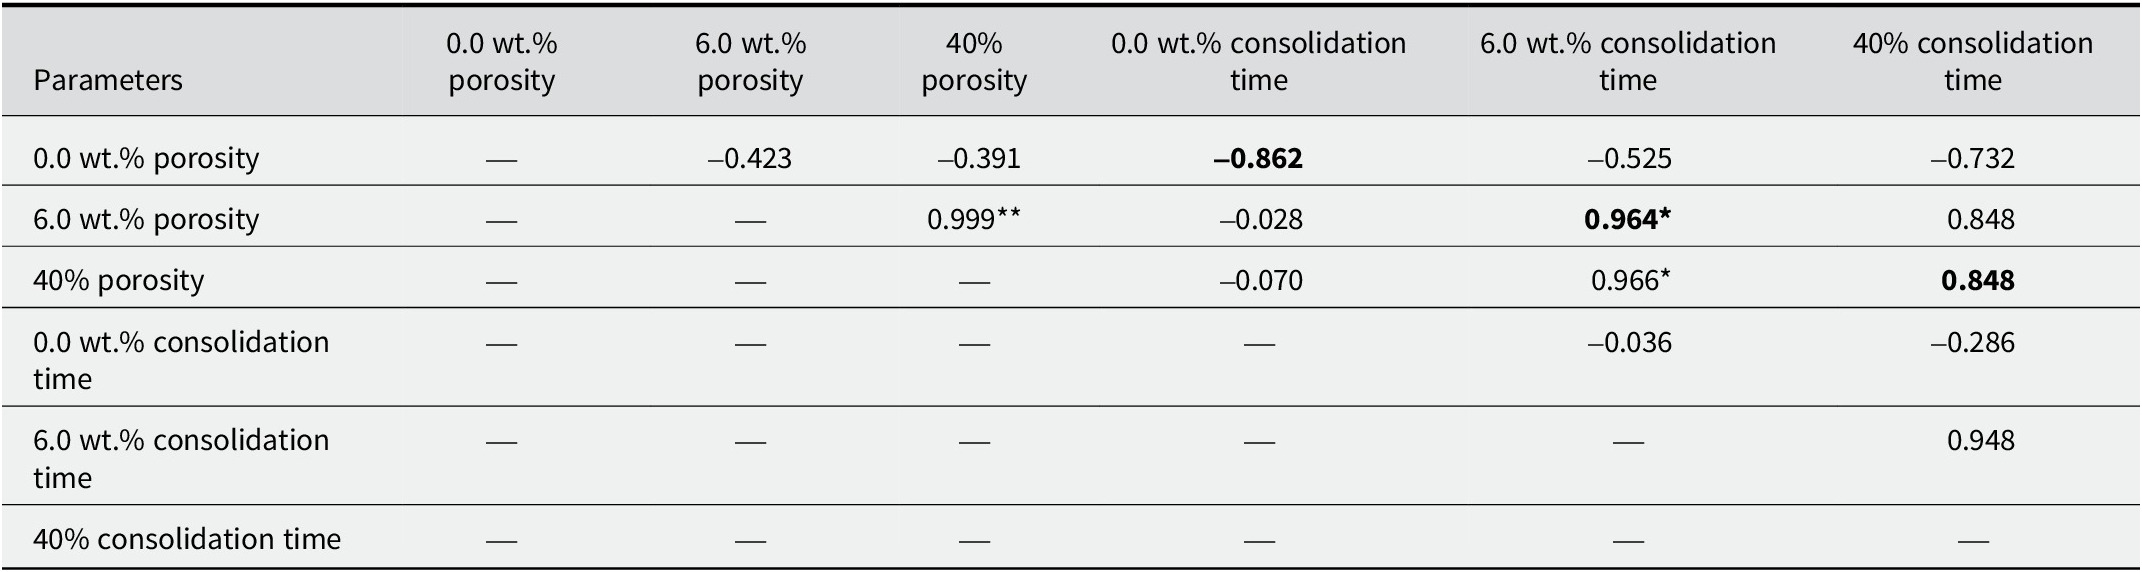
According to Terzaghi’s consolidation theory, soil reaches a stable consolidation state when the excess pore water pressure is completely dissipated, and the effective stress approaches its final steady value (Shi and Yin, Reference Shi and Yin2018; Van Rijn and Barth, Reference Van Rijn and Barth2019). The dissipation rate of the excess pore water pressure is closely related to the pore structure; generally, larger pore spaces facilitate more efficient water-migration pathways, leading to faster dissipation and shorter consolidation times (Amarasinghe et al., Reference Amarasinghe, Katti and Katti2012; Ye et al., Reference Ye, Manning and Hsu2020). To investigate the relationship between porosity and consolidation duration quantitatively, this study employed Pearson correlation analysis, with the results provided in Table 6.
Pearson correlation between various diesel and sand contents and the time to reach consolidation stability

Notes: 0.0 wt.% porosity, 6.0 wt.% porosity, and 40% porosity refer to the porosity of polluted soil with diesel content of 0.0 wt% and 6.0 wt%, respectively, and sand content of 40%. 0.0 wt.% consolidation time, 6.0 wt.% consolidation time, and 40% consolidation time refer to the time required for polluted soil with diesel content of 0.0 wt% and 6.0 wt%, respectively, and sand content of 40% to reach consolidation stability. ** High significance (P<0.01); *significant (P<0.05).
The analysis revealed that in uncontaminated soil (0.0 wt.% diesel), increasing the sand content resulted in a significant negative correlation between porosity and consolidation time (R 2=–0.862), which is consistent with classical permeability theory. In contrast, contaminated soil (6.0 wt.% diesel) was significantly positively correlated (R 2=0.964). Similarly, with a fixed sand content, increasing diesel content was correlated positively with porosity and consolidation time (R 2=0.848). This opposite trend indicates that diesel contamination alters the seepage mechanism in soil significantly.
The present authors propose that this anomaly is closely associated with the distribution of adsorbed and free-phase diesel in the pores. When the diesel content is constant, increased sand content reduces the bentonite fraction, thereby decreasing the proportion of adsorbed diesel and increasing free-phase diesel. Owing to the immiscibility of diesel and water, free diesel has an oil-blocking effect on the pores, hindering water drainage significantly (Chun et al., Reference Chun, Liu, He, Wei and Su2024). Thus, although increased sand content enhances porosity, the accompanying improvement in permeability is offset by the flow resistance caused by free diesel, resulting in reduced net permeability, delayed dissipation of excess pore water pressure, and a prolonged consolidation time (Wei et al., Reference Wei, Han, Wang, Wang, Sun and Yan2020; Izdebska-Mucha and Trzciński, Reference Izdebska-Mucha and Trzciński2021). Similarly, with a fixed sand content, an increased diesel content increases the total porosity but also increases the free diesel content substantially, further impeding water seepage and extending the consolidation duration, as shown in the microscopic evolution of Fig. 9.
Diesel fuel content 0.0 wt.% and 6.0 wt.% multi-level fragmentation mechanism of aggregates during soil consolidation process.

Effect of soil microstructure on rebound deformation
According to previous studies, the rebound performance of soil is governed primarily by its microstructural characteristics, including inter-aggregate connectivity, inter-particle friction, and pore-structure complexity (Chen et al., Reference Chen, Tang, Zhu, Shi and Liu2017). An increase in the sand content generally enhances the soil’s rebound capacity because of the larger particle size, more regular shape, and relatively uniform size distribution of the sand grains, which form well-connected pore structures and weaker inter-particle bonds. During consolidation, the particles undergo reversible displacement under external stress; upon unloading, the lower inter-particle friction facilitates rebound, resulting in greater recovery (Gao and Wang, Reference Gao and Wang2016). However, when the sand content becomes excessively high (e.g. 50%), the original structure is thoroughly disrupted during consolidation, making it difficult to re-establish effective elastic recovery paths and leading to reduced rebound capacity in uncontaminated soil.
Under steady diesel content, increased sand content not only increased porosity but also significantly reduced pore-structure complexity, weakening mechanical interlocking between particles. This reduction in energy barriers to particle rebound should theoretically improve rebound performance. However, compared with uncontaminated soil, diesel-contaminated soil exhibited overall weaker rebound capacity, mainly because of the high viscosity of diesel, which increased resistance to particle movement and thereby inhibited rebound.
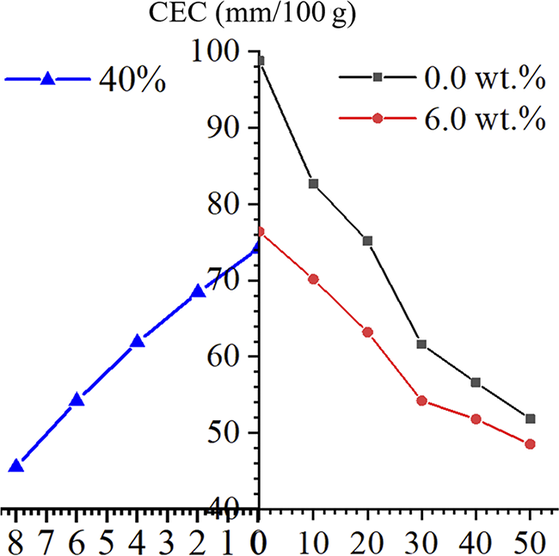
Furthermore, the adsorption of diesel on bentonite particles hindered their contact with water molecules, significantly reducing their hydration capacity, a key factor influencing rebound behavior. This mechanism was supported indirectly by changes in the CEC of diesel-contaminated soil (Fig. 10). As the formation of a hydration film is critical to the elastoplastic behavior of bentonite, its impairment led directly to a diminished rebound capacity during unloading (Ur-Rehman et al., Reference Ur-Rehman, Abduljauwad and Akram2007; Chun et al., Reference Chun, Liu, He, Wei and Su2024).
Cation exchange capacity of soil particles with diesel contents of 0.0 wt.% and 6.0 wt.% and a sand content of 40%.

Effect of soil microstructure on rebound time
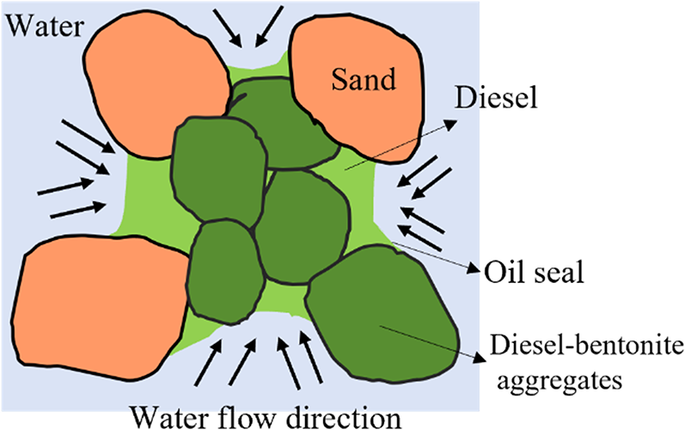
As described previously, an increase in the sand content reduces the structural complexity of the soil and decreases the intrinsic resistance to particle movement, thereby accelerating the restoration of particle positions during rebound. Thus, in uncontaminated soil, a greater sand content generally corresponds to a shorter rebound stabilization time. With respect to diesel-contaminated soil, the rebound behavior is not only influenced by structural complexity but also governed by free-phase diesel. On the one hand, increased sand content similarly reduces the structural complexity of contaminated soil, diminishing mechanical resistance during particle rebound and contributing to a shorter rebound duration. On the other hand, the presence of free-phase diesel in the pores impedes the infiltration of external water, inhibits the formation of hydrated films on particle surfaces, and weakens the deformability of the soil in the later rebound stage, further prompting an earlier termination of the rebound process (Hueckel et al., Reference Hueckel, Kaczmarek and Caramuscio2011; Delage, Reference Delage2015). These two factors lead collectively to a significantly shorter rebound stabilization time in contaminated soil with greater sand content, and the integrated mechanism is illustrated in the schematic Fig. 11.
The oil-seal effect during the rebound process hinders water flow.

Economic feasibility analysis
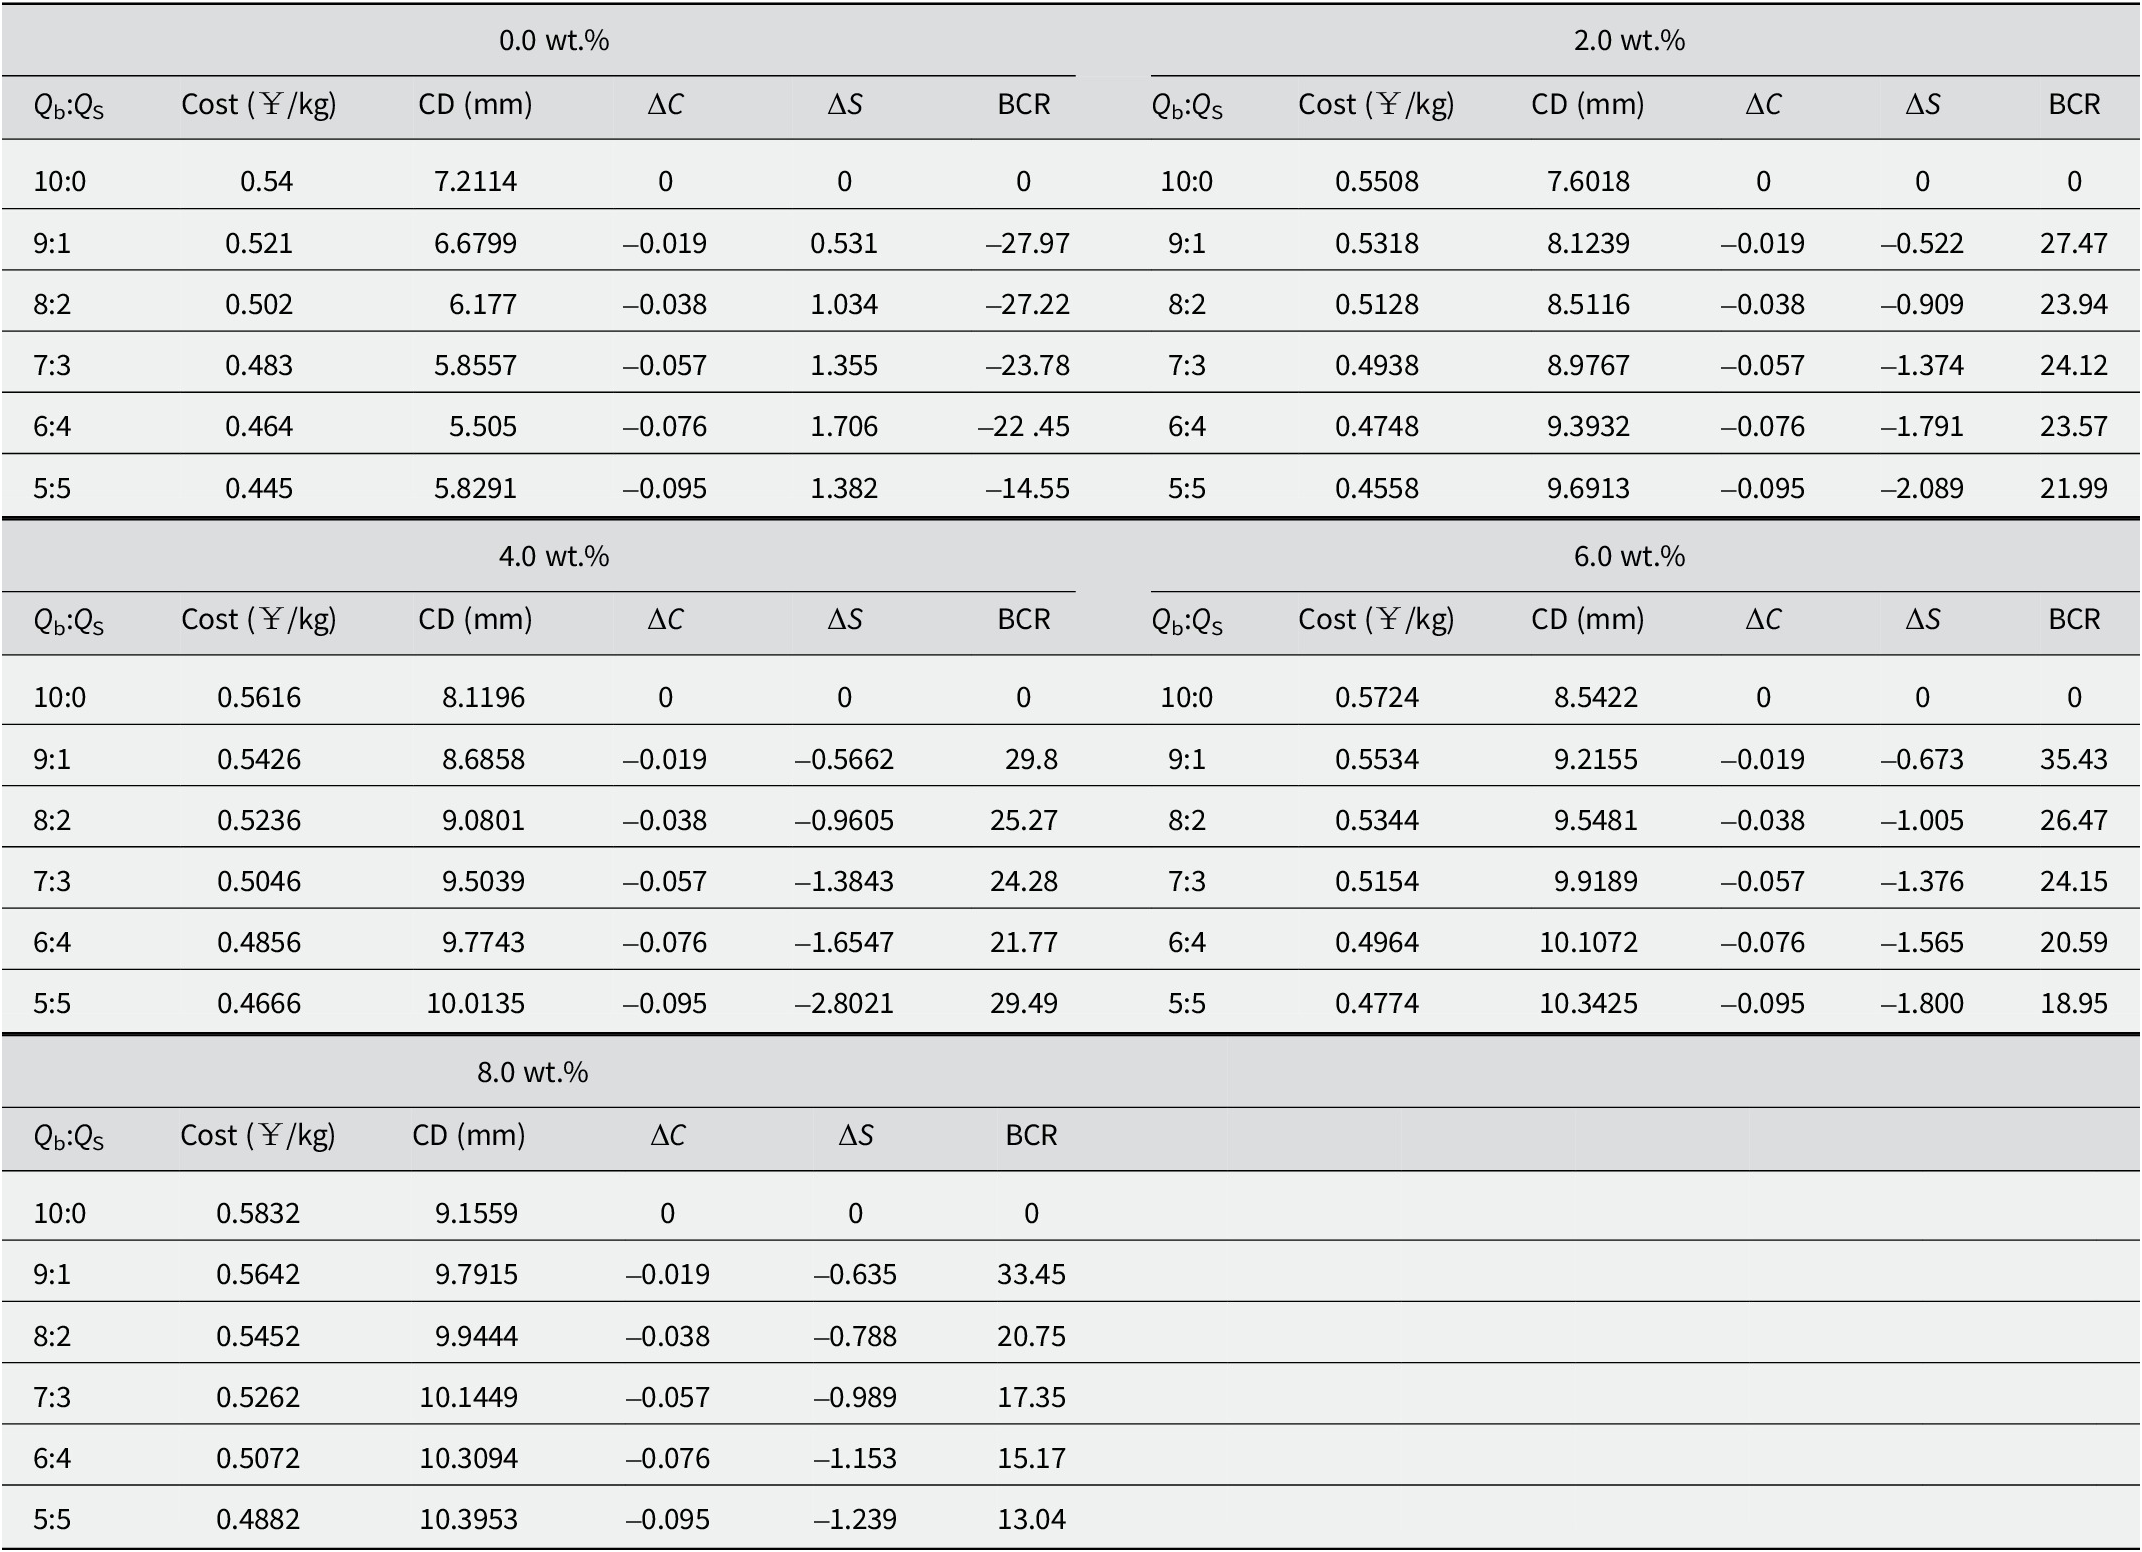
To evaluate the engineering properties of sand–bentonite–diesel mixtures as barrier materials, a cost–performance benefit analysis was conducted on the basis of compression deformation and cost data. Using the mixture with 0% diesel and 0% sand as the benchmark, the benefit–cost ratio (BCR) for each formulation was calculated and is summarized in Table 7.
Economic cost of mixed soil under various diesel and sand contents

Q b:Q S = mass ratio of bentonite to sand in 1 kg of mixed soil, Q b represents bentonite, and Q S represents sand; CD = consolidation deformation (mm); ΔC represents the amplitude of change in consolidation deformation (mm), ΔS represents the magnitude of cost change (¥/kg); BCR represents the benefit ratio (mm·kg/¥).
The analysis revealed that under uncontaminated conditions, all the BCR values were negative (e.g. 0, –27.97, –27.22, –23.78, –22.45, and –14.55), indicating that each unit reduction in cost resulted in increased compression deformation of the mixed soil layer, confirming that the benchmark mixture offered the greatest cost-effectiveness. Under contaminated conditions, all the BCR values were positive and decreased with increasing sand content, demonstrating that each additional unit of investment reduced compression deformation to varying degrees. The highest BCR value was observed at a 10% sand content, indicating that this formulation achieved the greatest reduction in compression deformation with the least investment (Obura et al., Reference Obura, Akamushaba, Khaldi and Dadebo2023).
Therefore, from a techno-economic perspective, pure bentonite is recommended for uncontaminated environments, whereas a sand content of 10% is identified as the economically optimal formulation for contaminated environments, indicating that incorporating an appropriate amount of sand enhances the performance and engineering feasibility of the mixed soil barrier.
Conclusions
The structural stability of barrier liners is crucial for long-term performance, yet prone to degradation under combined organic leachate erosion and overlying stress, elevating contamination risk. This study investigated the consolidation–rebound evolution and underlying microscopic mechanisms in diesel-affected sand–bentonite liners using macro- and micro-scale tests. Key conclusions are:
-
(1) As the sand content increased, the compression (from 7.211 mm to 5.505 mm) and duration (from 136.47 h to 98.16 h) of uncontaminated soil first decreased, then increased to 5.829 mm and 103.64 h, respectively. Rebound deformation showed the opposite trend. For contaminated soil, both compression and duration increased continuously with sand and diesel content, while rebound values decreased consistently. Diesel contamination caused complex variations in consolidation–rebound behavior, reducing long-term barrier performance.
-
(2) Consolidation deformation in the early stages was closely related to inter-aggregate porosity, whereas deformation in the mid- to late-stages was caused by intra-aggregate pore restructuring and particle fragmentation. Diesel-contaminated soil exhibited lower porosity, but oil infiltration reduced shear strength, leading to non-linear deformation growth. Additionally, repeated aggregate breakdown in contaminated soil resulted in progressive deformation accumulation throughout all stages. Diesel also altered consolidation behavior by modifying surface properties (CECs).
-
(3) Increased sand content improved rebound by enlarging pores and loosening structures, but excessive porosity limited recovery because of the structural damage. Diesel inhibited bentonite hydration and blocked water re-entry, reducing rebound and amplifying sand-induced deformation and accelerating failure. Analysis indicated that pure bentonite (0% sand) had the lowest BCR (–27.97 mm·kg/¥) with ‘clean’ conditions, whereas the 10% sand mixture had the highest BCR (29.8 mm·kg/¥ with 4.0 wt.% diesel), confirming optimal cost-effectiveness. This study explained consolidation–rebound mechanisms in landfill liners, supporting long-term performance predictions.
Author contribution
All of the authors contributed to the study’s conception and design. Material preparation, data collection, and analysis were performed by Y.Y. and Y.C. The first draft of the manuscript was written by Y.Y., and all authors commented on previous versions of the manuscript. All of the authors have read and agreed to the published version of the manuscript.
Acknowledgements
None.
Financial support
The authors are grateful to the Postdoctoral Fellowship Program of CPSF (GZC20233149), the National Natural Science Foundation of China (42067045), the 2023 Guangxi University Young and Middle-aged Teachers Scientific Research Basic Ability Improvement Project (project no. 2023KY0177),and Hunan Provincial Natural Science Foundation Youth Science Fund Project (2025JJ60245).
Competing interests
The authors declare that the research was conducted in the absence of any commercial or financial relationships that could be construed as a potential conflict of interest.
Data availability statement
The original data presented in this study are included in the article. Further enquiries can be directed to the corresponding author.